Elastic SIEM detections
Editor’s Note — August 19, 2020: The Elastic SIEM solution mentioned in this post is now referred to as Elastic Security. The broader Elastic Security solution delivers SIEM, endpoint security, threat hunting, cloud monitoring, and more. If you're looking for more specific information on Elastic Security for SIEM use cases, visit our SIEM solution page.
With the release of Elastic Security 7.6, we've announced our creation of a modern detection engine that provides SOC teams with a unified SIEM rule experience through Elastic SIEM detections. The detection engine draws from a purpose-built set of Elasticsearch analytics engines and runs on a new distributed execution platform in Kibana. In this post, we provide a brief overview of the flow of detections in Elastic SIEM and discuss the new UI and backend features that help these detections work seamlessly for our users.
Before we jump into detections, a quick note: if you are ready to try the SIEM app, check out our SIEM for small businesses and at home blog series. The series covers getting set up on the cloud with our free trial of Elasticsearch Service, using Beats to securely collect and stream data from your systems to the SIEM, and more. (It’s far easier than you would think!) We also offer a getting started guide for hybrid deployments.
UI workflow for signal management
The bread and butter of Elastic SIEM detections are signals, which are Elasticsearch documents created when a signal detection rule's conditions are satisfied. In the simplest case, one signal document is created for each event matching the query defined in the rule. The signal document contains a copy of the fields from the matching document, and is kept in a separate signals index. The original events are not modified when a signal is created.
Signals are surfaced in the SIEM app. When a practitioner first sees a new signal, it is in an open state. After analysis and determining the next steps, the practitioner changes it to a closed state. All of these changes can be managed in the Detections view in the SIEM app.
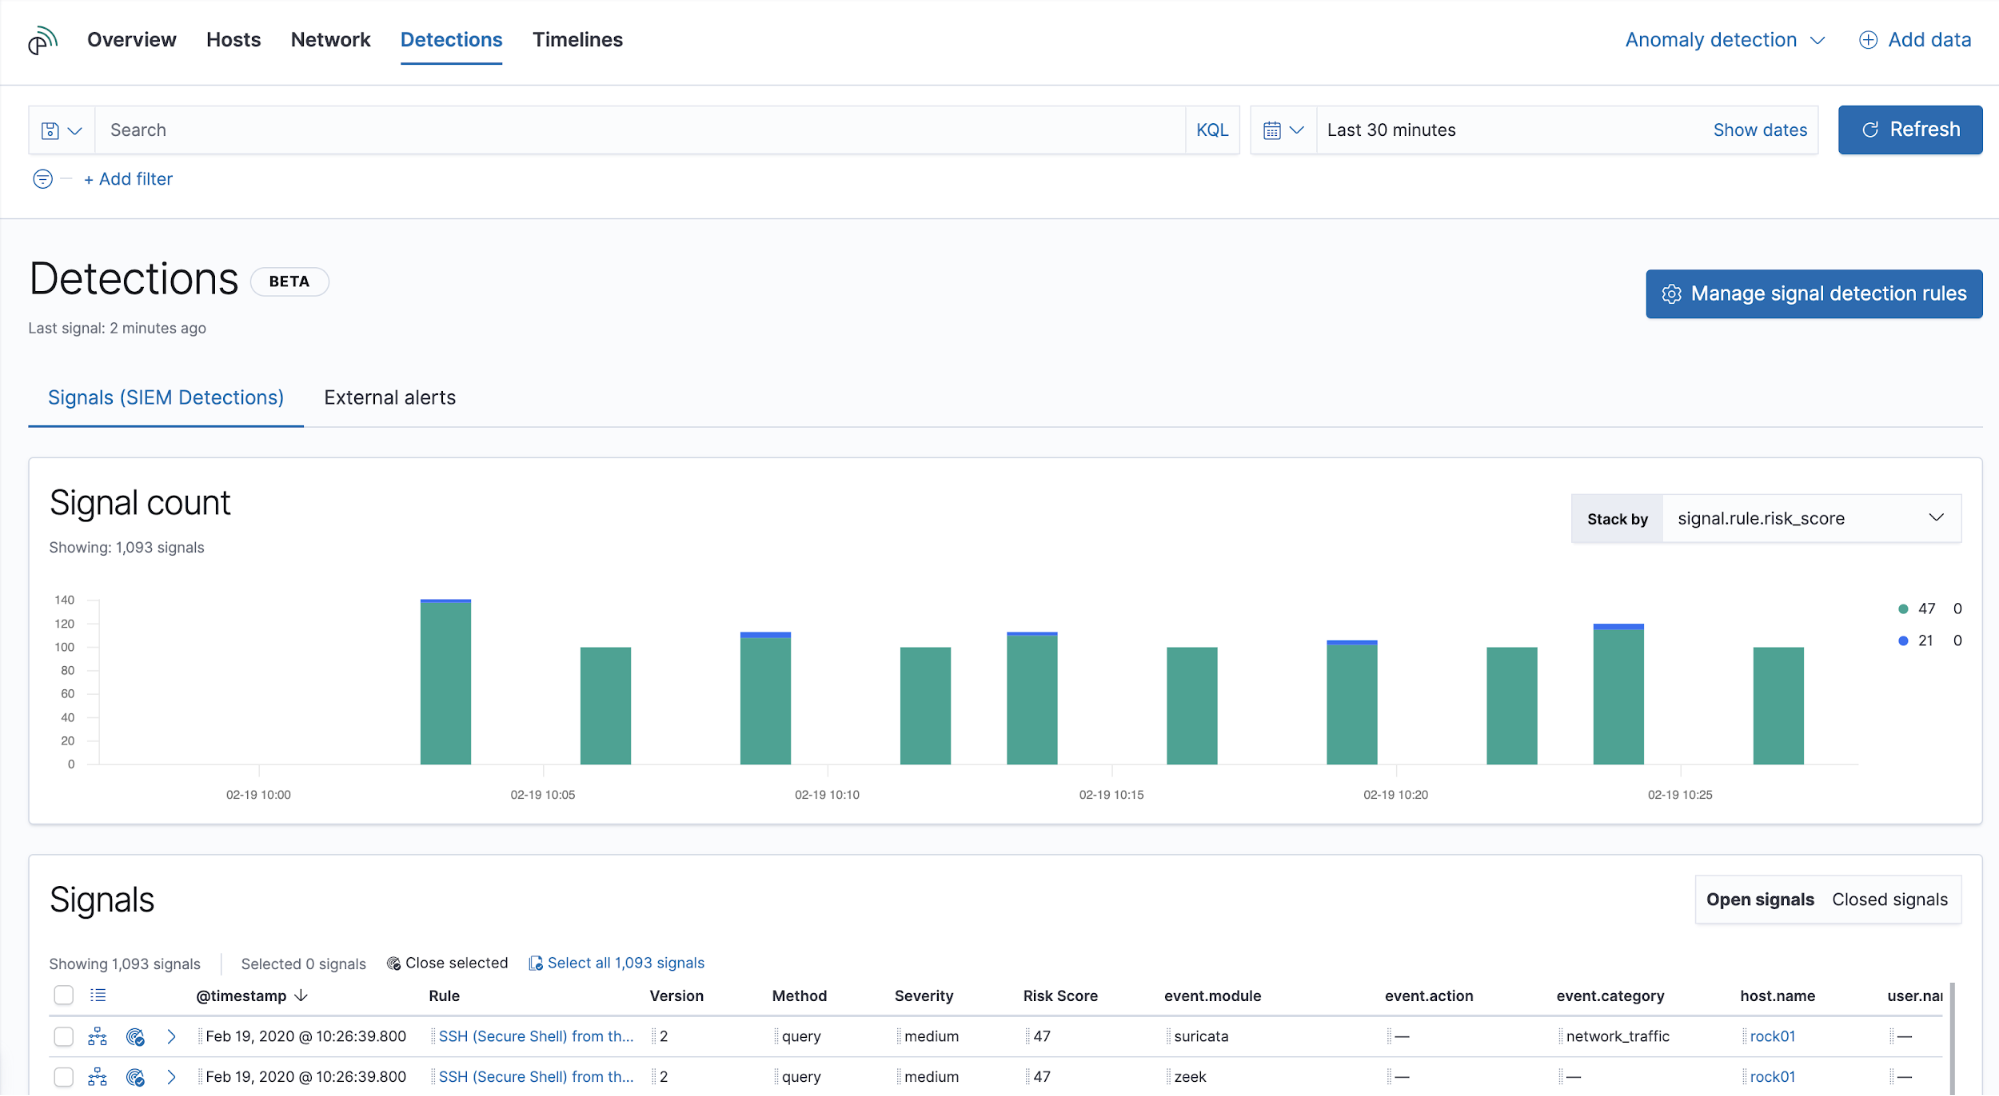
The signal count histogram shows open signals and enables quick comparisons across key attributes:
- Score, severity, type, name, or MITRE ATT&CK™ tactic name
- Source or destination IP address
- Event action or category
- Host or user name
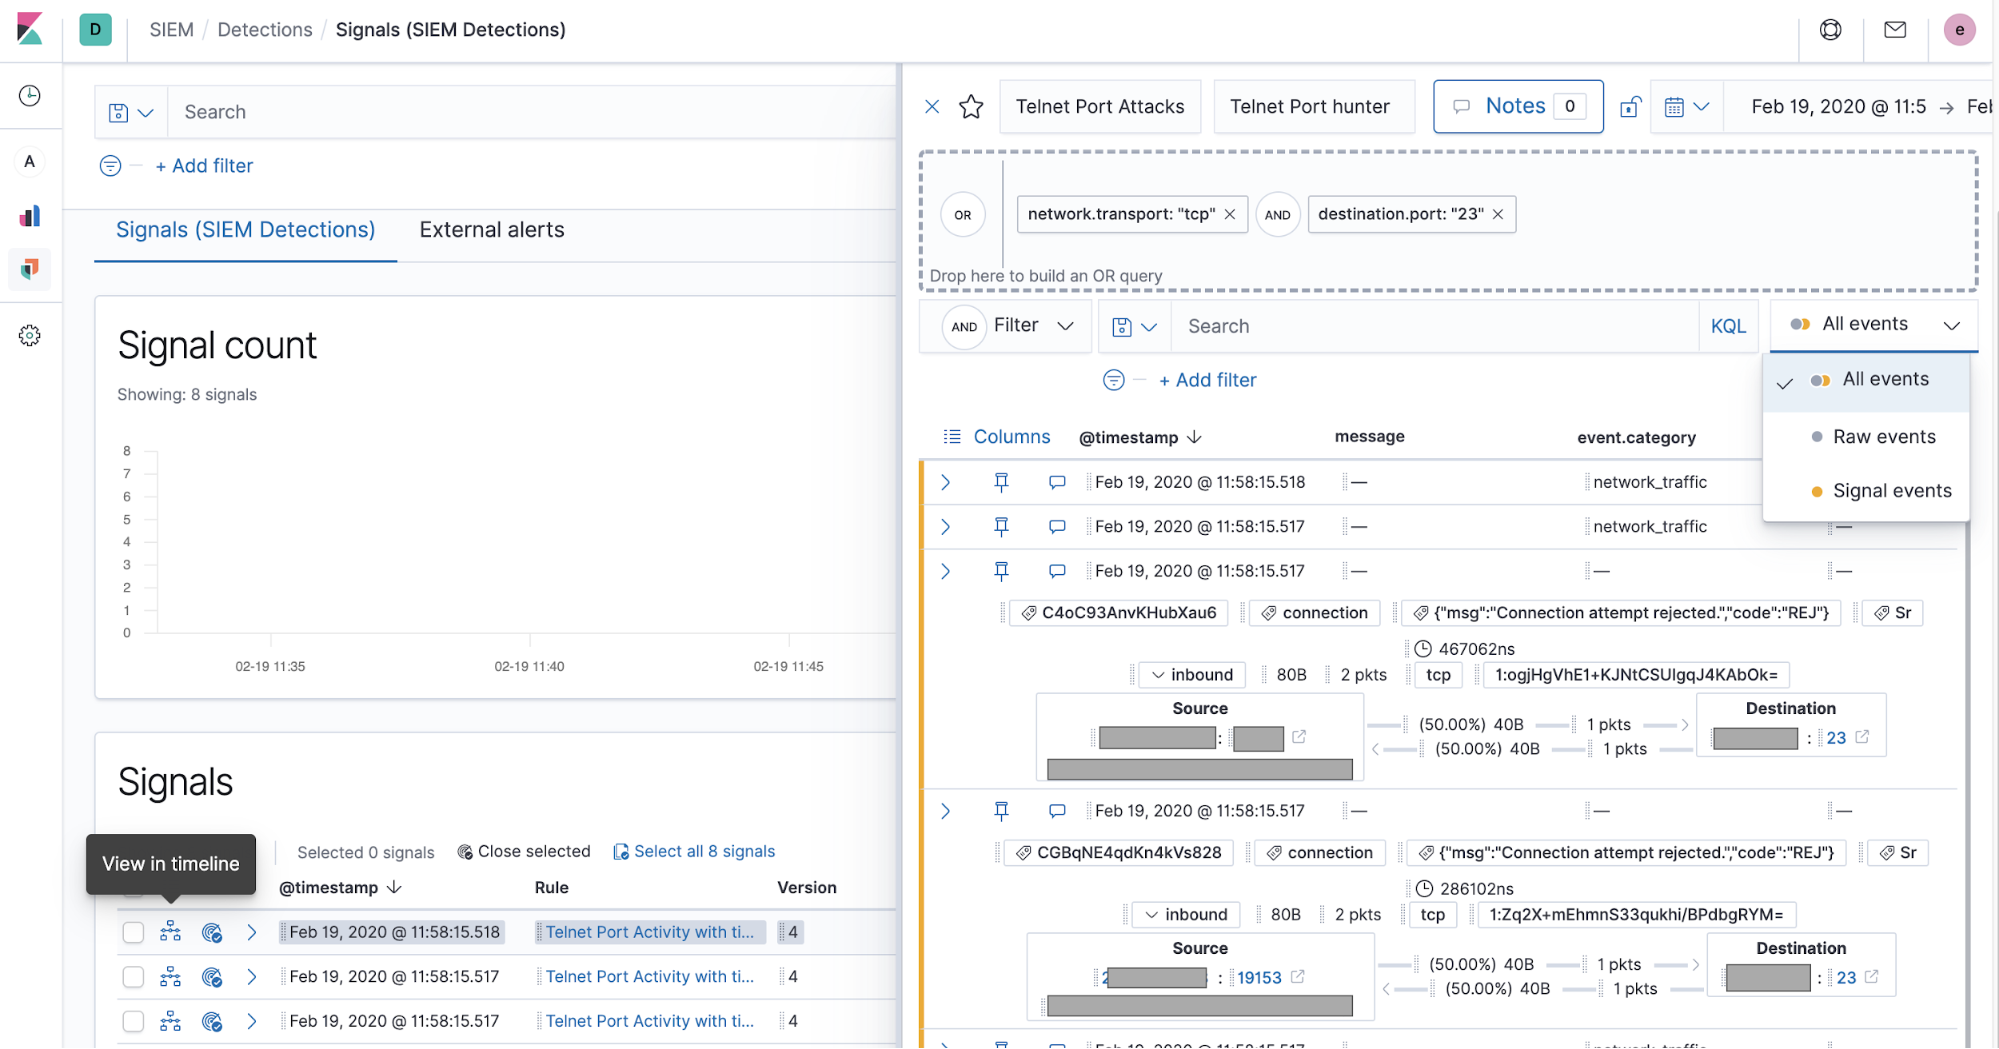
Investigating signals in the Timeline is the next step:
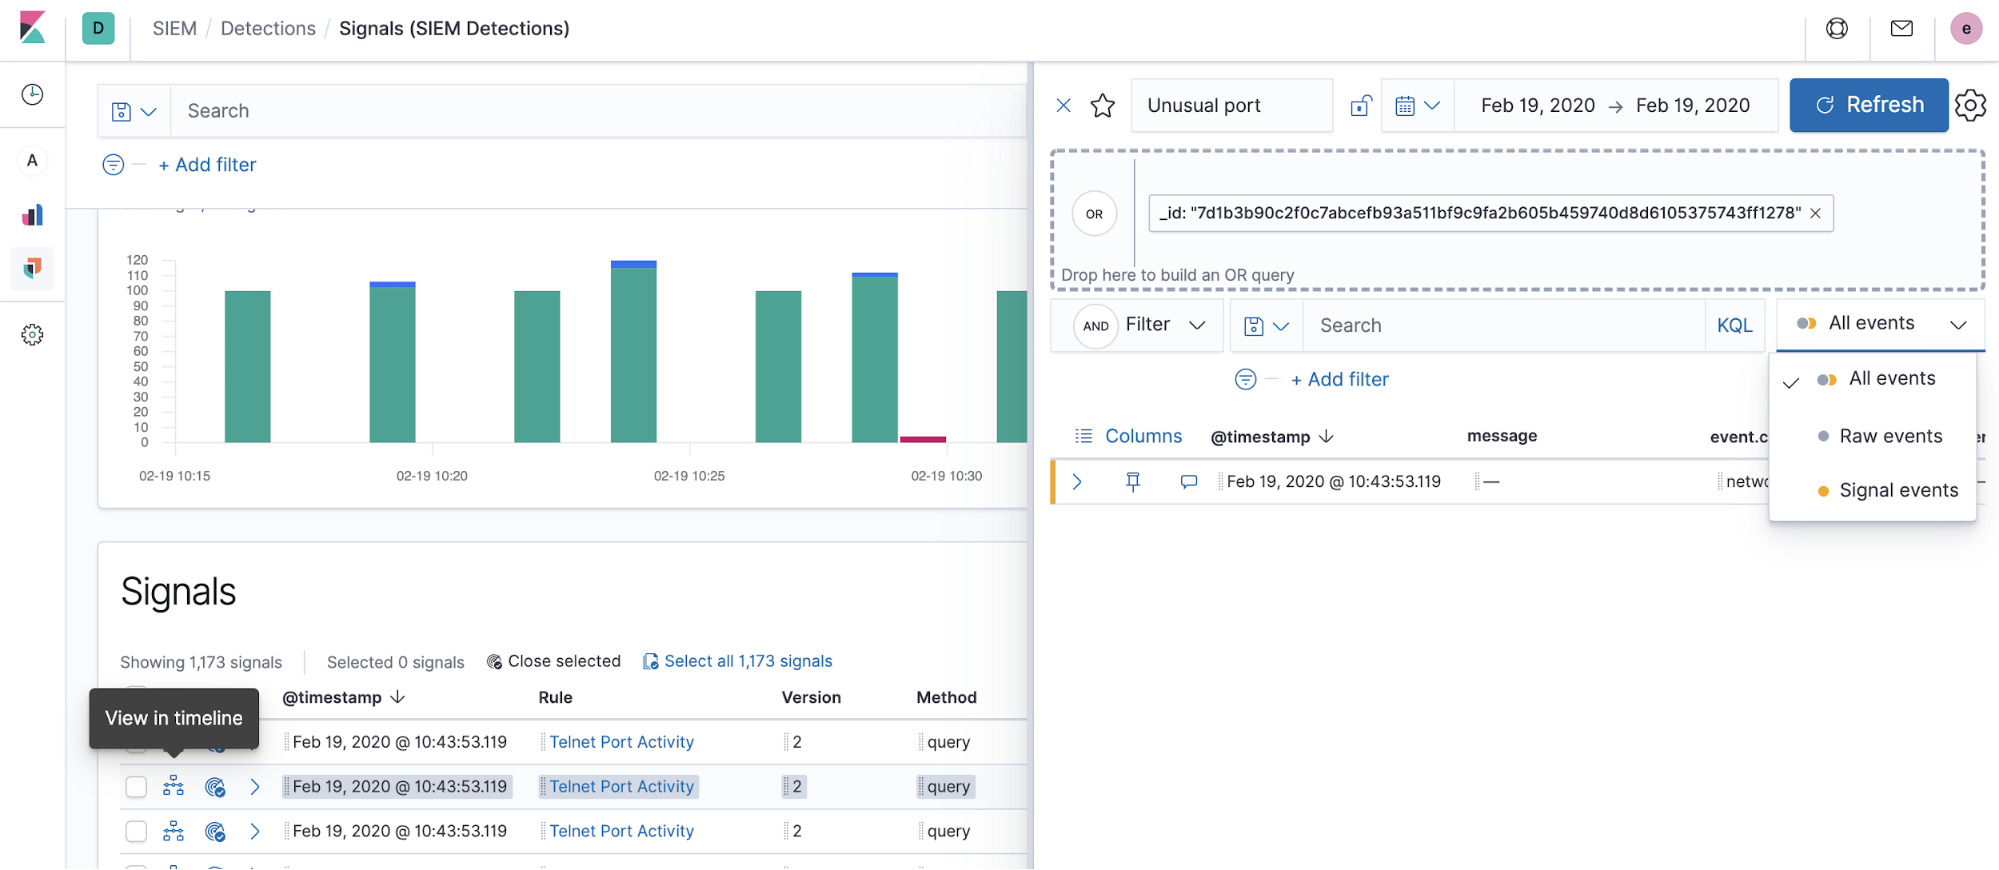
If you did not specify a timeline template when creating a rule, the Timeline is populated with a signal document. If you did specify a timeline template, the Timeline will be populated with what the user saved, speeding up investigations for certain types of rules.
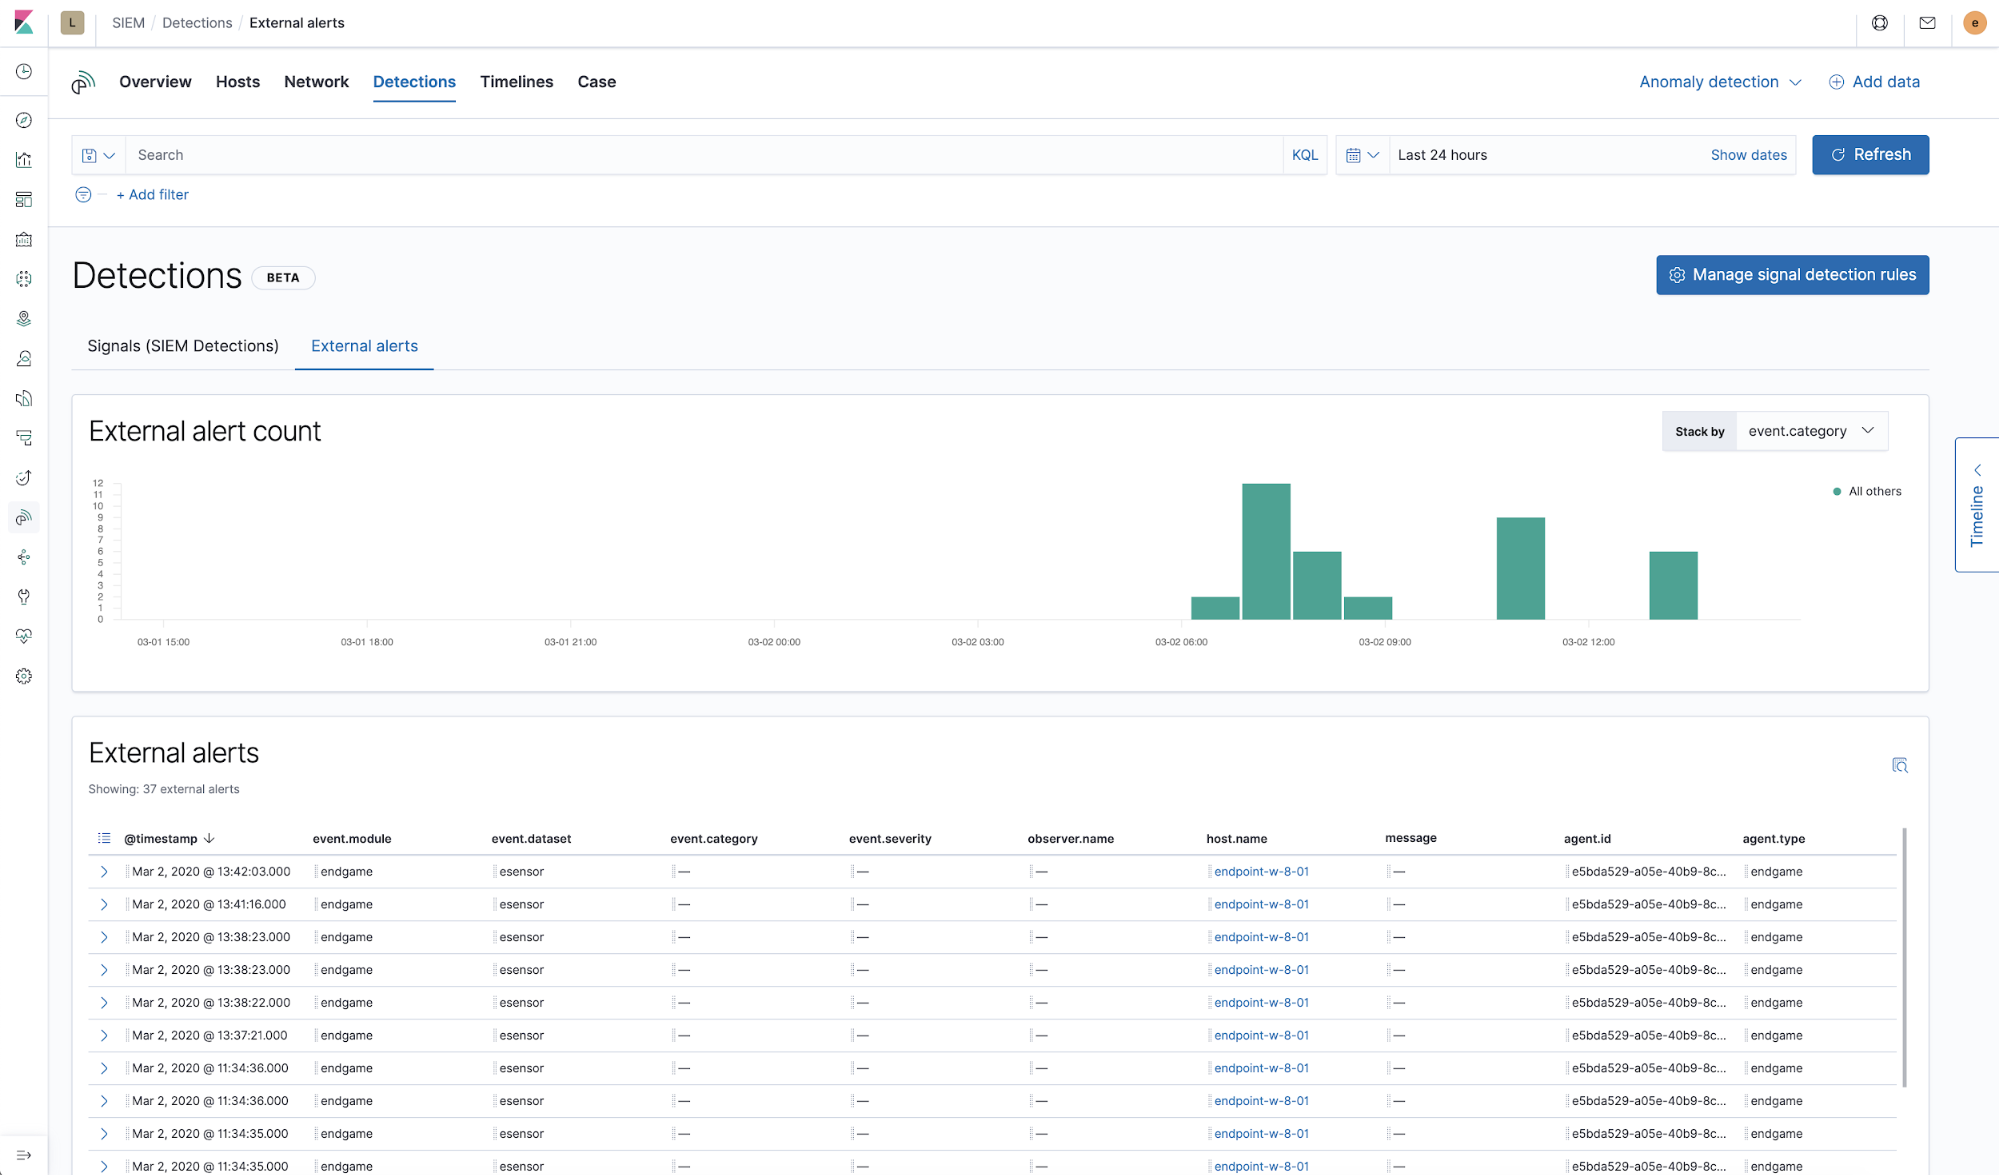
Practitioners can view alerts from external alerting systems, such as Elastic Endpoint Security, Suricata, or Zeek, in the dedicated `External alerts` tab. Many organizations also implement rules generating signals for high-value external alerts so that they can benefit from the enhanced investigative workflow for signals.
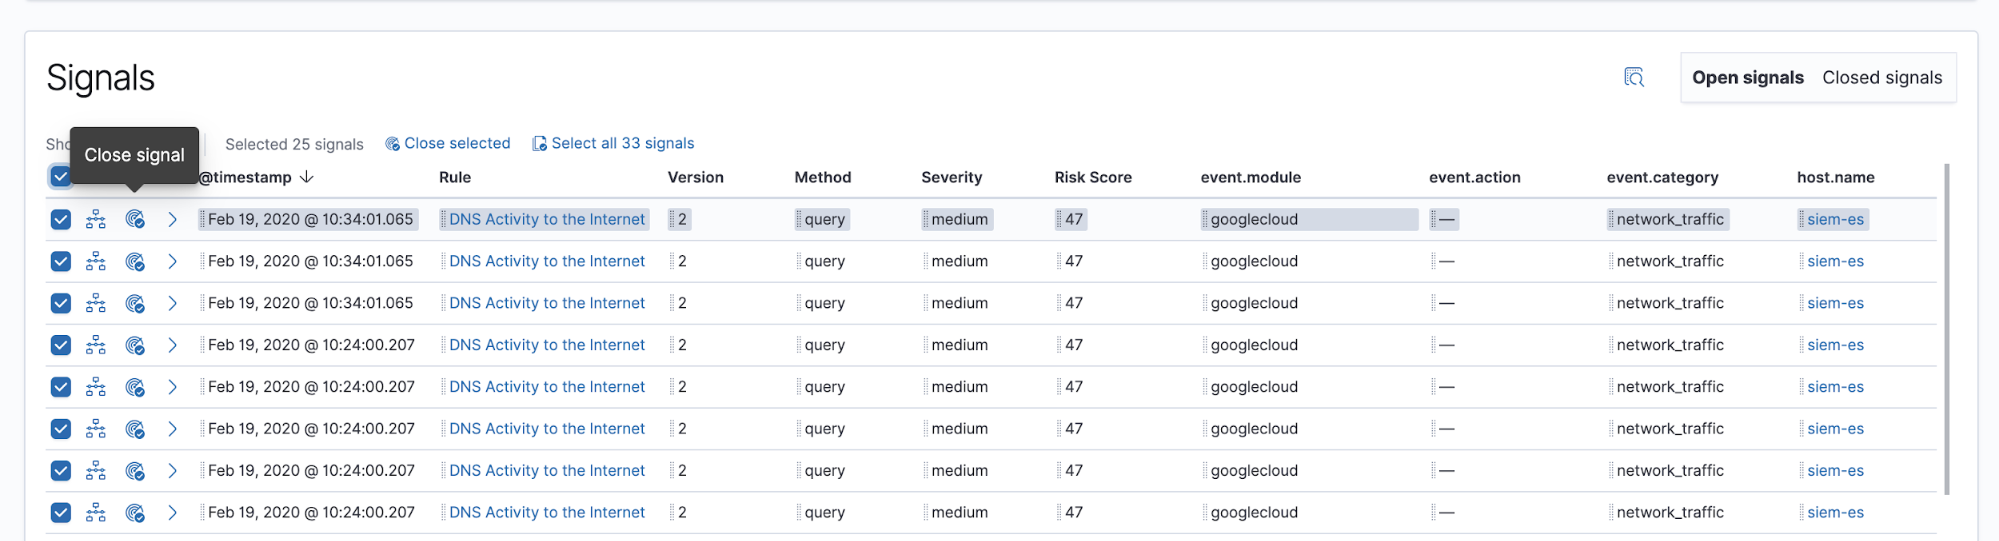
Once a signal or set of signals has been investigated to the analyst’s satisfaction, they can close the signals individually or in bulk. Signals can also be reopened, if necessary. We’re working on ways to automate the closing of signals in future releases.
UI workflow for creation of rules
For signals to start showing up, detections need rules to run! Creating a rule for SIEM detections is simple and straightforward. It comes down to three basic steps:
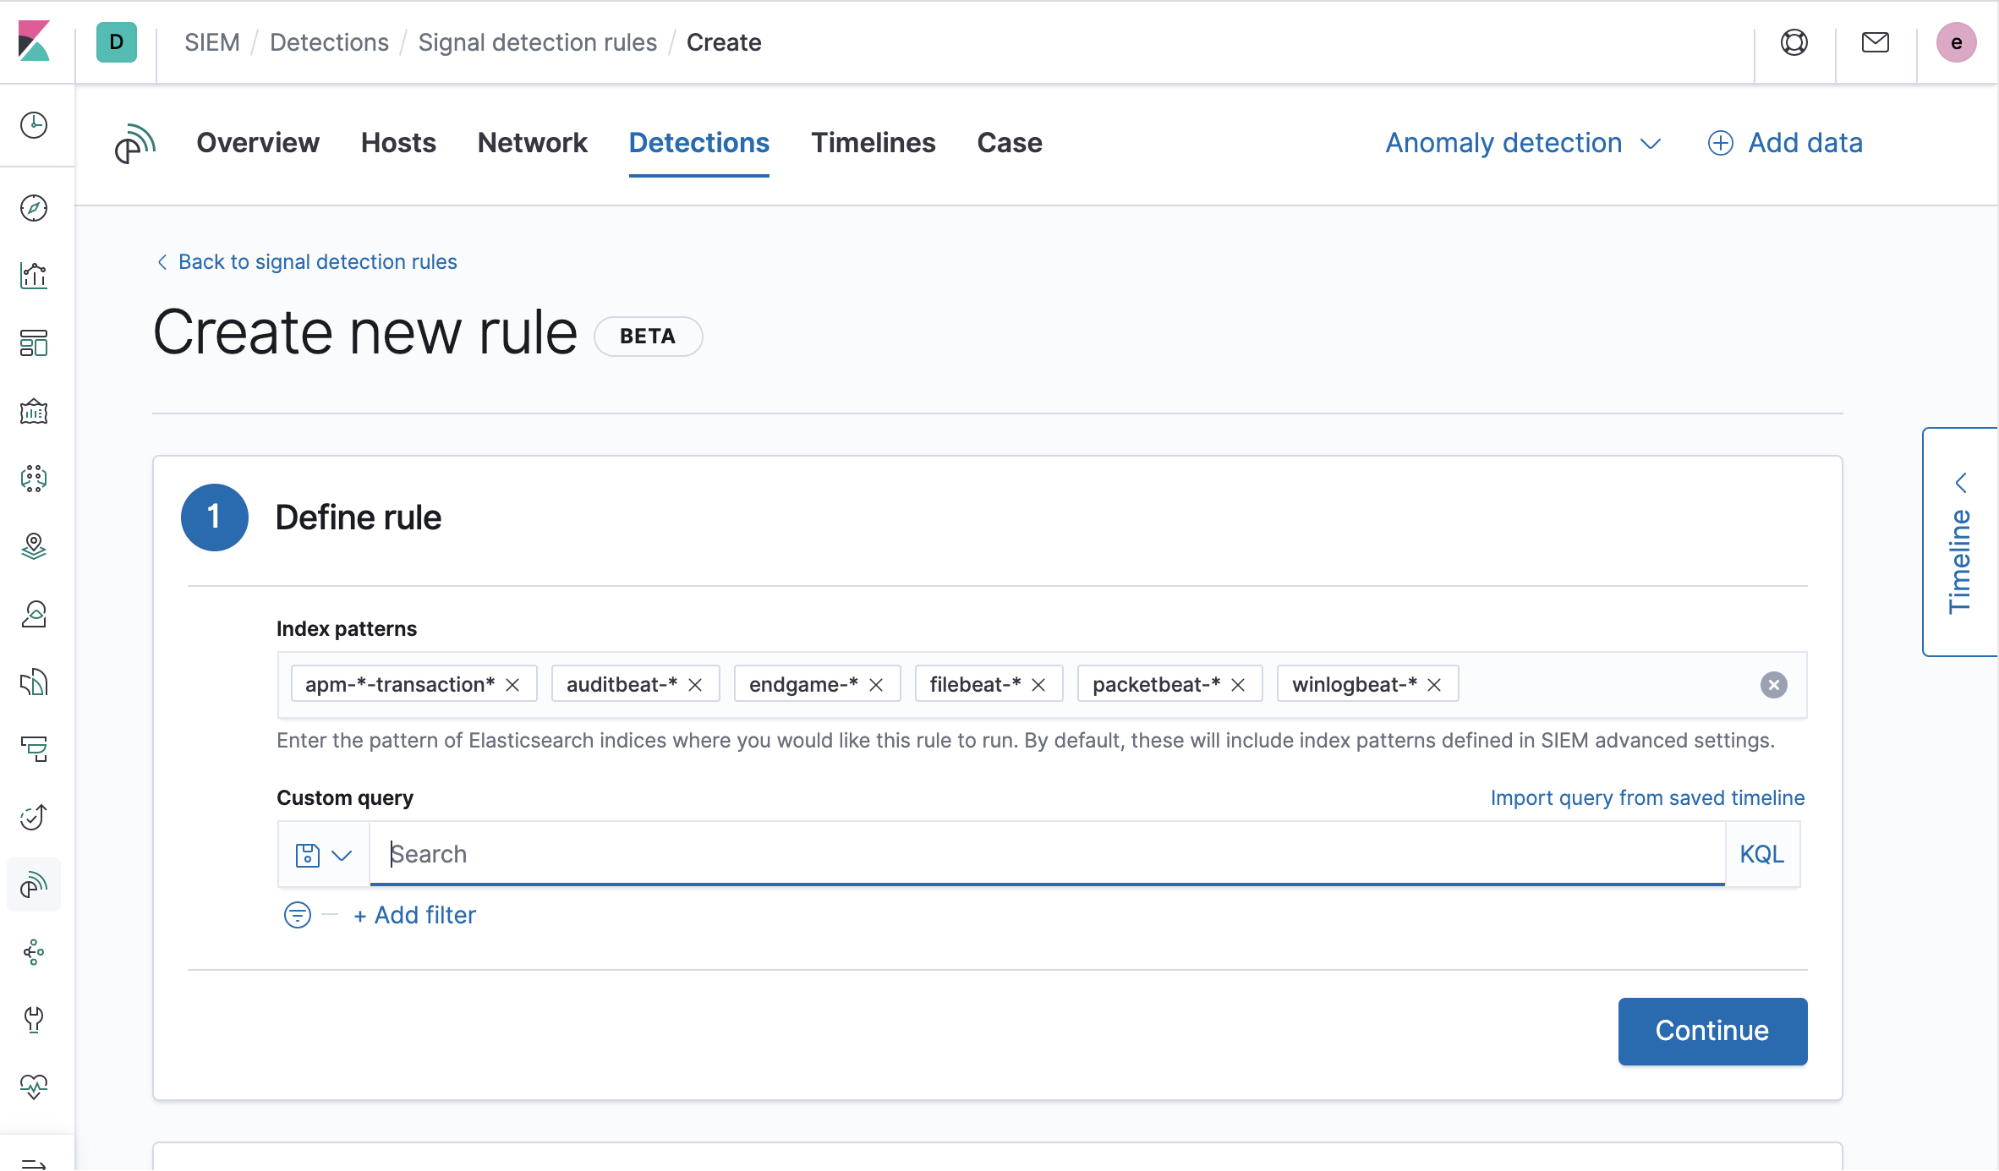
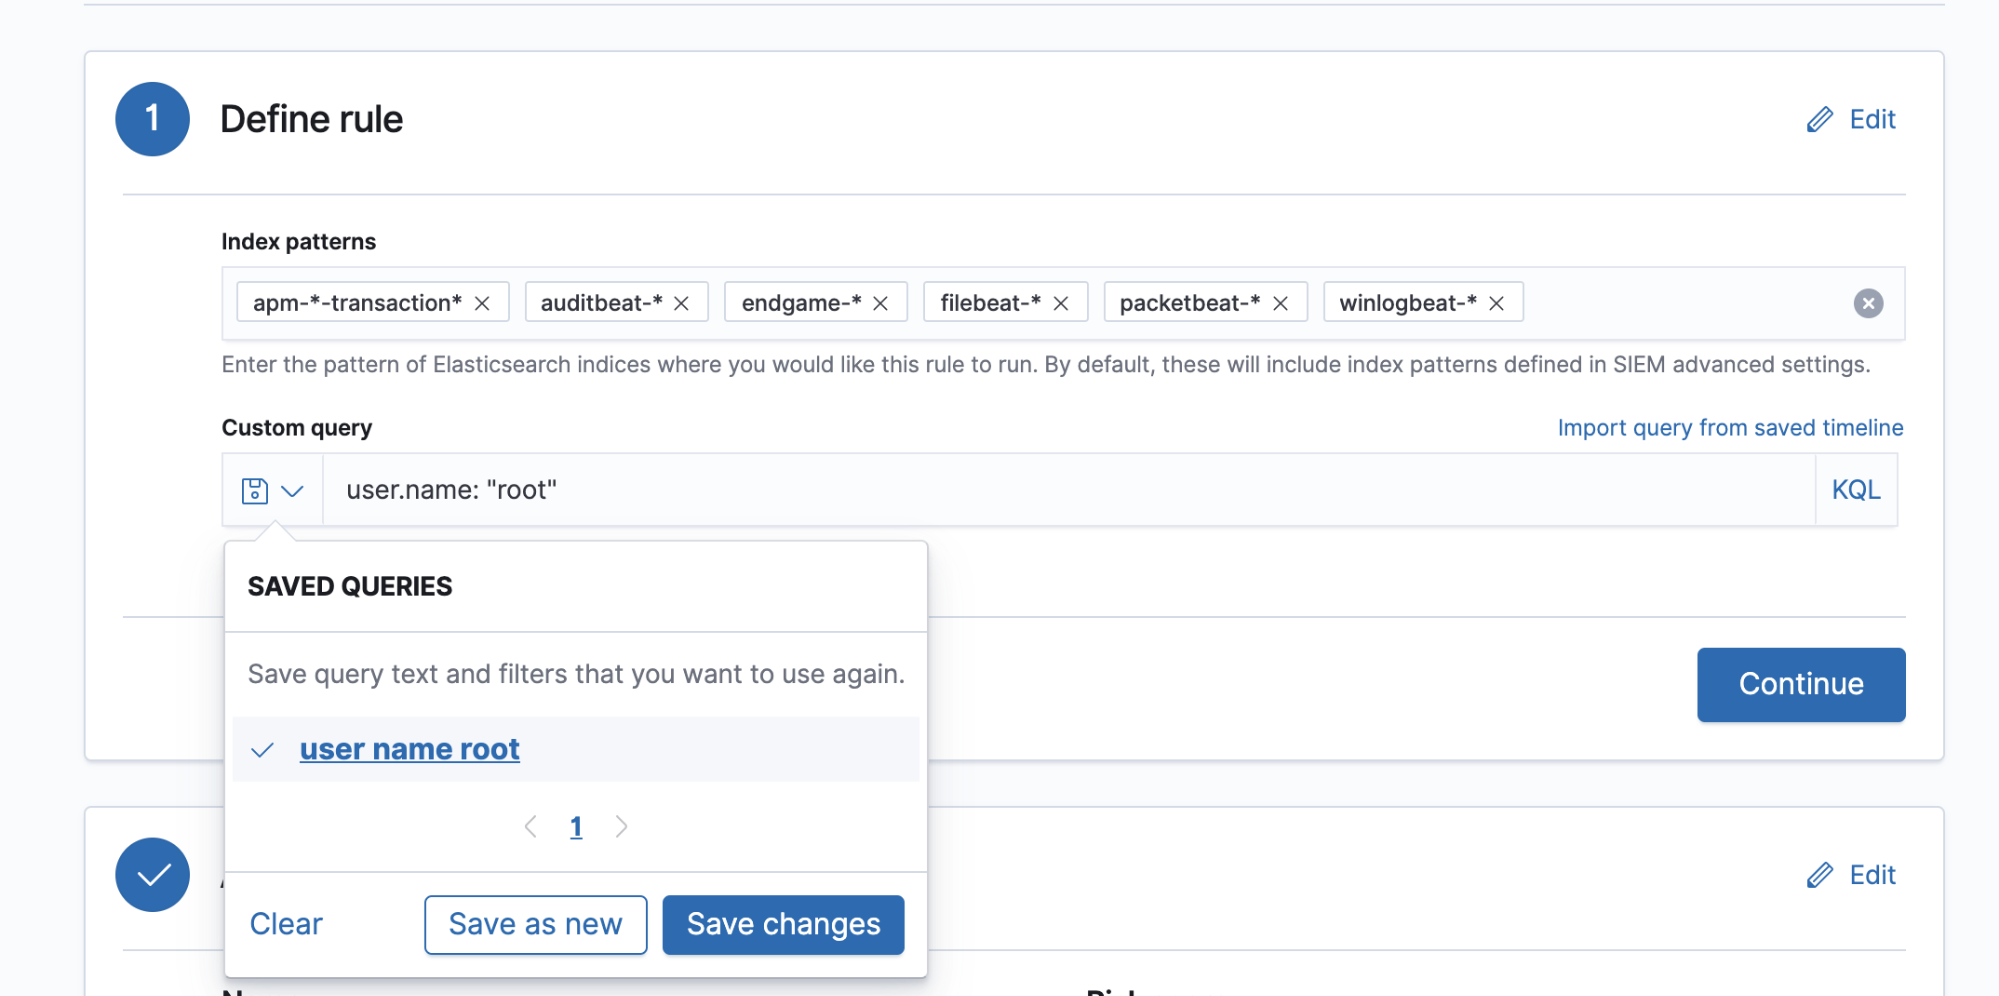
1) Generate the query to be used each time the rule runs. This query can be Lucene syntax, KQL, a saved search, or the query can be imported from a saved timeline (with many more options for rule queries currently under development for future release):
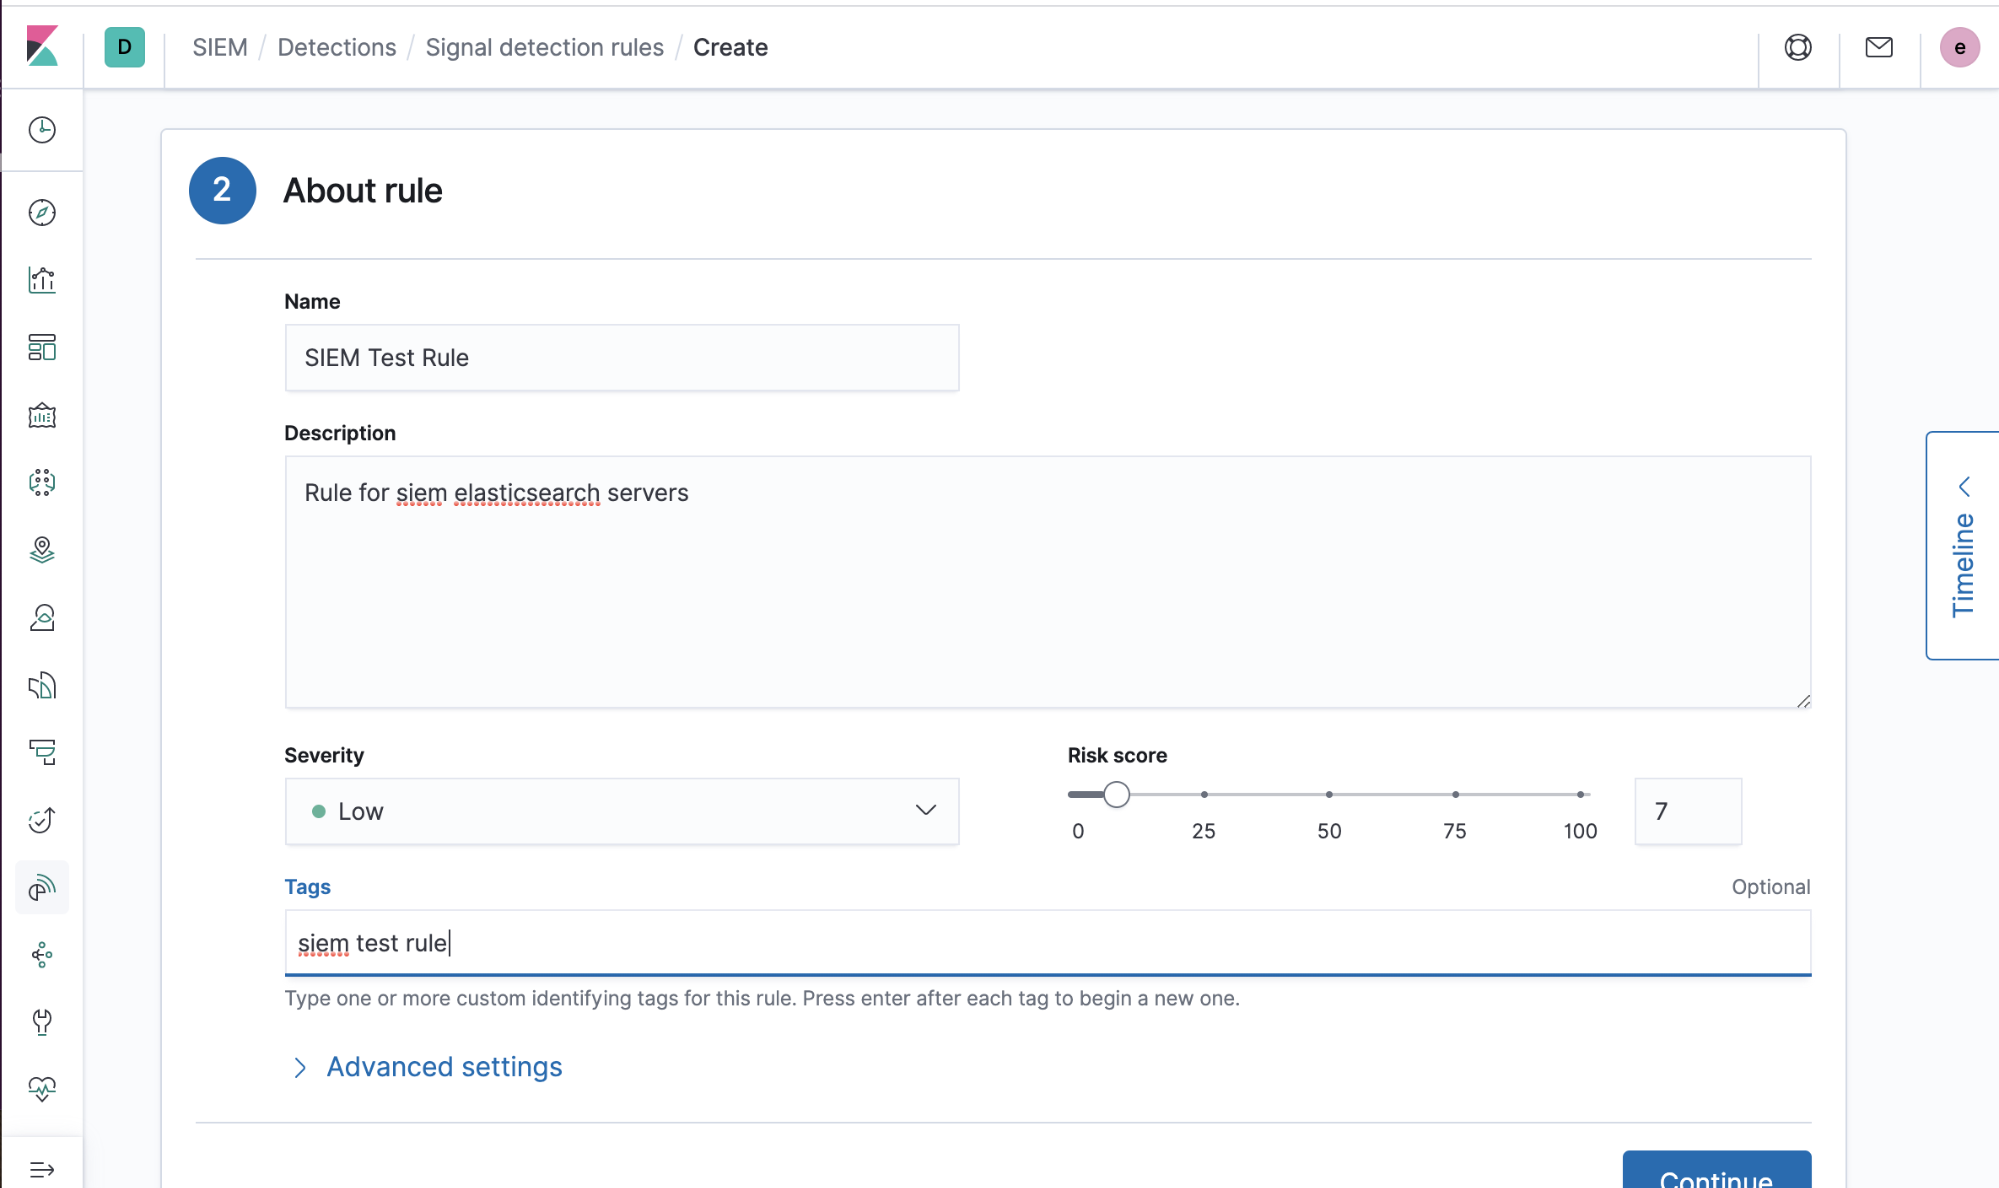
2) Add some information describing the rule (title, description, etc.):
3) Schedule the interval the rule should run at and any additional look-back time for sanity checks. We generally recommend some amount of look-back time to allow for delays that may occur in a given user's ingestion pipeline. We also recommend some look-back time as the rules are not guaranteed to run exactly at their scheduled interval and therefore might be delayed between runs. An overloaded task manager worker queue or insufficient computing resources can cause these delays.
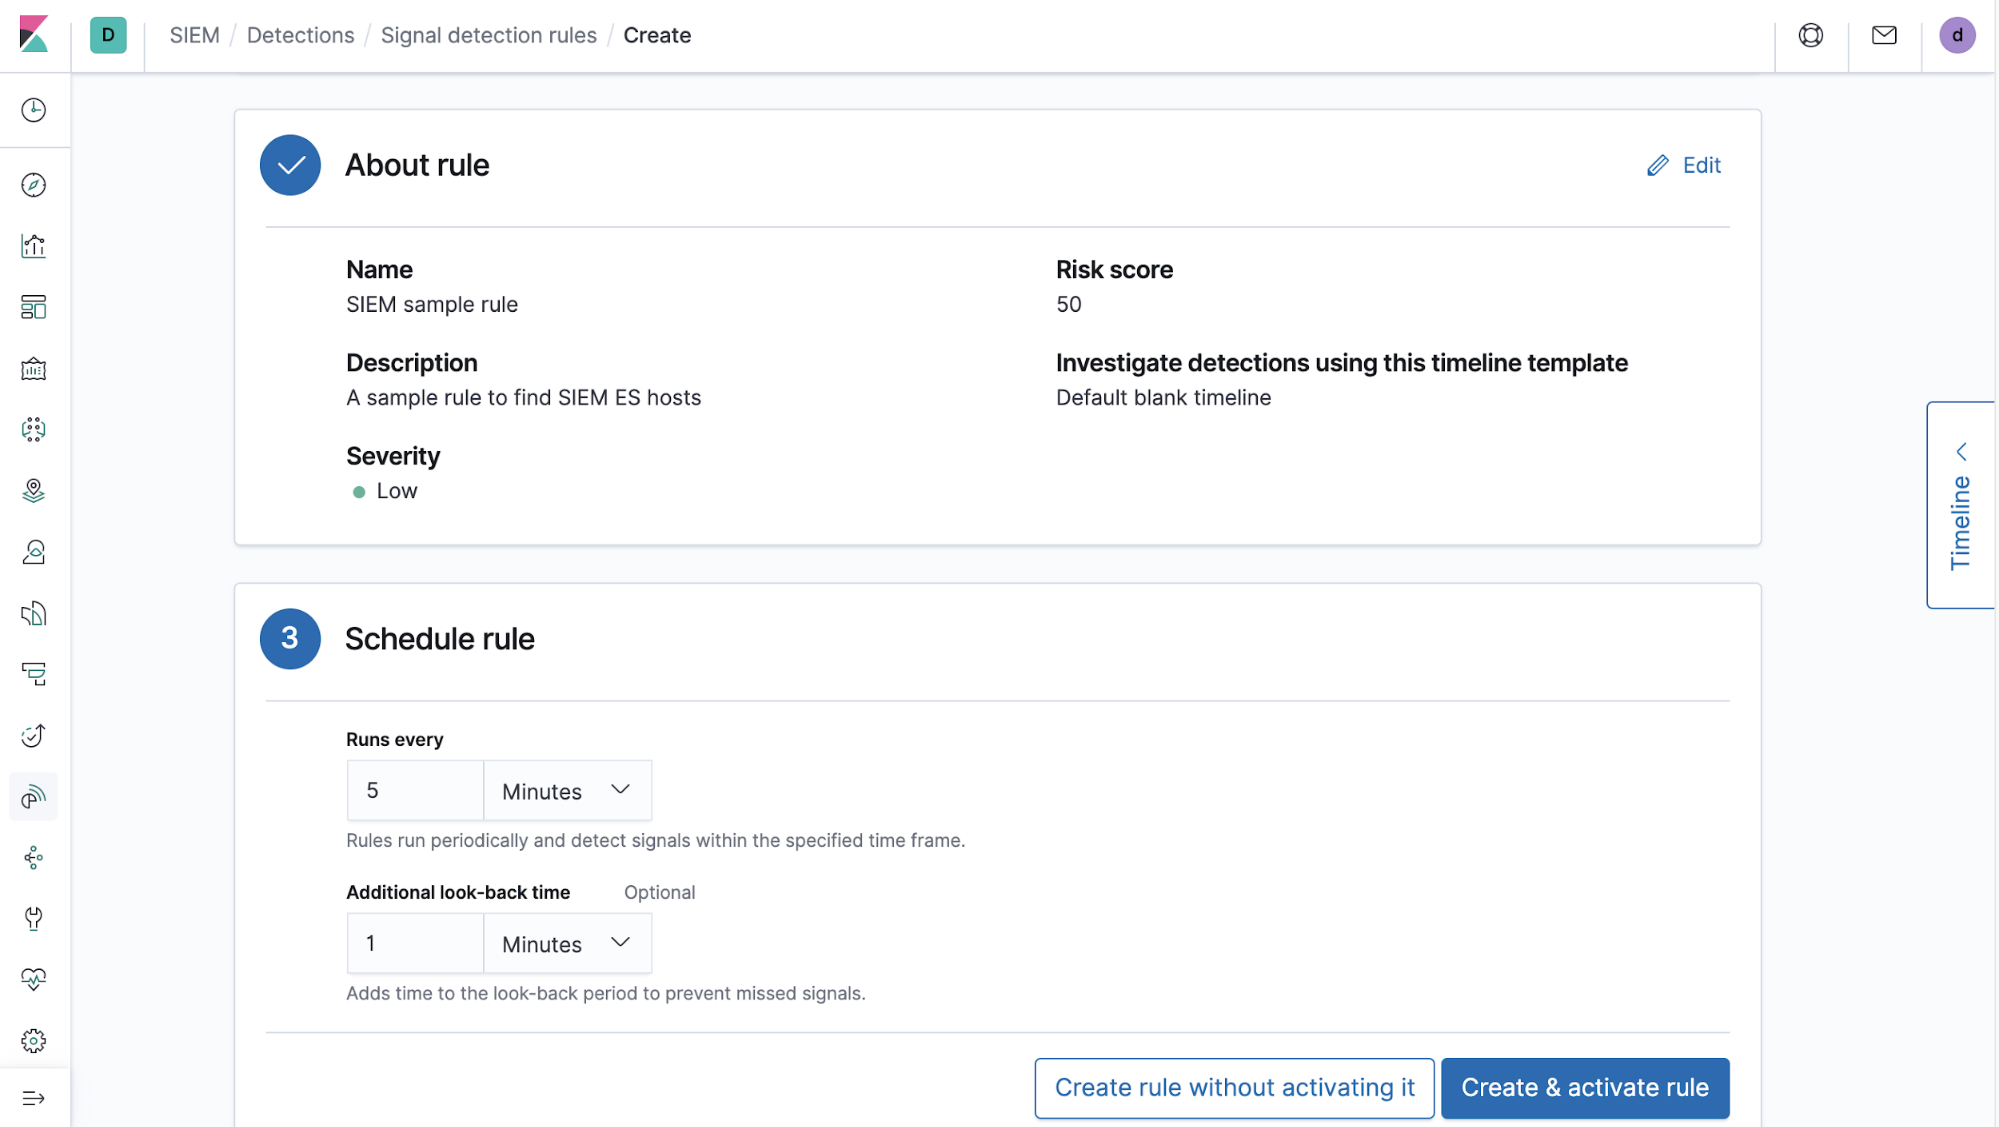
These three things are the basic components that make up a detections rule. We also provide settings to classify this rule according to MITRE ATT&CK tactics and techniques, as well as links to additional references.
![]()
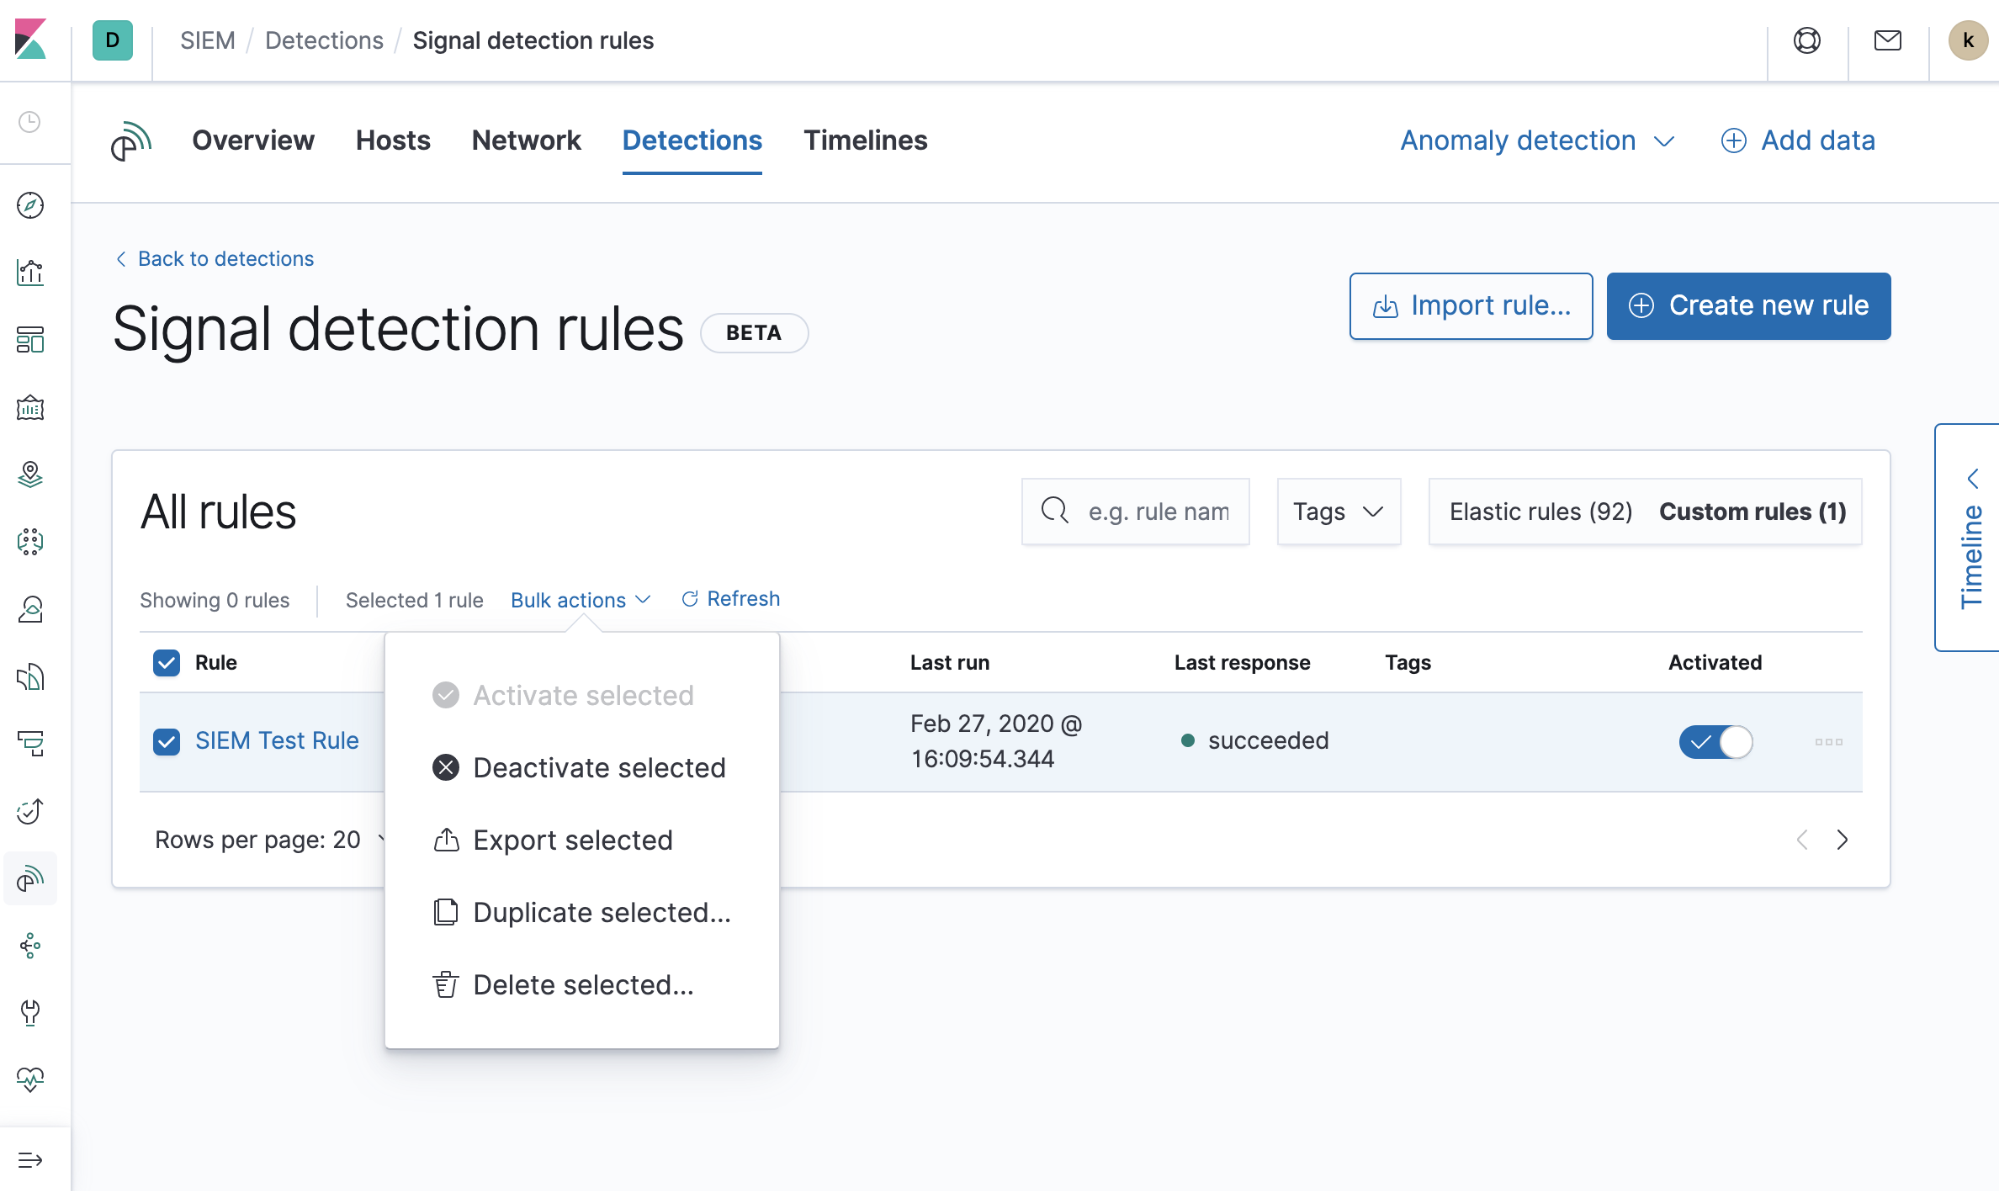
Users can also perform actions on existing rules individually or in bulk, such as duplicate (for customizations), deactivate, export, and delete rules. We also have a guide for more information on general rule management.
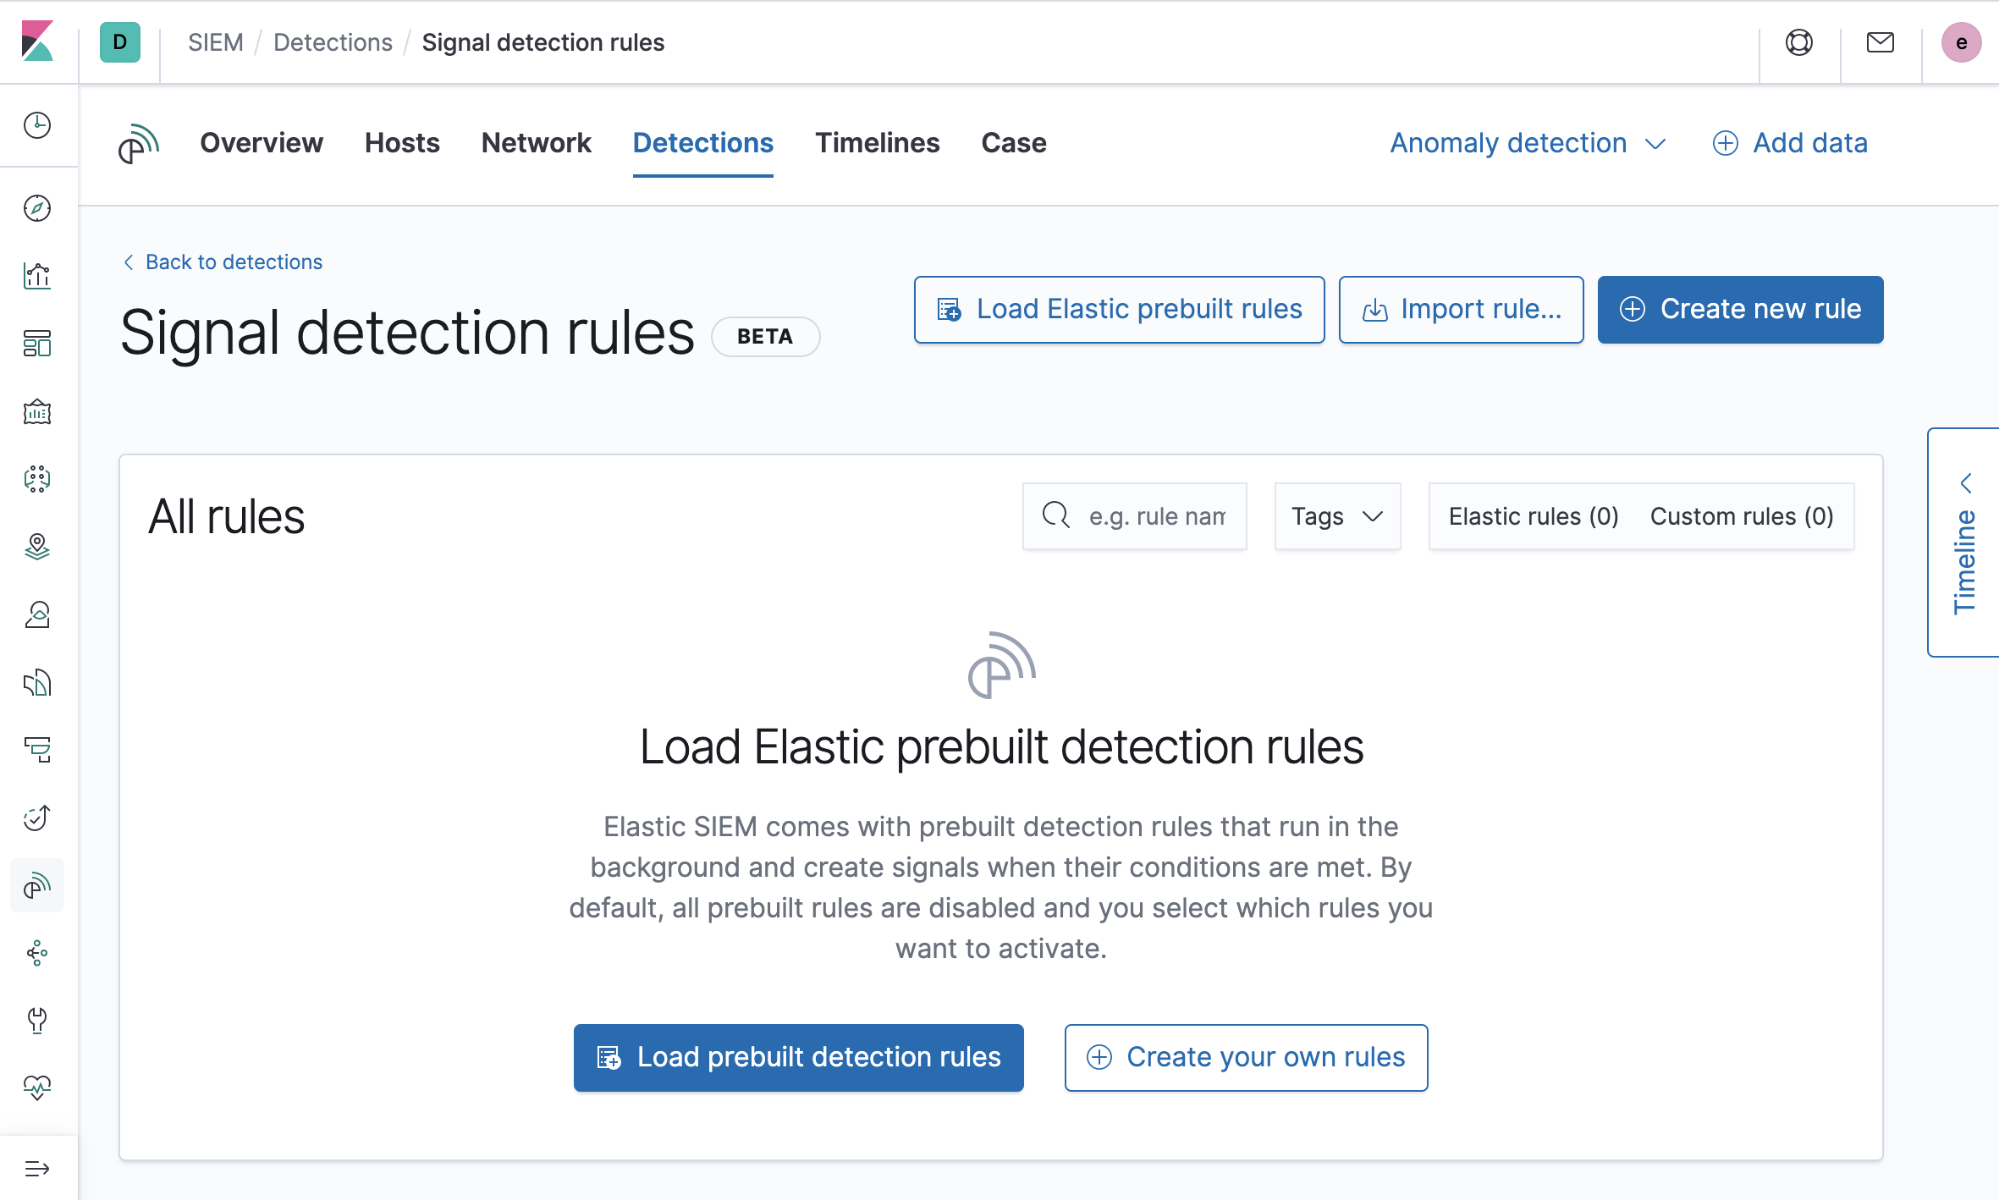
Prebuilt rules
Rules can be difficult to develop and are time intensive to test. Because of this, detections started with 92 prebuilt rules developed by the Intelligence & Analytics team at Elastic Security and have been used extensively at Elastic in a production environment. New rules that respond to the latest critical threats are continuously being developed. Getting them loaded and ready to run is as easy as a click of a button! You can read more about using and tuning the pre-built rules here.
Detections implementation details
Shortly after Alerting in the Elastic Stack made its way into Kibana to provide support for alerts as first-class entities, Elastic SIEM utilized alerting for the foundation of detections. Behind the UI, detections uses an API layered on top of the Alerting API. The SIEM detections API brings convenience, workflows (such as opening and closing signals), the domain specifics of security (such as MITRE ATT&CK identification), and KQL Support.
Rules run behind the scenes by creating an API Key and then utilizing that API Key to make requests on behalf of the user using search after to find matching events and bulk create to copy the information from the event into a signal document in the signal index. A signal is made up of the rule details and the details of the original event document matched by the rule.
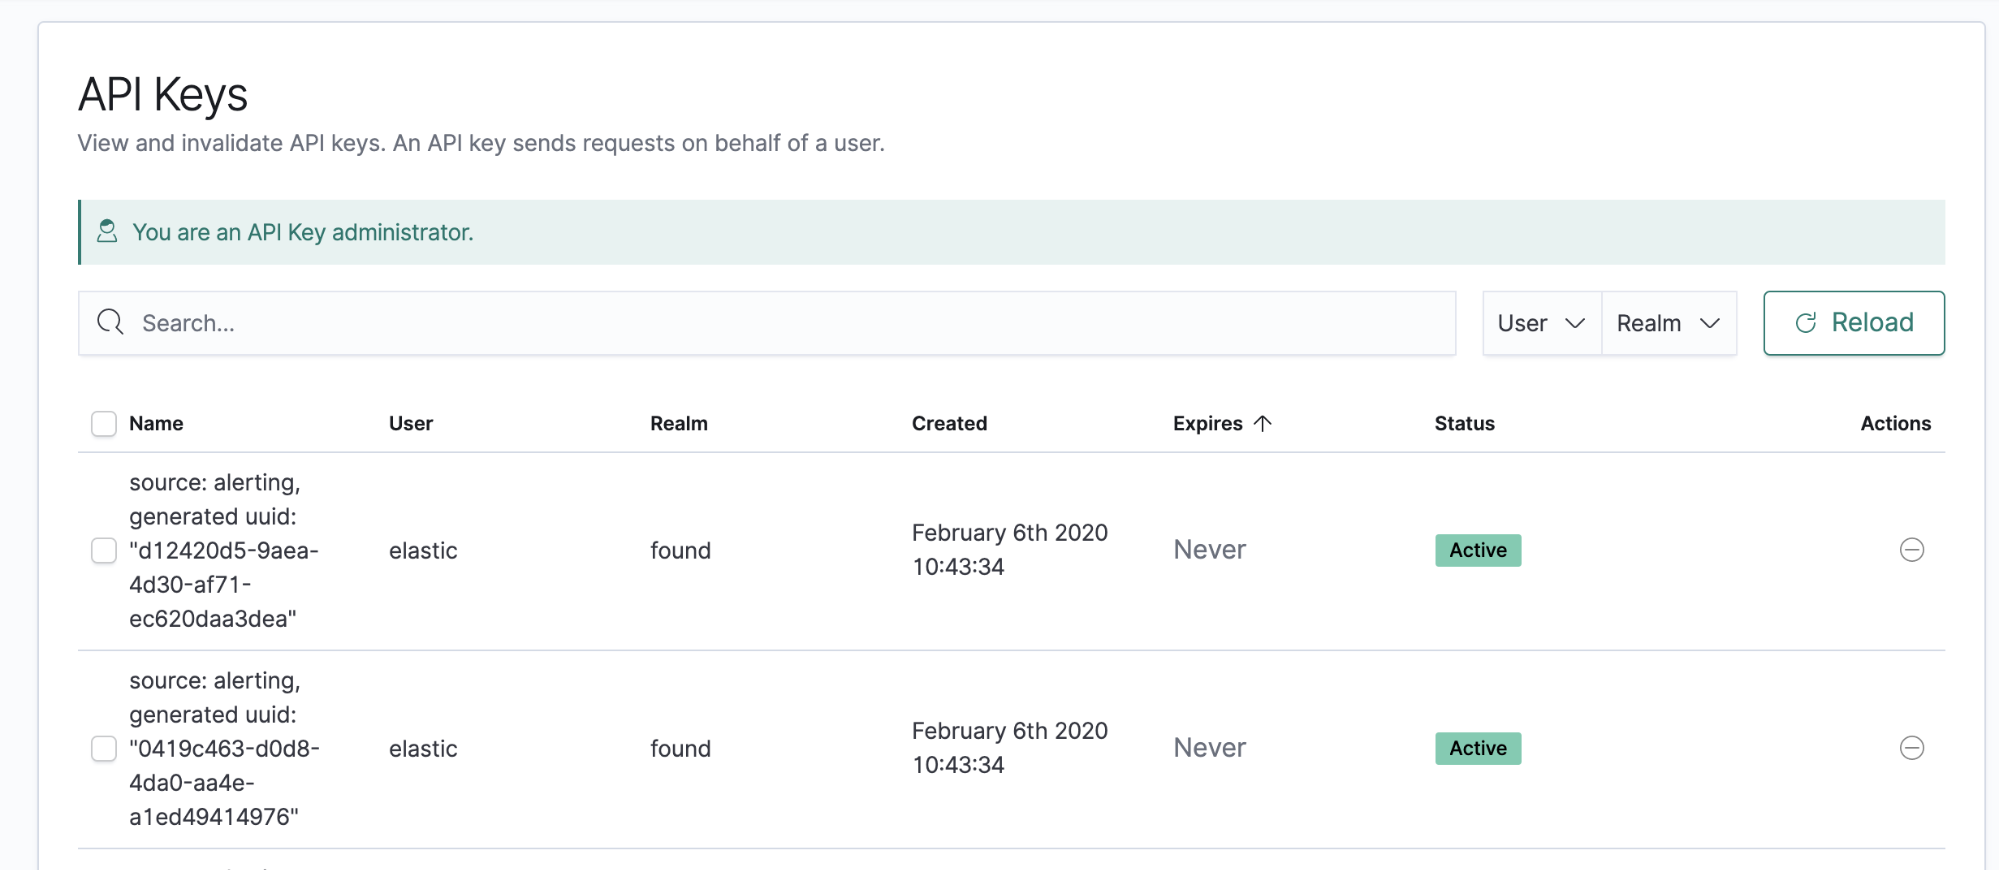
If more than 100 matching documents are found in a single rule execution, only the last 100 matches — by descending `@timestamp` sort order — are copied to the signals index. The signals index is automatically created per Kibana space the first time you visit the signal detection rules page. The index name format is `.siem-signals-
The mapping of the SIEM signals index is a combination of Elastic Common Schema (ECS) and a custom mapping of our definition of what a signal is. When a matching document is detected from the rule query, it will copy the fields over from the source indices and the resulting signal fields will be searchable if the fields in the source document are compliant with ECS. If the fields from the source indices are not part of ECS, they will still be stored in the signal’s `_source` and viewable within Timeline and other parts of the application. However, they will not be searchable.
Scalability
The detections UI is built atop the newly developed Kibana Alerting framework and the Kibana task manager. These two provide horizontal and vertical scaling capabilities, allowing flexibility that best suits whatever hardware is available at the time. Kibana task manager workers can be increased in number to take advantage of vertical scaling, or can be replicated across separate Kibana instances and scaled horizontally.
When multiple Kibana instances are running, the task managers will coordinate across the wire to balance the tasks across the instances. By updating the number of max_workers inside of the kibana.yml file from it’s default of 10, you can vertically scale up or down to appropriately allocate resources more efficiently per Kibana node.
Signal deduplication
When a rule is running, it generates signals based on the events that it finds that match the rule’s query. Sometimes duplicate signals can be created either by overlapping queries in separate rules or by a rule running twice in a row and catching the same signal due to a long additional look-back time. To prevent a duplicate signal from appearing in the signals table, we identify signals based on the index the source event is from, the source event’s document id, the source event’s version number, and the running rule’s id. By hashing on these properties, we ensure only unique signals are added to the signals index.
Errors
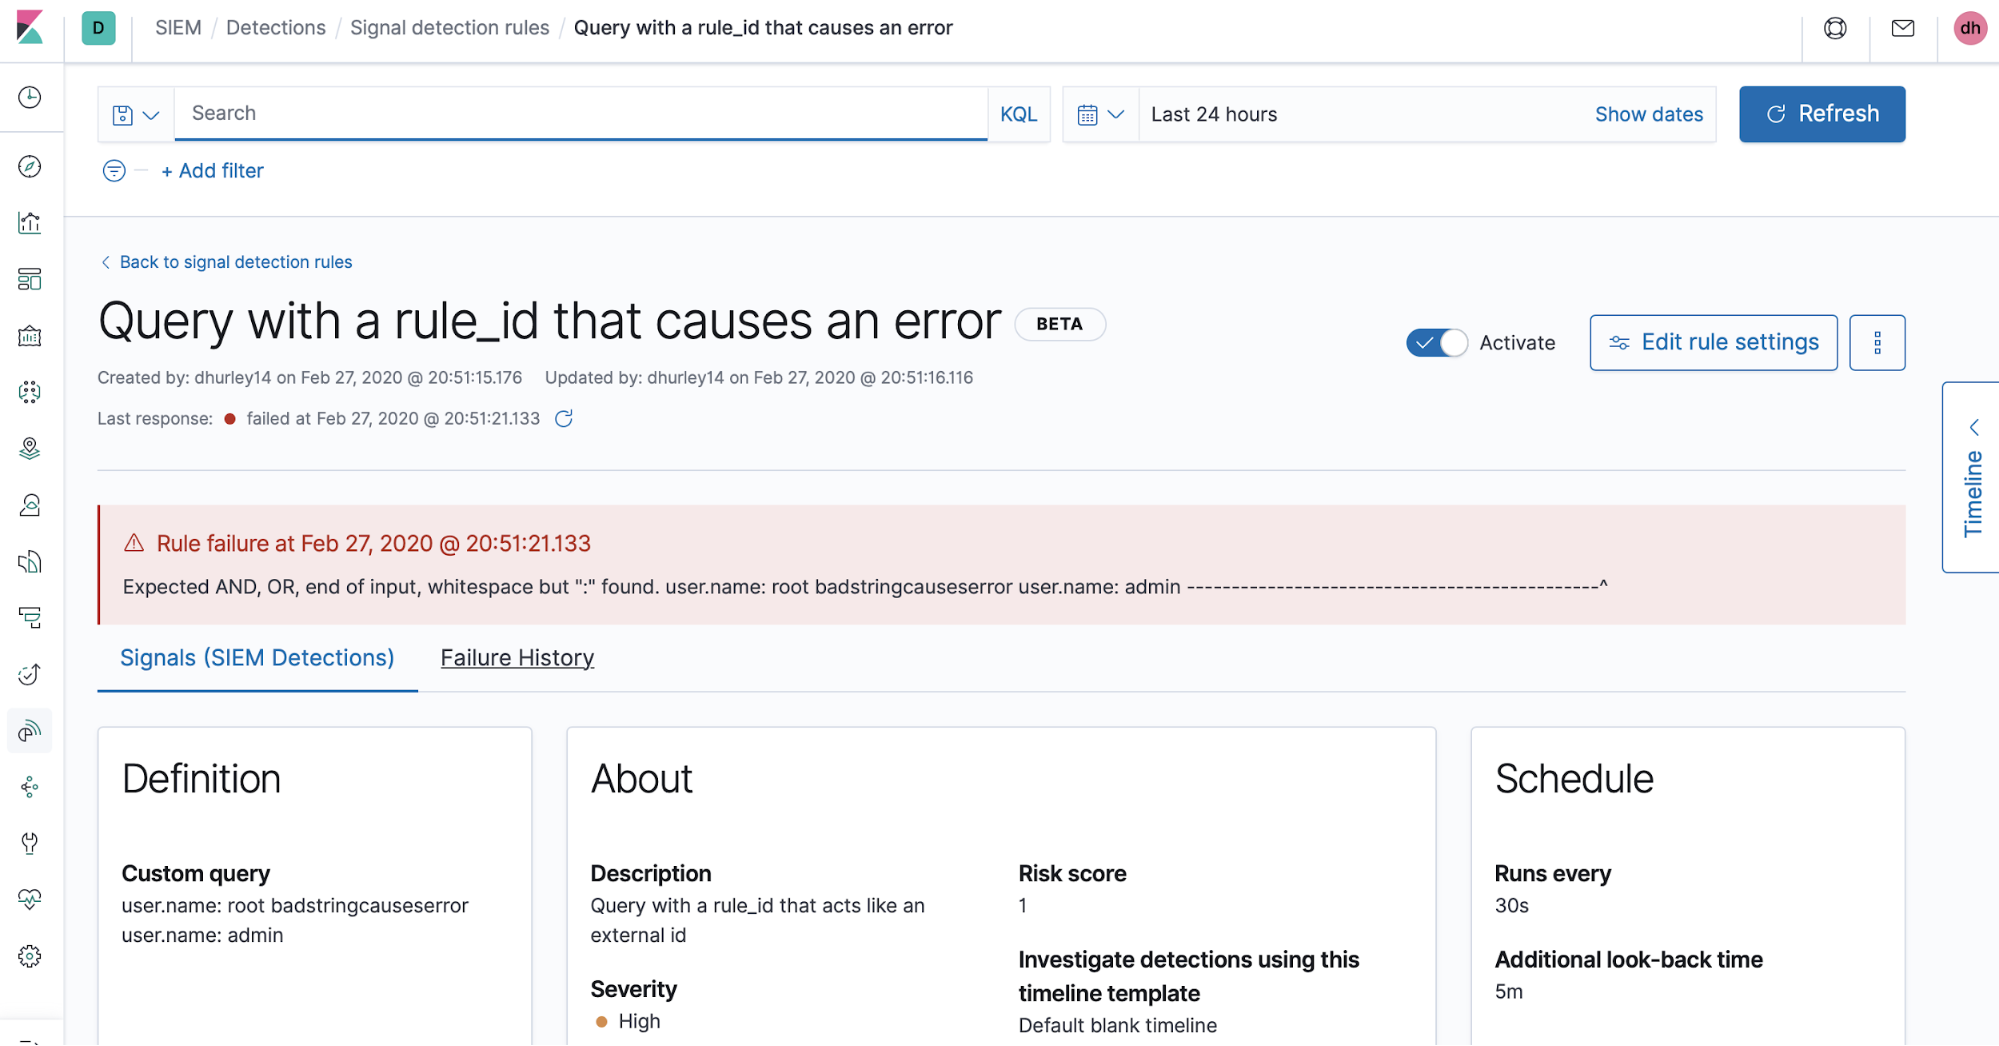
Sometimes errors will appear due to a syntax error in a rule’s query or some other issue during a rule’s execution period. We bubble these up in the errors tab on the rule details page. We plan to expand the visibility of rule execution information and general rule monitoring in the future.
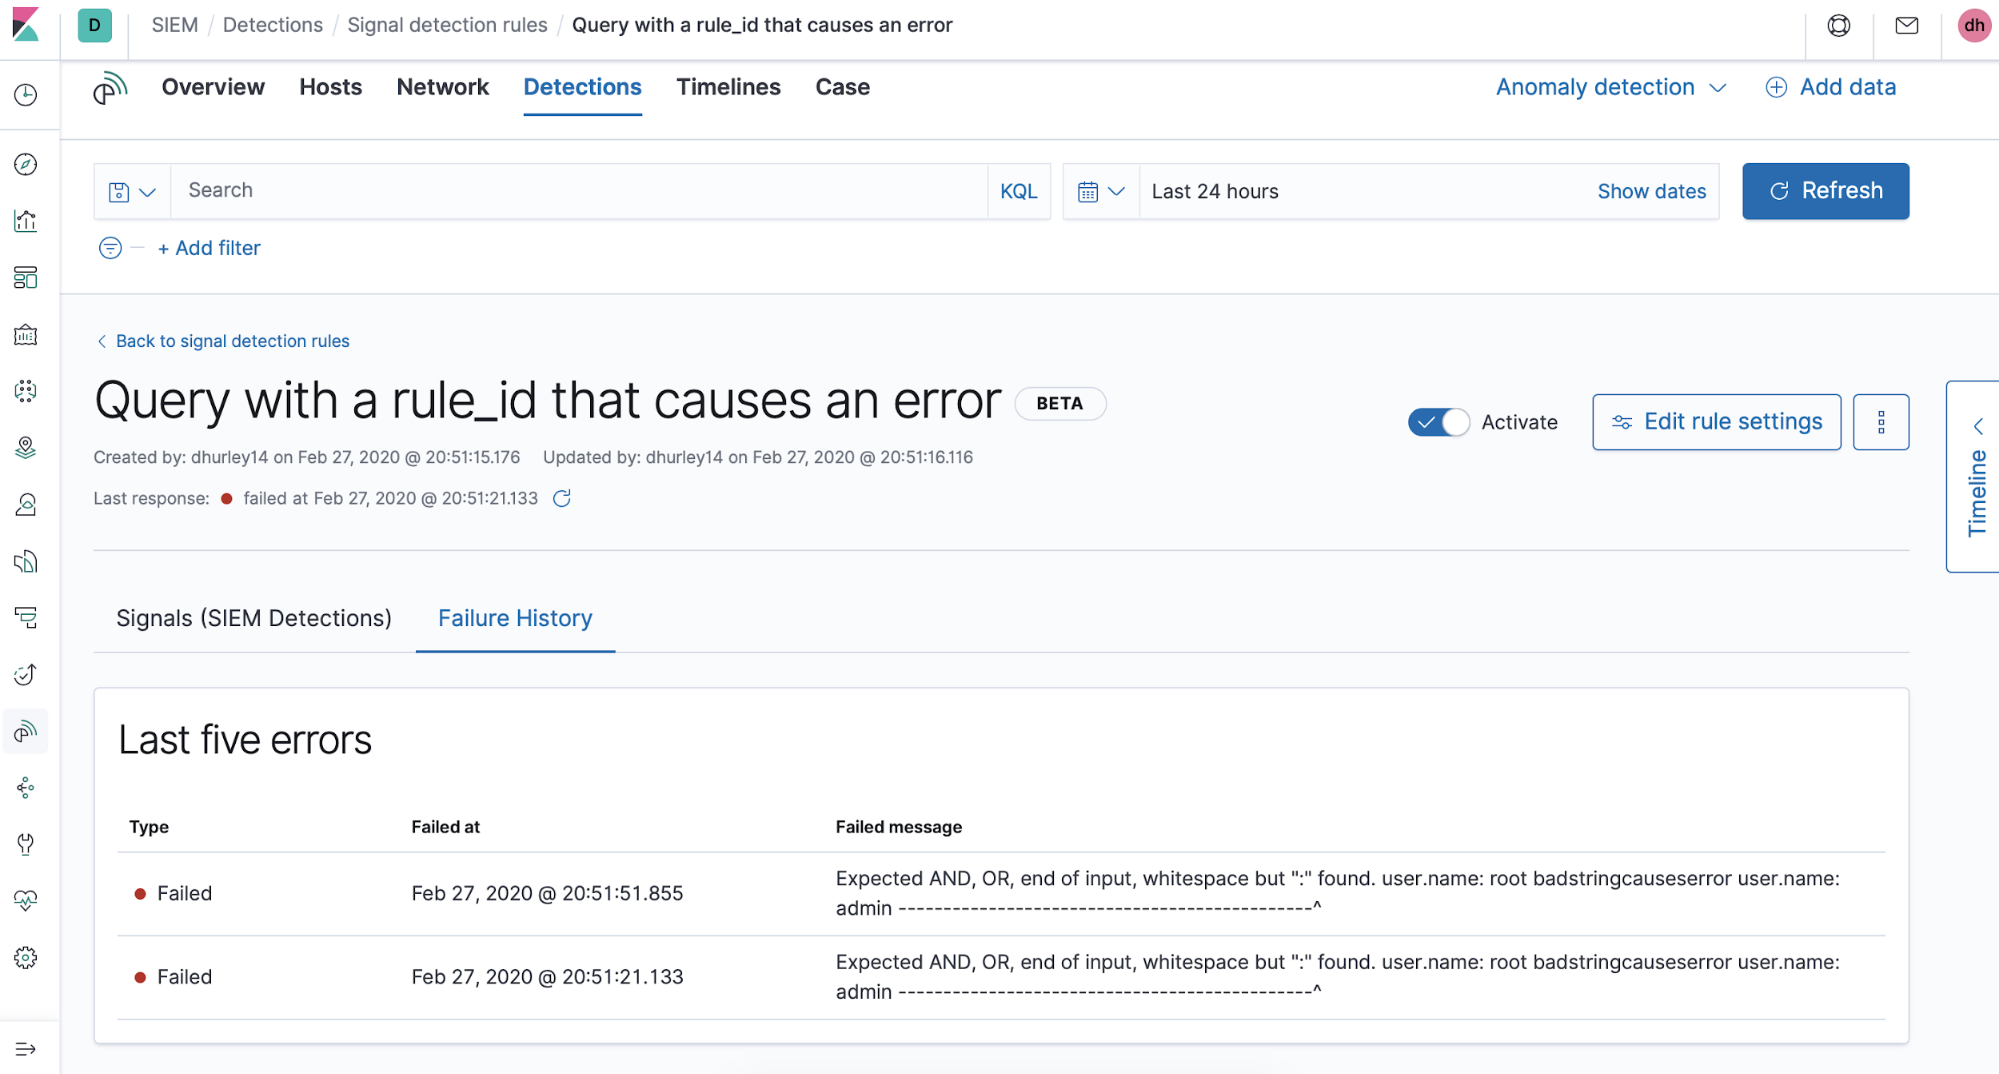
And here we can see the failure history, which displays the last five errors that occurred during rule execution:
SIEM detections of tomorrow
The most exciting part of working on and releasing this Elastic SIEM detections beta is the early and continuous community feedback on the Elastic SIEM discussion forum and our open feature tracking list.
We have big plans for making detections even more powerful. Expanding rule queries to include aggregations, machine learning jobs, and EQL are just a few of them. If you think of something that is a great security use case or want to ask a question or two about what is happening, please join us!