Monitoring overview
editMonitoring overview
editWhen you monitor a cluster, you collect data from the Elasticsearch nodes, Logstash nodes, Kibana instances, and Beats in your cluster.
All of the monitoring metrics are stored in Elasticsearch, which enables you to easily visualize the data from Kibana. By default, the monitoring metrics are stored in local indices.
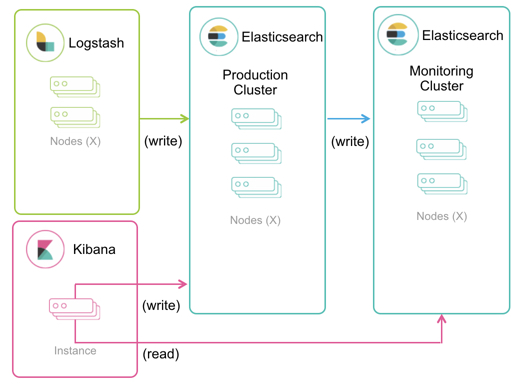
In production, we strongly recommend using a separate monitoring cluster. Using a separate monitoring cluster prevents production cluster outages from impacting your ability to access your monitoring data. It also prevents monitoring activities from impacting the performance of your production cluster. For the same reason, we also recommend using a separate Kibana instance for viewing the monitoring data.
The following diagram illustrates a typical monitoring architecture with separate production and monitoring clusters:
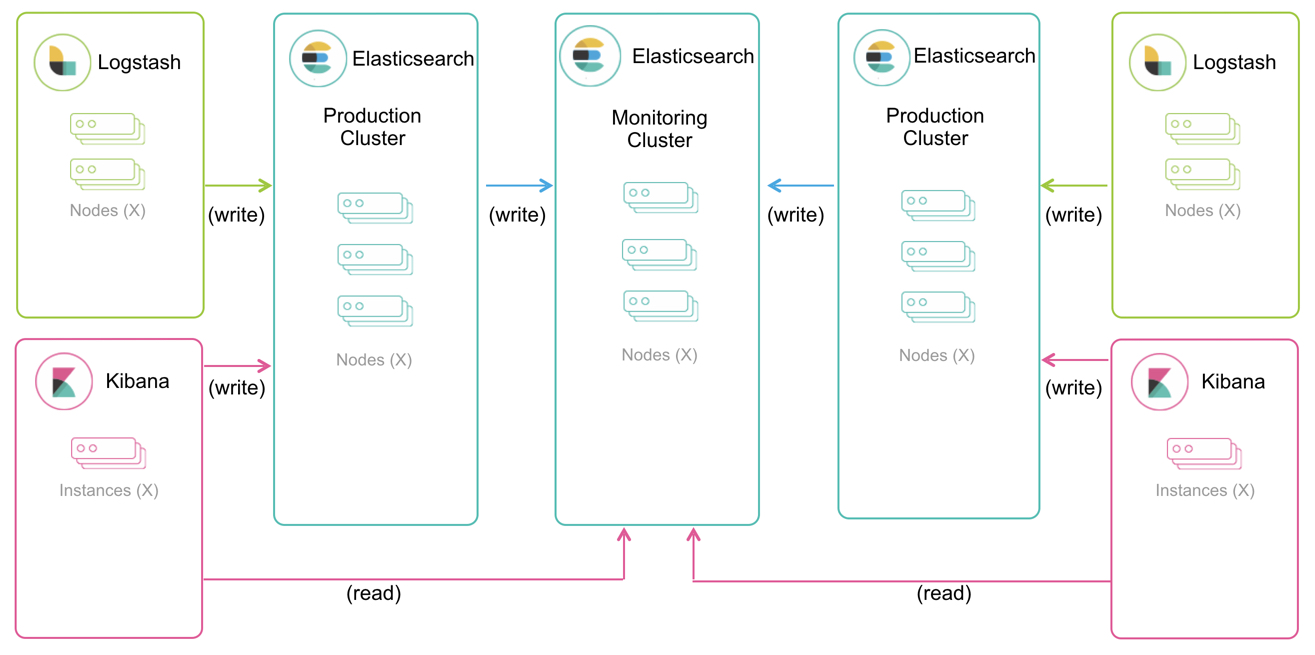
If you have the appropriate license, you can route data from multiple production clusters to a single monitoring cluster:
In general, the monitoring cluster and the clusters being monitored should be running the same version of the stack. A monitoring cluster cannot monitor production clusters running newer versions of the stack. If necessary, the monitoring cluster can monitor production clusters running the latest release of the previous major version.