Elasticsearch and Kibana 8.13: Simplified kNN and improved query parallelization

 Share on Twitter
Share on Twitter

 Share on LinkedIn
Share on LinkedIn

 Share on Facebook
Share on Facebook

 Share by Email
Share by Email

 Print this page
Print
In version 8.13, Elastic introduces significant enhancements to vector search and integrates Cohere embeddings into its unified inference API. These updates streamline the integration of large language models (LLMs) into user workflows and improve query efficiency, making it faster and easier to solve complex data problems with search by:
Developing a novel method for communicating the interim results between threads that run HNSW vector search on different segments, which improves query latency and sometimes reduces average query time to half or even a third of what it was previous to the change
Enabling simpler and more efficient vector searches, allowing you to leverage defaults for improved query performance without needing in-depth knowledge of the underlying mechanics
Expanding the unified inference API to include Cohere embeddings with existing support for OpenAI and HuggingFace, which facilitates easier access to a broader range of language processing tools
Introducing new options for indexing dense vector fields to use brute force vector search — under the right conditions, brute force vector search significantly reduces index size and improves query latency, especially now that we introduced the use of scalar quantization with brute force vector search
Simplifying access to advanced search functionalities and broadening the scope of supported language models, empowering you to achieve more nuanced, accurate, and efficient search and data analysis outcomes
8.13 is available now on Elastic Cloud — the only hosted Elasticsearch offering to include all of the new features in this latest release. You can also download the Elastic Stack and our cloud orchestration products — Elastic Cloud Enterprise and Elastic Cloud for Kubernetes — for a self-managed experience.
Vector search improvements
Improved query parallelization by communicating between threads on different segments
In 8.10 we enabled performing a vector search query with up to a thread per segment per query; that is, we parallelized running queries within the shard. That got us thinking about ways to improve query latency by sharing information between the threads that run the same query. Sharing information between threads allows Elasticsearch to abort the search earlier in segments that do not have good candidates. We contributed this unique method to Lucene, and you can review the code and the improved query latency here. See the Speeding up multi-graph vector search blog for additional details regarding this new method.
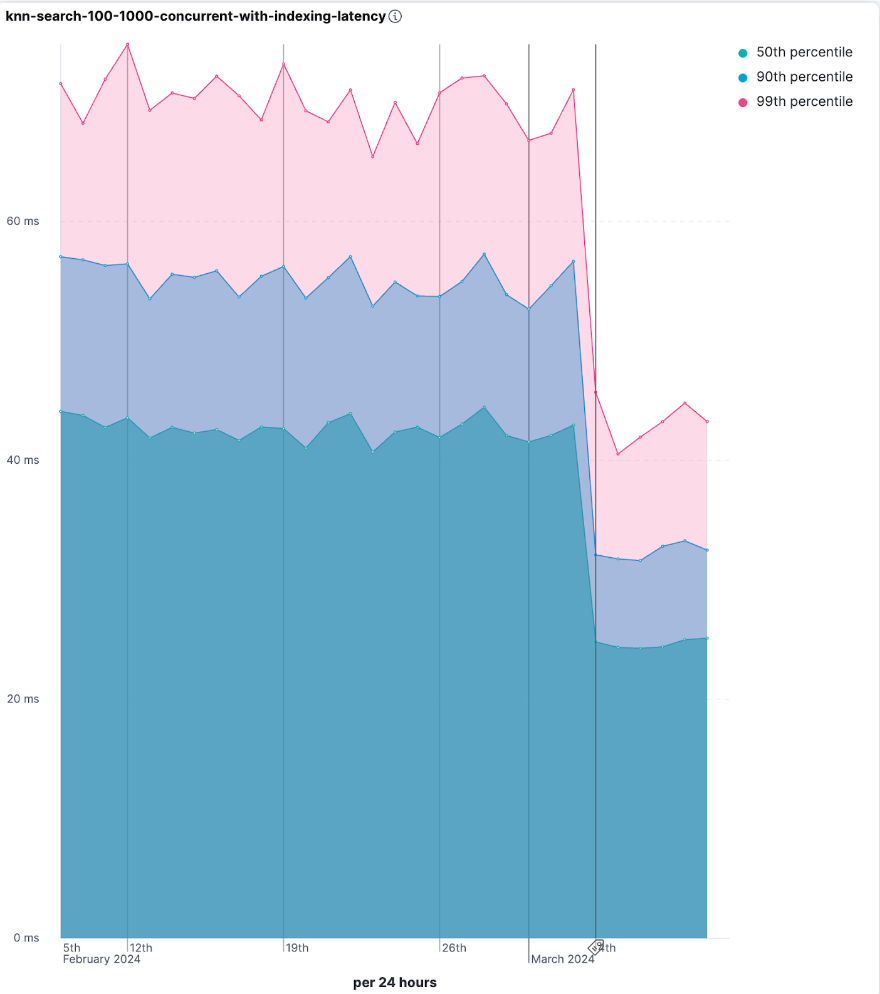
The bottom line is that queries take significantly less time to run. There is a lot of variation between data sets in the extent of the improvement, but large data sets with multiple segments and high dimensionality will likely experience 2x to 3x improvements (in some scenarios potentially even more). We have also seen between a 1.7x to 2.5x improvement in Lucene when experimenting with a Cohere data set (1m vectors of 768 float dimensions). The impact can also be seen in our nightly benchmark (although it is a small set and the impact is more dramatic in larger sets). For example, the knn-search-100-1000-concurrent-with-indexing-latency rally track is almost twice faster following the change that was merged on March 4, 2024.
Simplifying kNN vector search
Vector search is becoming increasingly more popular. It sorts the results by the similarity of the query vector to the vectors of the documents and returns the small subset of documents with vectors that are most similar to the query vector. That means more users use this technique without having dedicated machine learning or relevance ranking teams. To facilitate the use of vector search by those who are new to the field, we are making the use of vector search simpler. You will still be able to use all the advanced features, but you will also be able to rely on our defaults and start more simply without needing to be aware of all the nuances. The result of relying on the defaults is surprisingly good.
From an engineering perspective, vector search latency (the time it takes to run a query) is dominated by the number of vector comparison operations that are required. The beauty of the HNSW kNN vector search is that the number of vectors that are being evaluated is roughly logarithmic to the number of vectors in the corpus, but since Elasticsearch is distributed and search is parallelized, the corpus in this context is the segment within the shard. Still, even with HNSW, the number of vectors that are being considered as candidates for the top-k that is returned is an important way to balance recall and latency. Up until now, the user had to provide two numbers: the number of documents that will be returned by the shard (named num_candidates) and the number of documents that will be returned by the query (named ‘k’). We have decided to allow relying on defaults for both.
For us, relying on defaults meant that we needed to test a lot to find the right default, and as usual, we did it openly. After much discussion and testing, we ended up deciding that num_candidates will be a minimum of 10,000 and 1.5 times k. k by default equals to size, which is by default 10, so num_candidates will be 15 (per shard) by default.
int8_flat and flat vector field index types
When the size of the set after filtering is rather small, it is usually better to rely on brute force vector search rather than on HNSW-based vector search. The potential benefits are better performance (ingest and query latency), fully accurate recall (no ANN), lower memory consumption, and a more forgiving query latency gradient for cache misses. The actual boundary has to be tested per case, but if the number of vectors after the filter is under 10,000, then brute force should be the first go-to. These are surprisingly frequent conditions because it relates to the number of documents that passed the filter. Now that Elasticsearch offers scalar quantization, which reduces the size of the index to approximately a third of its original size (see Save space with byte-sized vectors, Scalar quantization 101, and Introducing scalar quantization in Lucene for more details) the threshold for using brute force vector search is even higher.
In 8.13, we are adding two new options for indexing vector fields: flat and int8_flat vector indices. While flat is a syntactic sugar for an index that performs brute force vector search, int8_flat will automatically quantize the vectors to int8, resulting in reduced index size and improved query latency.
Multiple results from the same doc with nested vectors
In 8.11, we added support for nested vectors for ranking documents that have multiple vectors per field per document. This feature was hugely popular to support cases like:
Splitting long texts into chunks — Most models limit the number of tokens (e.g., BERT limits to 512 tokens per vector), so having a document with more than a paragraph of text usually means creating multiple vectors to represent that text.
Multiple images per document — The CNN models usually transform each image into a single vector, and in scenarios such as ecommerce, each document usually comes with several images.
Most real-life scenarios use a combination of token frequency-based search and filtering by keywords along with vector search. The alternative (which most engines turn to) is to denormalize and split the document into a separate document per vector, which complicates the ingest and also makes for a significantly larger and less cost-effective index. As with any popular feature, we started getting a lot of questions about it, like if it is supported with ELSER (which it is) and if there is an option to return multiple results from the same document — which it wasn’t, but now we are adding this option in 8.13. That means, for example, you now have the option to have different images or paragraphs from the same document that get separate vectors to appear separately in the result set.
Unified inference API now integrates Cohere embeddings
Elastic's commitment to enhancing the versatility and ease of use of its unified inference API takes another leap forward in version 8.13 by expanding its capabilities to include support for Cohere embeddings. This addition builds upon the foundation laid in version 8.12, which introduced compatibility with both OpenAI and HuggingFace embeddings, marking a continuous effort to integrate seamlessly with the evolving landscape of LLMs.
This enhancement, along with the inclusion of E5 multilingual embeddings, showcases Elastic's commitment to simplifying and diversifying the integration of LLMs into your workflows. The API's straightforward syntax, first introduced in version 8.11, enables seamless and effortless access to a broader range of language processing tools, significantly enhancing data analysis and processing capabilities. This expansion not only fosters innovation but also ensures that Elastic's offerings are more inclusive and adaptable to your needs, providing immense value for folks looking to leverage advanced language models within their Elastic deployments efficiently.
Performing inference on the newly supported models and services is as easy as a call with the simple syntax introduced in 8.11:
PUT /_inference/<task_type>/<model_id>
To start using Cohere embeddings with your Elastic deployment using the new inference API, please see this tutorial. This functionality is in technical preview in 8.13.
New and improved health indicators
We continue to expand the coverage of the health API — a feature we’ve been finding quite helpful for our own monitoring of Elasticsearch services.
Detect data streams that are stuck in their data stream lifecycle with the DSL health indicator
As we move closer to general availability of the data stream lifecycle (DSL) settings (still in technical preview in 8.13), we want to cover it in the health report, which already covers ILM. Elasticsearch 8.13 includes a new DSL health indicator that will detect data stream backing indices that cannot make progress (stagnating) due to repeatedly error-ing in their lifecycle execution. As with all health indicators, we’ll include impact, severity, affected resources, and diagnosis to streamline the troubleshooting process in case of an issue.
Detect mis-configured or invalid repositories with the enhanced repository_integrity indicator
Sometimes nodes cannot create a working snapshot repository instance as specified by the current cluster metadata. This might be due to a missing plugin (yielding an UnknownTypeRepository instance) or some other bad config (yielding an InvalidRepository instance). This causes log messages and failures when actually trying to use the repository but may otherwise go unnoticed. The repository_integrity health indicator already covered corrupted repositories; now, the health indicator will surface these misconfigurations directly to the user, as we extended it to report on unknown and invalid repositories.
Enhancements in ES|QL
ES|QL in the Java Client
The Elasticsearch Query Language (ES|QL) provides a powerful way to filter, transform, and analyze data stored in Elasticsearch and in the future in other runtimes. It is designed to be easy to learn and use by end users, SRE teams, application developers, and administrators.
With the release of 8.13, developers can now run ES|QL queries right from their IDEs when using the Elasticsearch Java client. Developers can project data returned by ES|QL as Domain Objects or iterate using a database cursor (like Resultset). This feature is available in beta in 8.13.
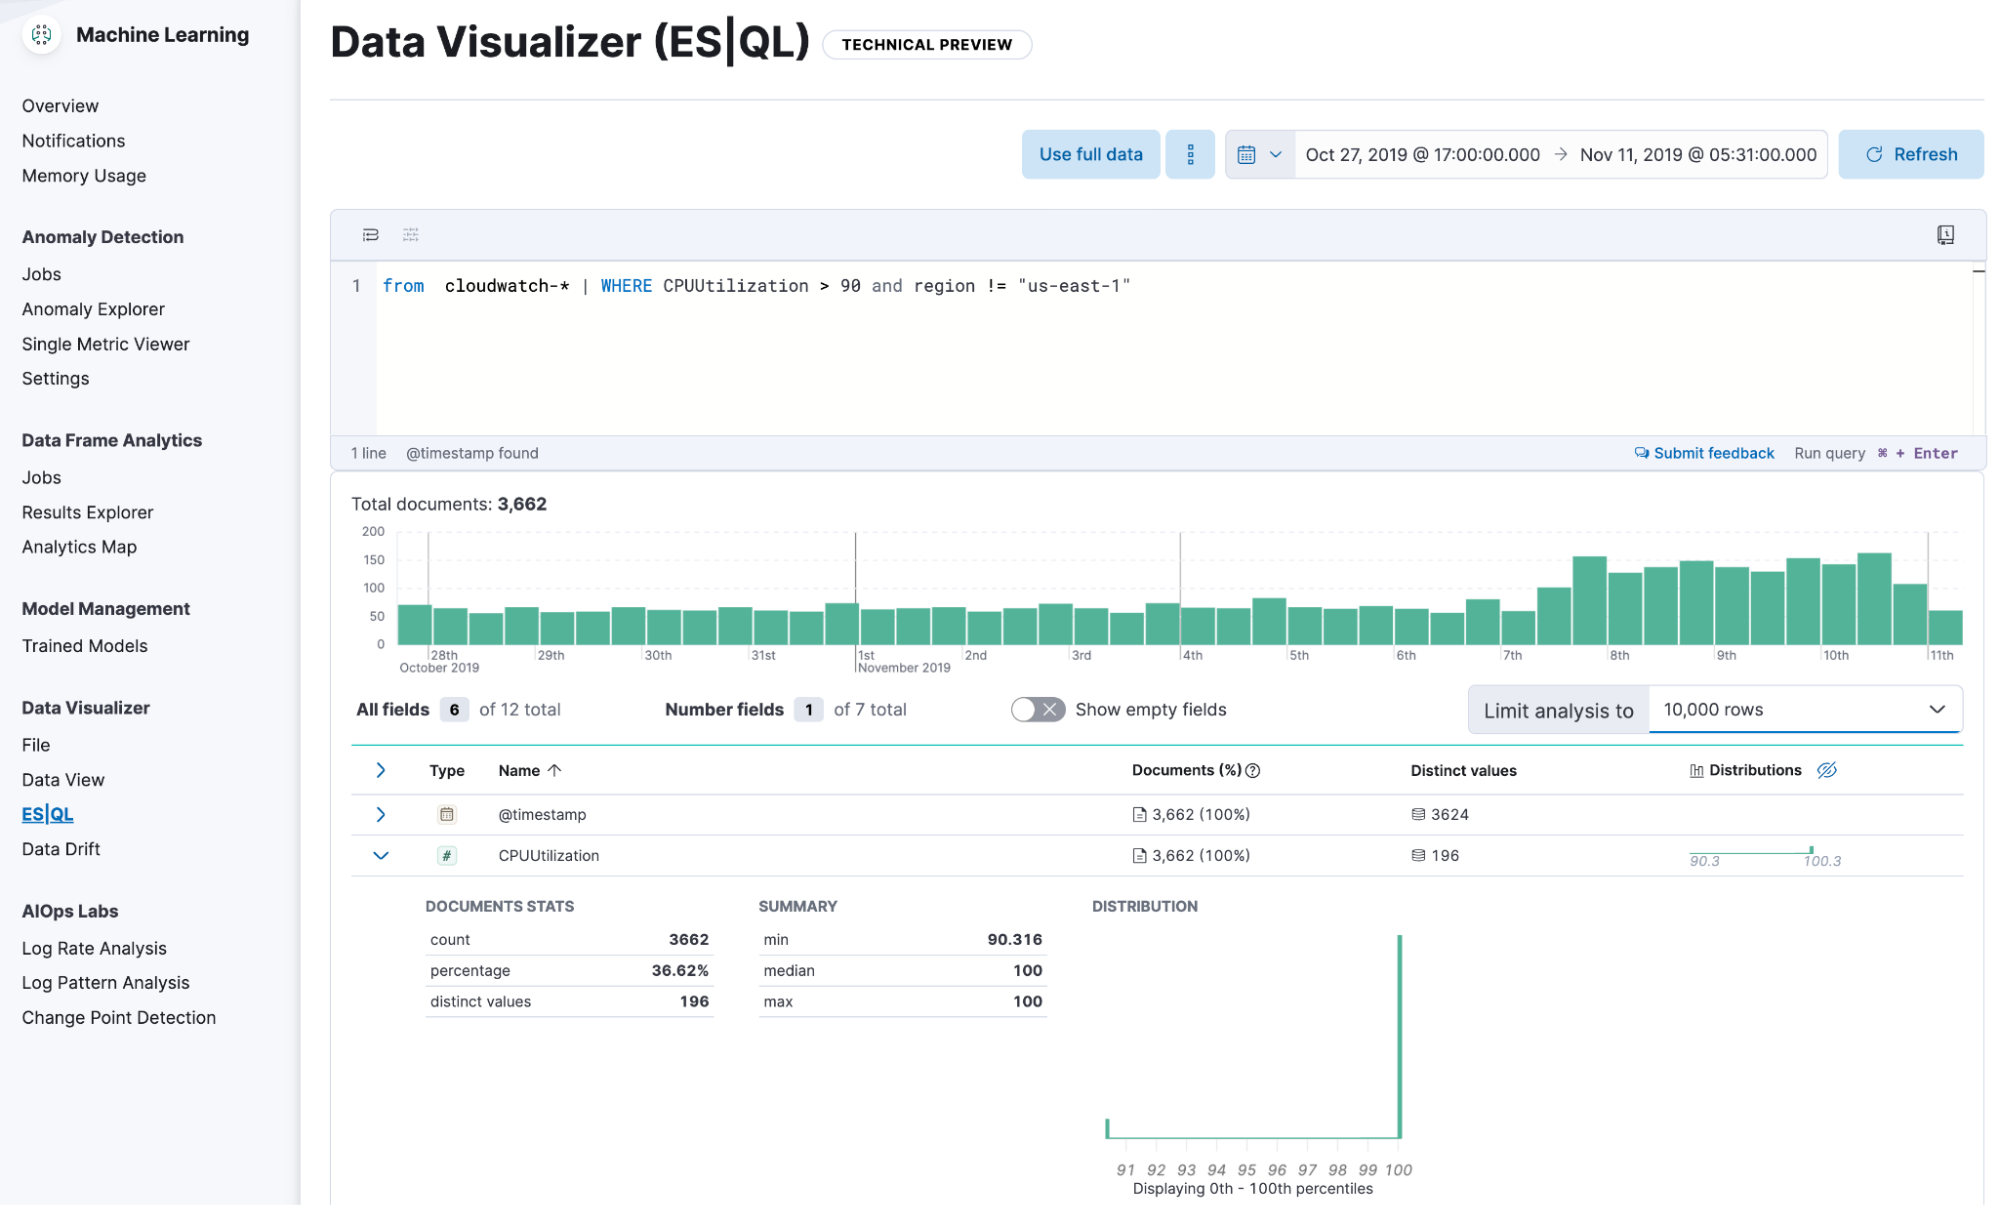
ES|QL support in the Data Visualizer
The Data Visualizer now supports ES|QL, Elastic’s new piped query language that simplifies data investigation. Run your ES|QL queries in the Data Visualizer to explore your data sets easily. Choose to explore and apply your query to the entire data set or a subset of it for speed. In 8.13, this functionality is in technical preview and supports keyword, text, numeric, boolean, date, and ip fields.
Anomaly detection and AIOps: Usability enhancements
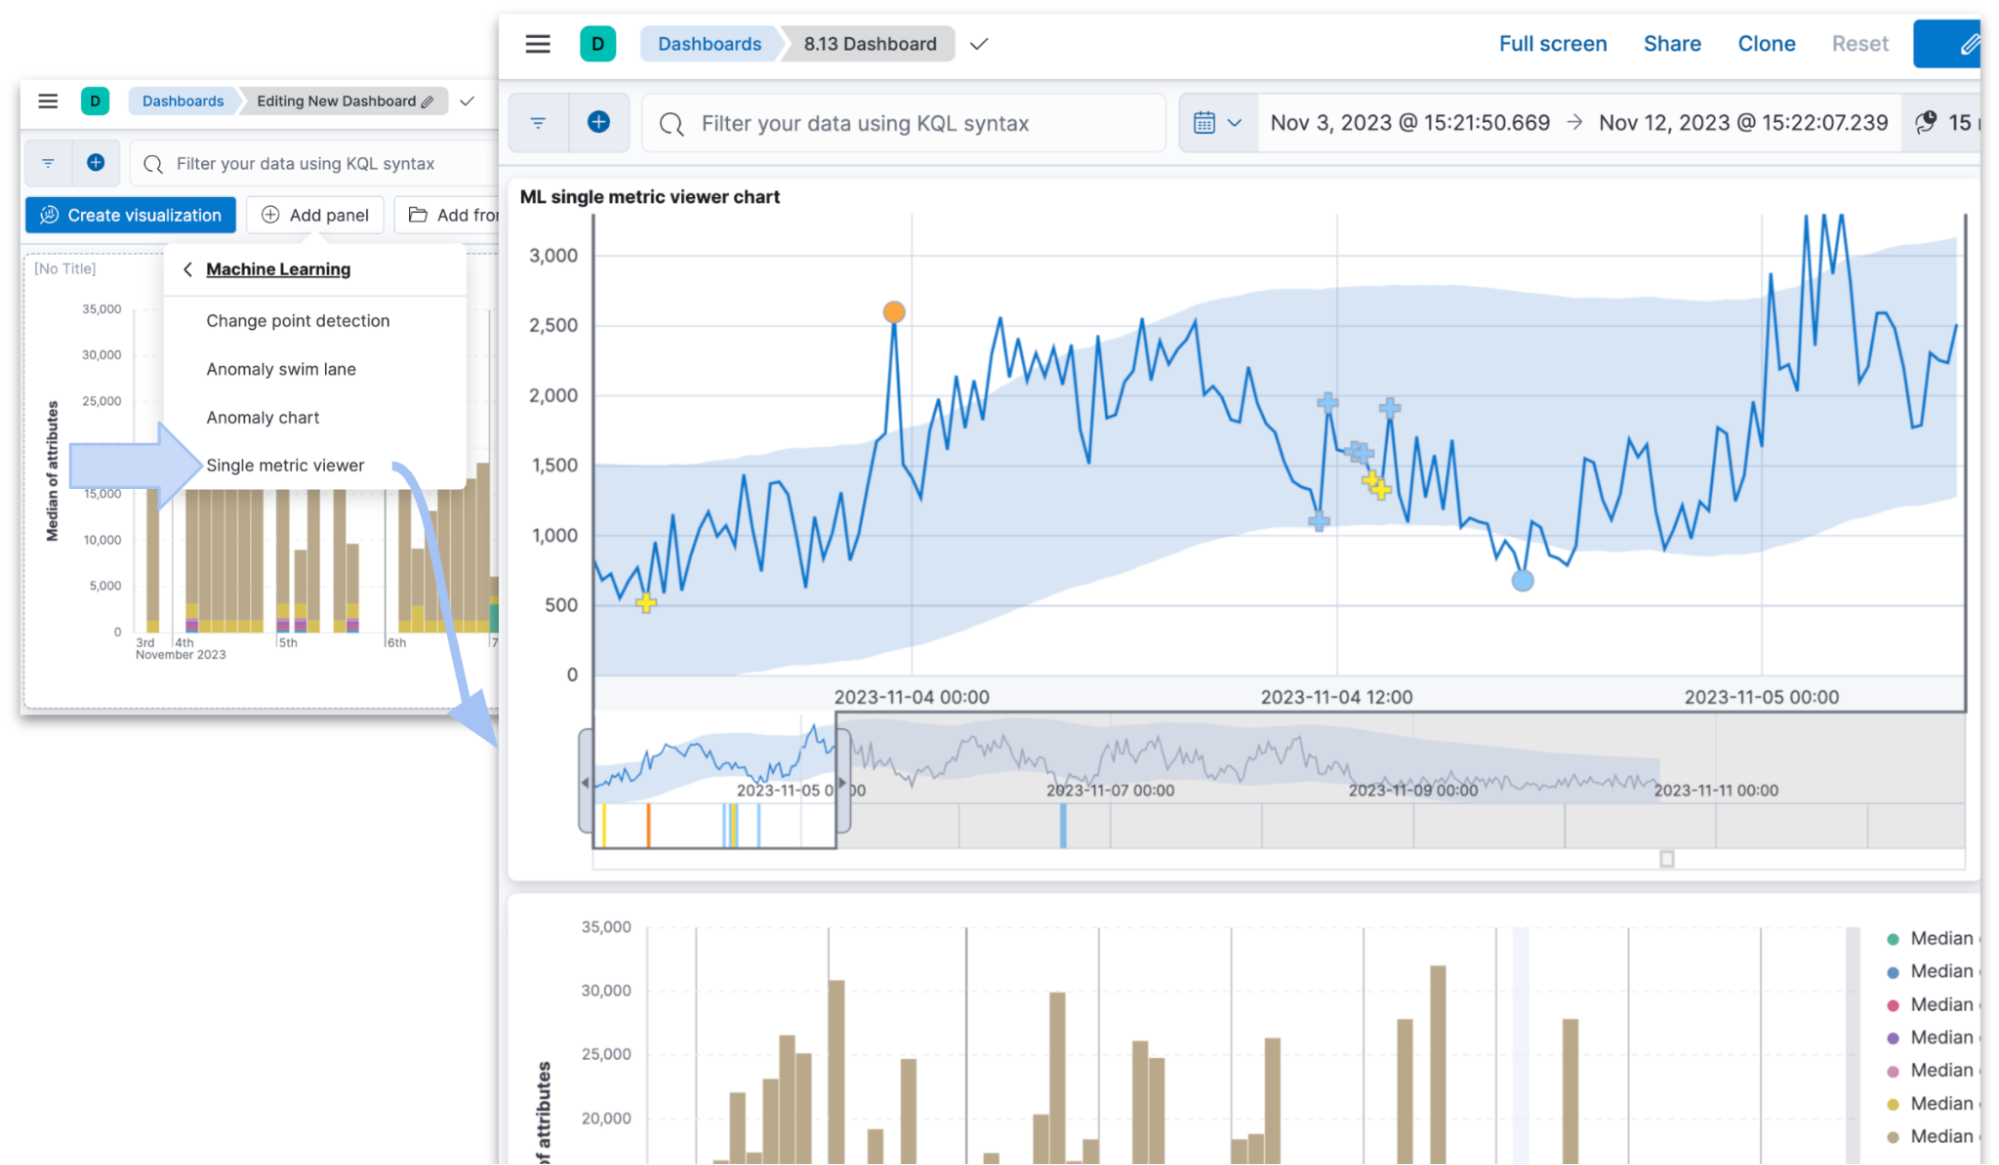
You can now easily add single metric anomaly detection charts to dashboards. Under the “Add panel” option in the dashboard’s edit mode, select Machine Learning and then the Single metric viewer option from the menu.
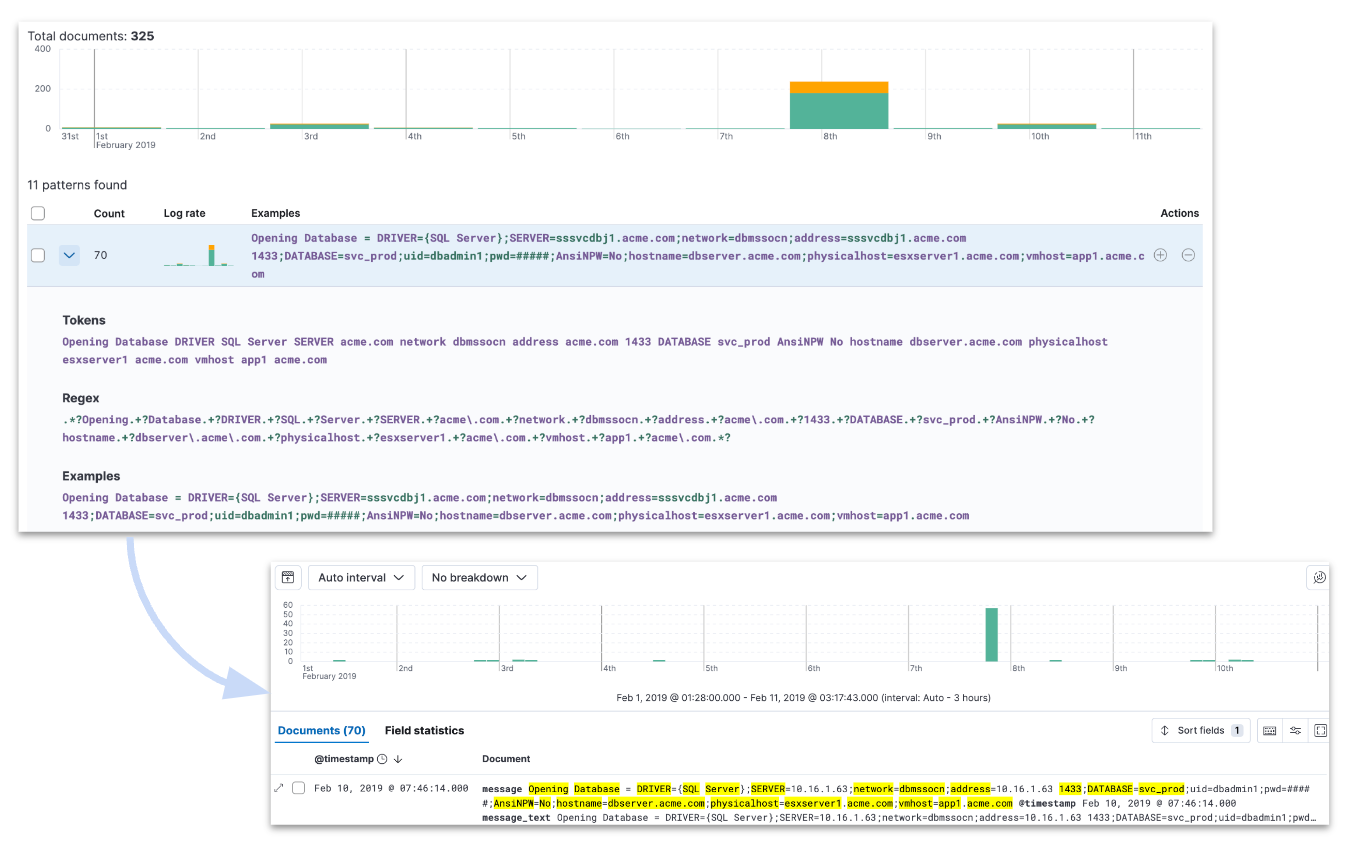
In addition, we have enhanced Pattern Analysis in AIOps so that you can expand a row and see the tokens, the regex, and a few examples that give you a better sense of the pattern. Also, the syntax highlighting (font color) reflects the detected pattern. When you choose to filter a pattern in Discover’s main view, the highlighting is now consistent between the Pattern Analysis feature and Discover.
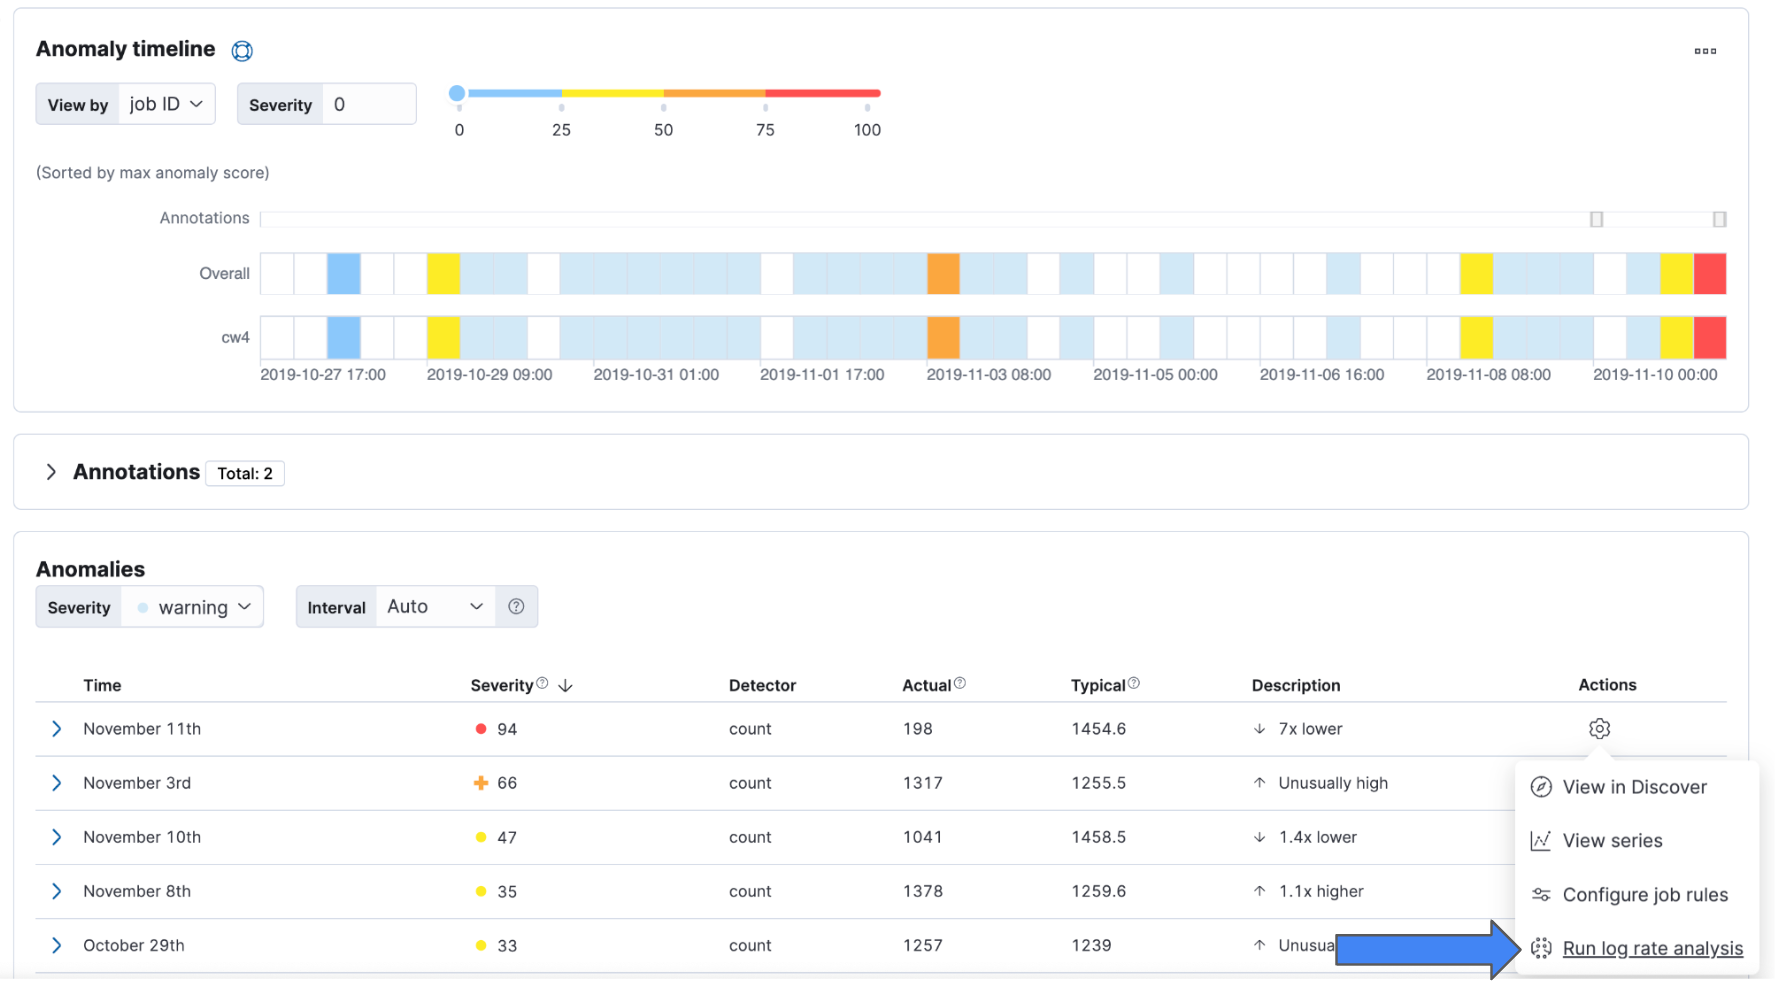
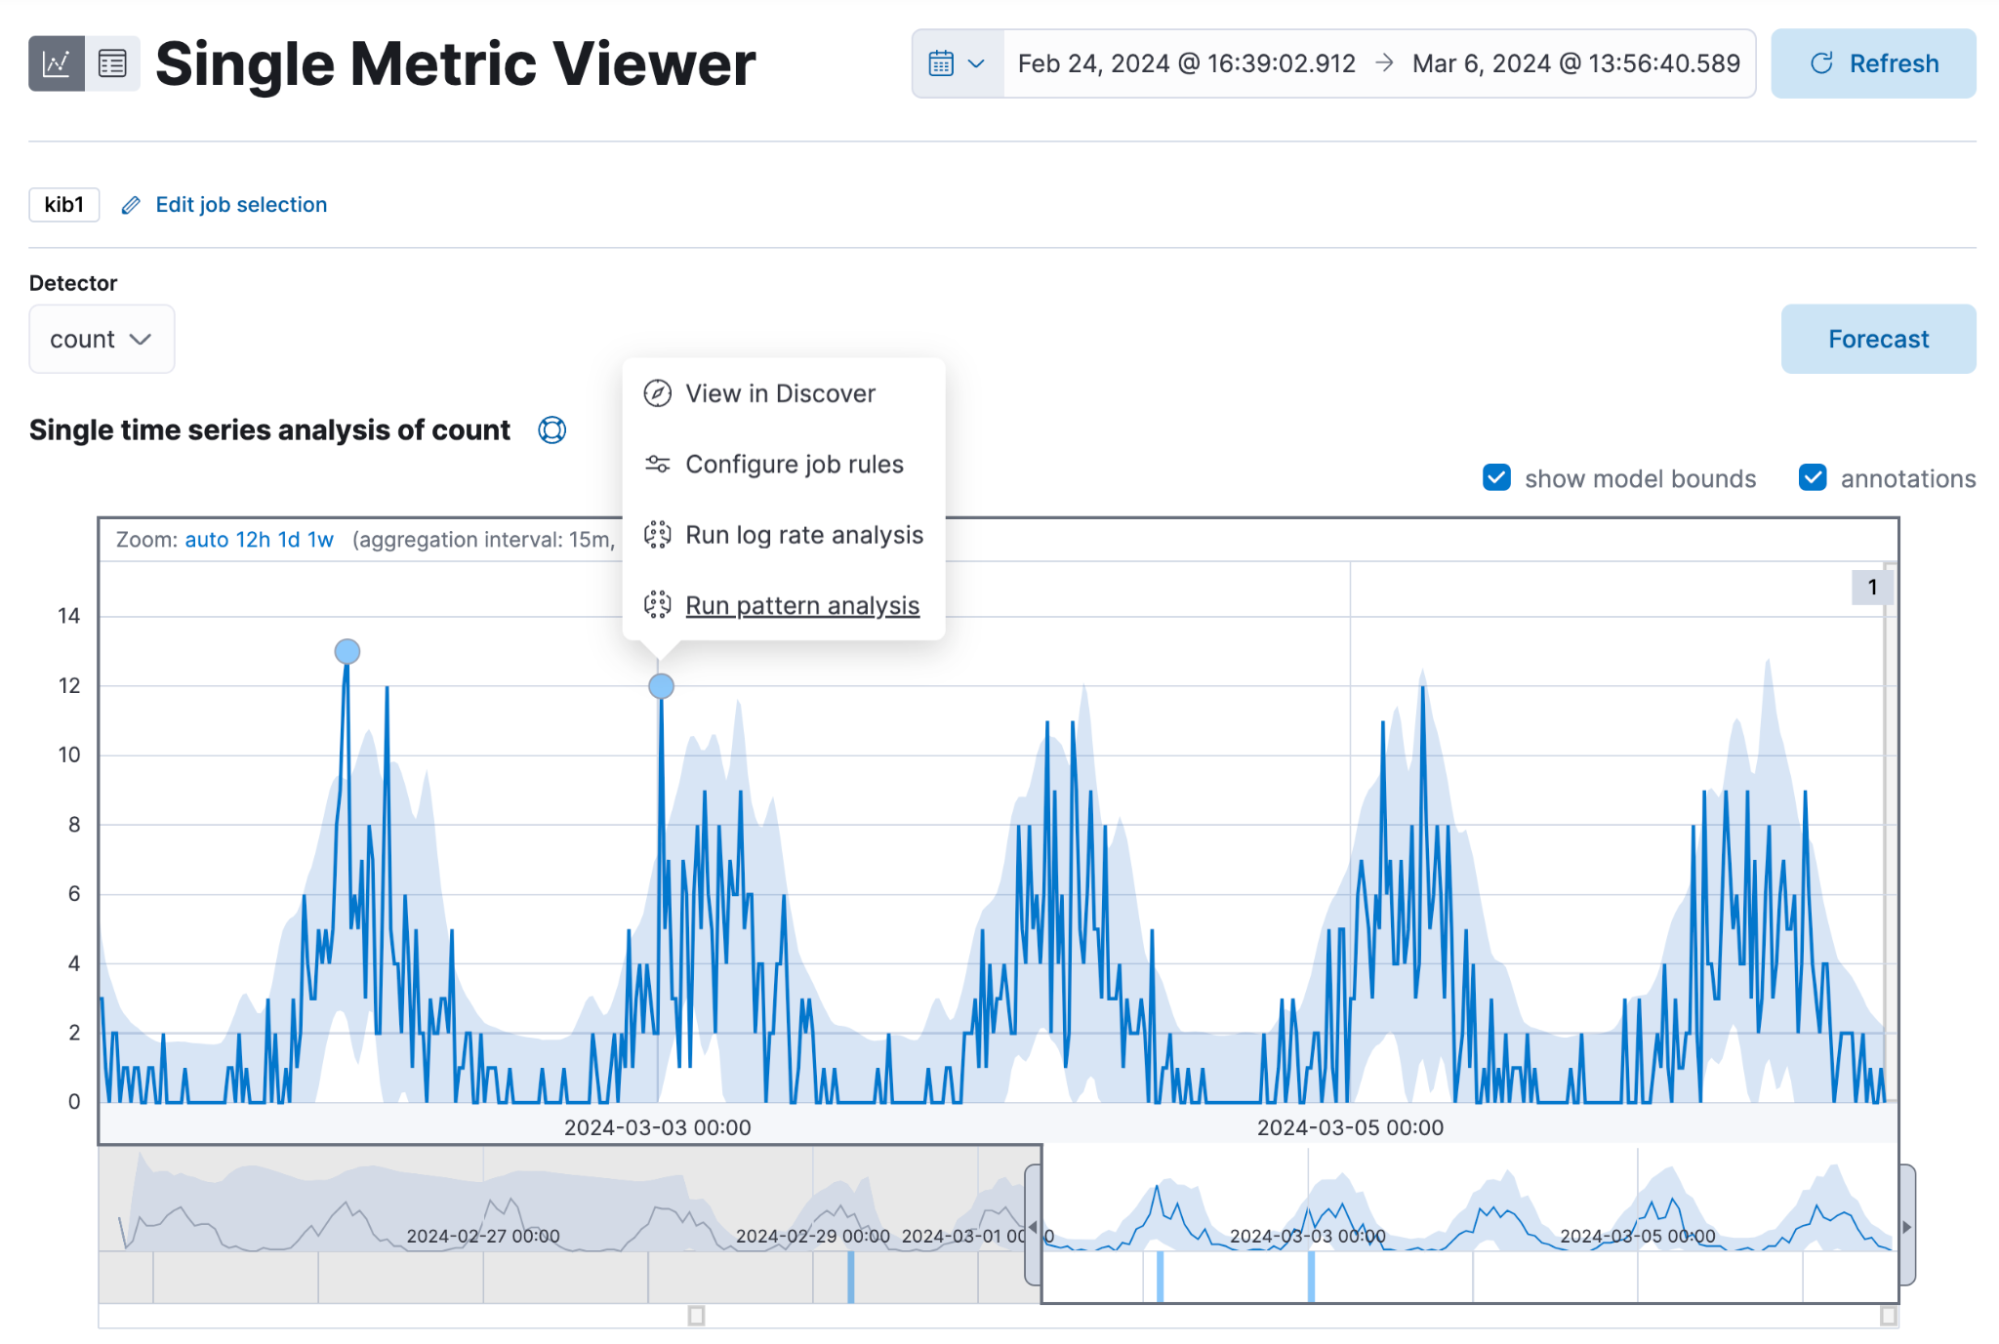
In addition, you can now run Log Rate Analysis from the Anomaly Explorer and the Single Metric Viewer. Click on the Actions cog and select Run log rate analysis from the menu. You will be directed to the Log Rate analysis UI in Machine Learning.
From 8.13, you can achieve the same from the anomaly markers in the Single Metric Viewer. Click on them and the actions menu will appear.
Elastic Integration Filter: A game-changer for Logstash Users
In the ever-evolving landscape of data processing and analytics, the need for flexible and powerful tools is critical. Elastic integrations, which provide schemas and visualizations for a vast array of data sources, make it easy for users to unlock the full potential of their data.
The new Logstash plugin — the Elastic Integration Filter — combines the power of Logstash with data intelligence, allowing you to transfer the execution of integration-specific transformations from Elasticsearch to Logstash before sending them to Elasticsearch. By adding the Elastic Integration Filter to a Logstash pipeline, you can now bridge the gap between Logstash’s distributed processing capabilities and Elastic’s catalog of integrations. This allows you to solve a wide range of use cases, including air gapped environments, data privacy processing, and multiple destinations.
Elastic Agent support for Kafka is now GA
In November, Elastic Agent’s native output to Kafka became available in technical preview. We’re excited to announce that the Elastic Agent for Kafka is now GA.
Many organizations choose to use Kafka in their data processing pipeline due to its persistence/queueing and streaming capabilities, including a fully managed cloud service, and simplified operational demands through specialized connectors. Kafka's scalable architecture allows for efficient data handling, ensuring system stability and optimized Elasticsearch indexing. Key features include data aggregation and transformation, decoupling of data sources and consumers for enhanced stability, and comprehensive integration capabilities with other systems like Logstash. This integration facilitates efficient data analysis and processing, accommodating growing data volumes and complex workloads with ease.
While this functionality has been exposed in Beats for some time, the Elastic Agent simplifies deployment and management by consolidating data collection and parsing into a single agent. It offers centralized management through Kibana's Fleet, where policies can be updated and pushed to hosts easily, and extends Elastic's value by incorporating endpoint protection for enhanced security without extra tools or effort.
Try it out
Read about these capabilities and more in the release notes.
Existing Elastic Cloud customers can access many of these features directly from the Elastic Cloud console. Not taking advantage of Elastic on cloud? Start a free trial.
The release and timing of any features or functionality described in this post remain at Elastic's sole discretion. Any features or functionality not currently available may not be delivered on time or at all.
In this blog post, we may have used or referred to third party generative AI tools, which are owned and operated by their respective owners. Elastic does not have any control over the third party tools and we have no responsibility or liability for their content, operation or use, nor for any loss or damage that may arise from your use of such tools. Please exercise caution when using AI tools with personal, sensitive or confidential information. Any data you submit may be used for AI training or other purposes. There is no guarantee that information you provide will be kept secure or confidential. You should familiarize yourself with the privacy practices and terms of use of any generative AI tools prior to use.
Elastic, Elasticsearch, ESRE, Elasticsearch Relevance Engine and associated marks are trademarks, logos or registered trademarks of Elasticsearch N.V. in the United States and other countries. All other company and product names are trademarks, logos or registered trademarks of their respective owners.
Share
- Share on Twitter
Share on Twitter
- Share on LinkedIn
Share on LinkedIn
- Share on Facebook
Share on Facebook
- Share by Email
Share by Email
- Print this page
Print