Elastic Stack 8.11: Introducing a new powerful query language, ES|QL
This new piped language simplifies the process of data exploration and is easy to learn

 Share on Twitter
Share on Twitter

 Share on LinkedIn
Share on LinkedIn

 Share on Facebook
Share on Facebook

 Share by Email
Share by Email

 Print this page
Print
Elastic® Stack 8.11 introduces data stream lifecycle, a simple way to configure retention and downsampling for data streams (tech preview), plus details about the cross-cluster search response in the Kibana® Inspector and general availability for the reroute ingest processor.
These new features allow customers to:
- Manage data stream retention directly in the data stream without needing an ILM policy
- See more information about their remote searches so they can triage any potential issues
- Route documents to the right index based on values in their fields
Elastic Stack 8.11 is available now on Elastic Cloud — the only hosted Elasticsearch® offering to include all of the new features in this latest release. You can also download the Elastic Stack and our cloud orchestration products, Elastic Cloud Enterprise and Elastic Cloud for Kubernetes, for a self-managed experience.
What else is new in Elastic 8.11? Check out the 8.11 announcement post to learn more >>
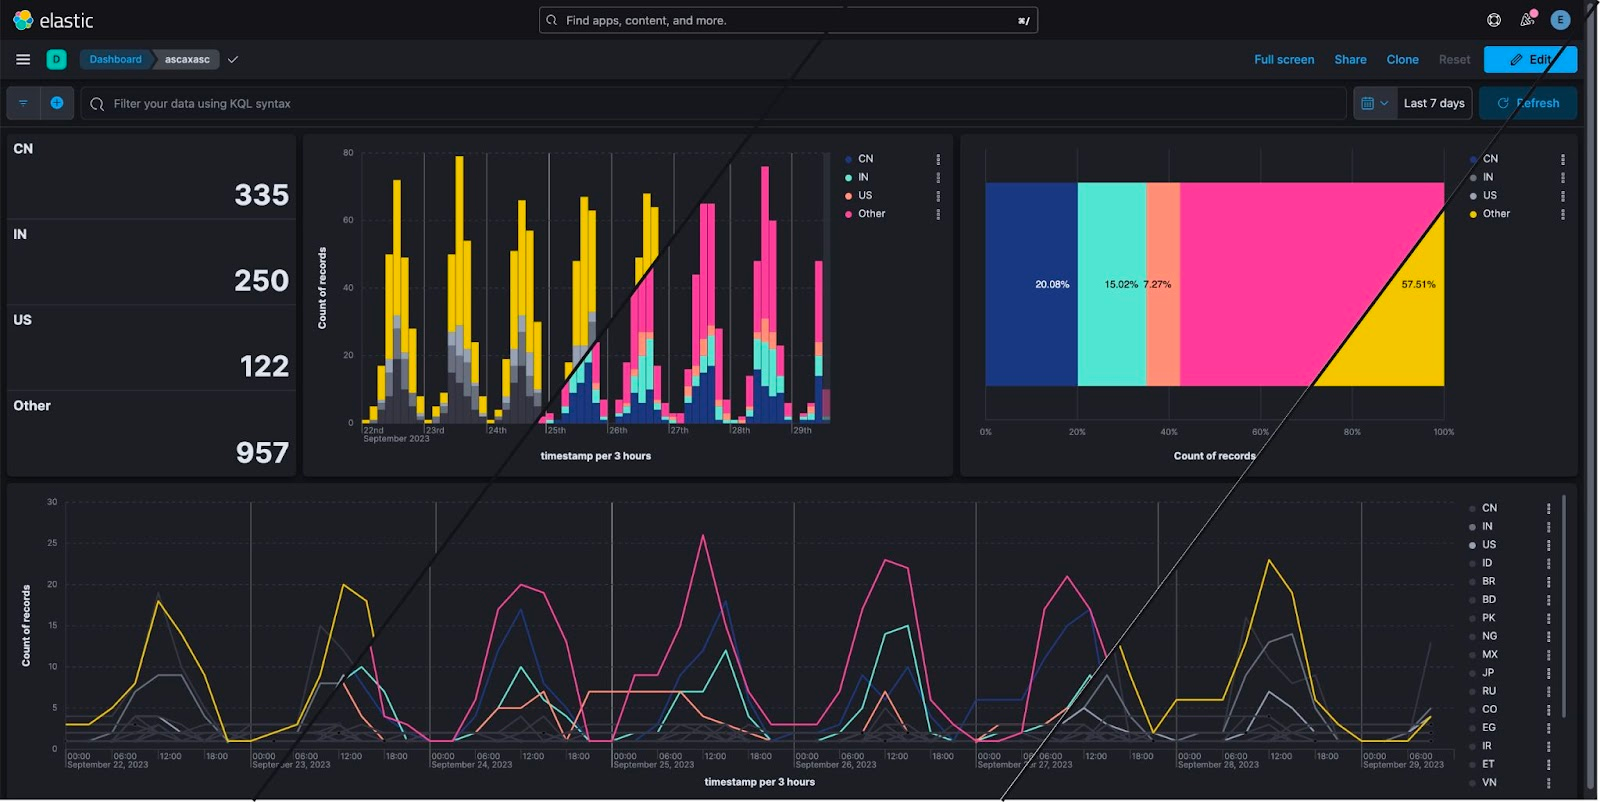
ES|QL in Discover: Shorten your time to insights with aggregations and visualizations directly from Discover
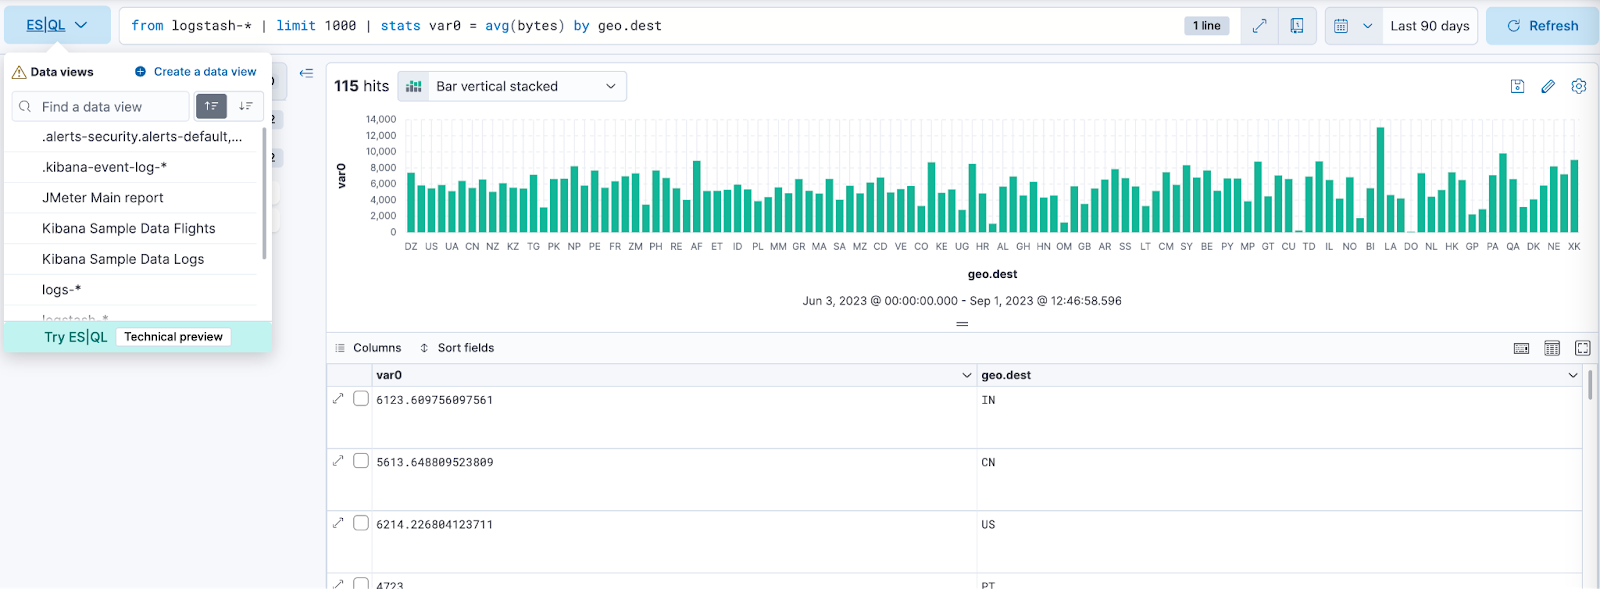
In 8.11, we are introducing Elasticsearch Query Language (ES|QL), Elastic’s new piped language for data exploration and investigation. ES|QL transforms, enriches, and simplifies your data explorations process.
Here is what you can expect:
- Easy start: To begin using ES|QL in Discover, simply select “Try ES|QL” from the data-view picker. It’s user friendly and straightforward.
- Efficient and easy query building: ES|QL in Discover offers auto-complete and in-app documentation, making it easy to craft powerful queries right from the query bar.
- Comprehensive and powerful data exploration: Conduct ad-hoc data exploration within Discover. Create aggregations, transform data, enrich data sets, and more, directly from the query builder. Results are presented in a tabular format or as visualizations; it depends on the query you are executing.
- Contextual visualizations: When writing ES|QL queries in Discover, you’ll receive visual representations powered by the Lens suggestion engine. Your query’s nature determines the type of visualization you get (e.g., a metric, histogram heatmap).
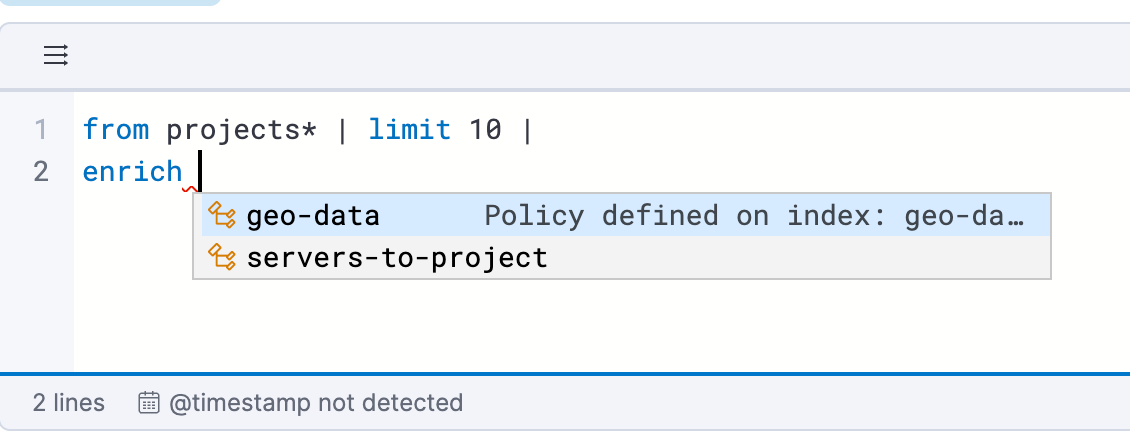
- Enrichment: Use the enrich command to enhance your query data set with fields from another data set, complete with in-context suggestions for the selected policy (i.e., hinting the matching field and enriched columns).
- In-line visualization editing: Edit ES|QL visualizations directly within Discover and Dashboards. No need to navigate to Lens for quick edits; you can make changes seamlessly.
- Dashboard integration: Save your ES|QL visualizations to a Dashboard directly from Discover once you’re satisfied with the results.
- Alerting: Utilize ES|QL for observability and security alerts, setting aggregated values as thresholds. Enhance detection accuracy and receive actionable notifications by emphasizing meaningful trends over isolated incidents, reducing false positives.
ES|QL in Discover brings efficiency and power to your data investigations, streamlining your path to insights.
Example of ES|QL query with Observability use case:
from metrics*
| stats max_cpu = max(kubernetes.pod.cpu.usage.node.pct), avg_mem = max(kubernetes.pod.memory.usage.bytes) by kubernetes.pod.name
| sort max_cpu desc
| limit 10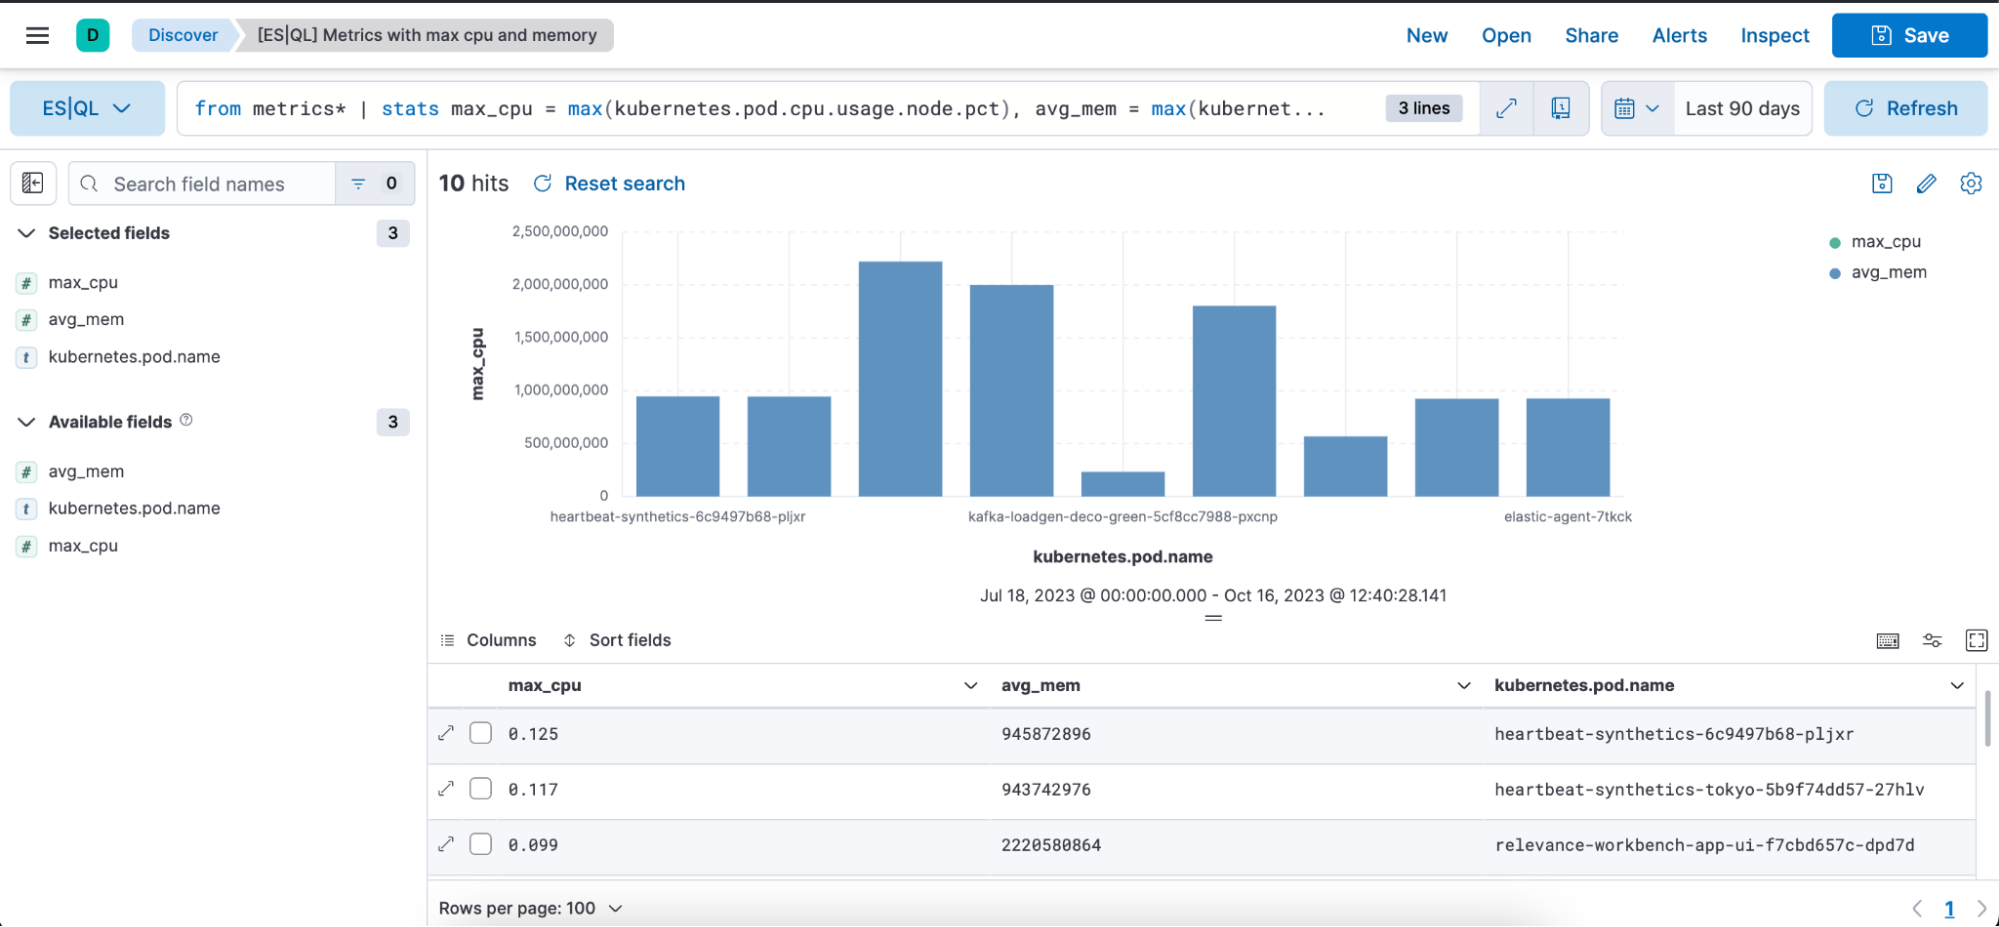
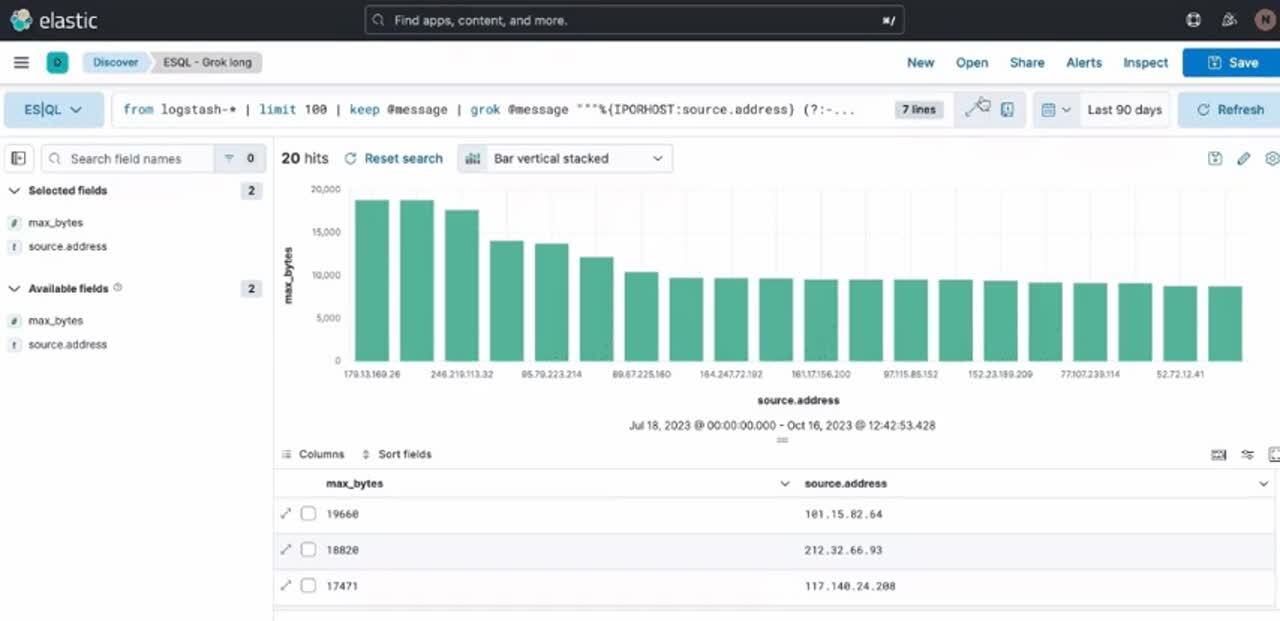
Example of ES|QL query with Observability use case and using GROK:
from logstash-* |
limit 100 |
keep @message |
grok @message """%{IPORHOST:source.address} (?:-|%{HTTPDUSER:apache.access.user.identity}) (?:-|%{HTTPDUSER:user.name}) \[%{TIMESTAMP_ISO8601:timestamp}\] "(?:%{WORD:http.request.method} %{NOTSPACE:url.original}(?: HTTP/%{NUMBER:http.version})?|%{DATA})" (?:-|%{INT:http.response.status_code:int}) (?:-|%{INT:http.response.body.bytes:int}) "(?:-|%{DATA:http.request.referrer})" "(?:-|%{DATA:user_agent.original})""""
| keep @message, source.address, timestamp, http.response.body.bytes, url.original
| stats max_bytes = max(http.response.body.bytes) by source.address
|sort max_bytes desc
| limit 20
Learn more about ES|QL’s capabilities in the documentation.
New ES|QL rule type
A new ES|QL alerting rule type is now available under the existing Elasticsearch rule type. This rule type brings all the new functionalities that are available within the new and powerful language — ES|QL — to Kibana Alerting to allow and unlock new alerting use cases.
With the new type, users will be able to generate a single alert based on defined ES|QL query and preview the query result before saving the rule. When the query returns an empty result, no alerts will be generated.
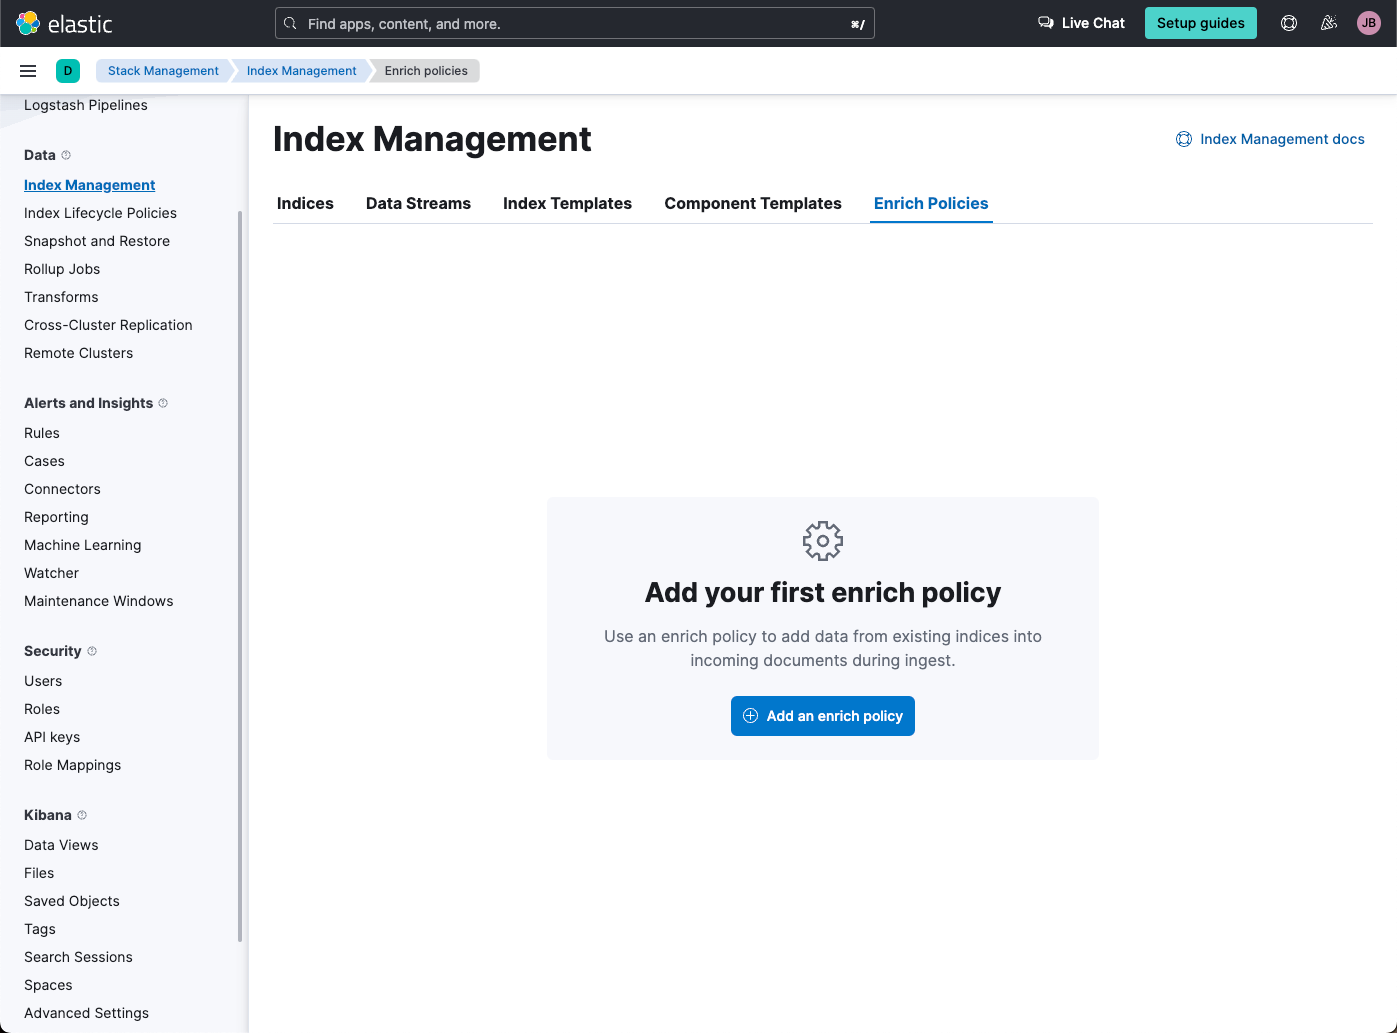
Create and manage ES|QL enrichment index policies
In support of our new ES|QL capabilities, we have added enrich policies to our Index Management experience. Users can now create their enrichment policies right from here and get started using it right away. Once configured, all enrich policies are available in the Enrich Policies tab. Existing policies can be managed right from the Enrichment Policies tab in Index Management.
Example of an ES|QL Query utilizing an enrich policy with ENRICH:
from projects* |limit 10 |
enrich servers-to-project on project_id with name, server_hostname, cost |
stats num_of_servers = count(server_hostname), total_cost = sum(cost) by project_id |
sort total_cost desc
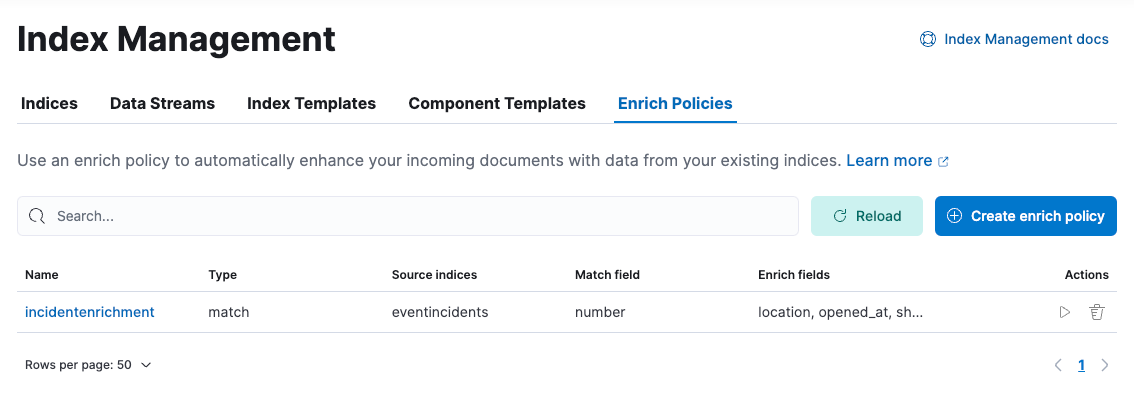
Example of the enrich policies shown in the UI:
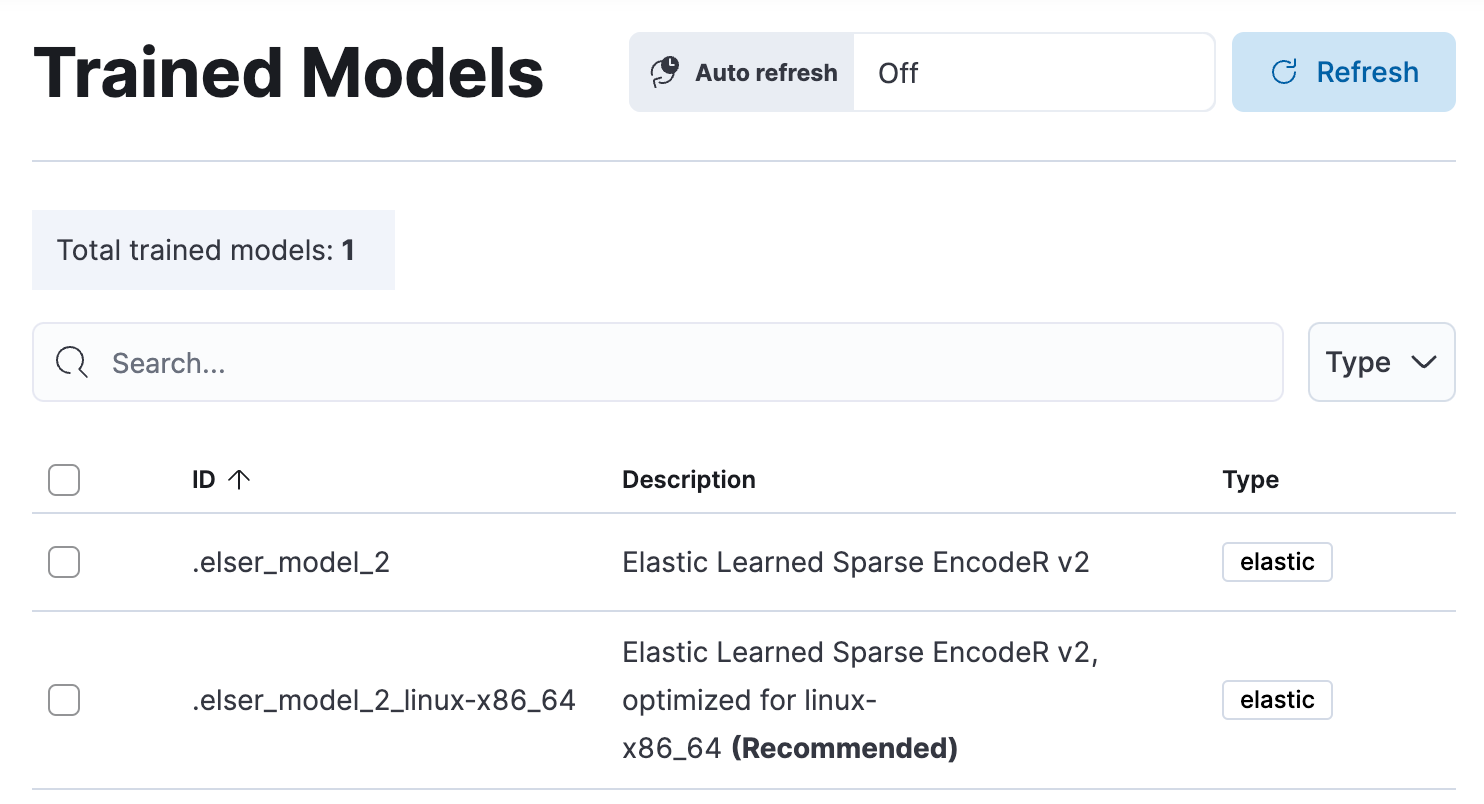
Improved ELSER model is now generally available
In 8.8, we introduced Elastic Learned Sparse EncodeR in technical preview. ELSER is Elastic’s text expansion language model for AI search. It offers superior relevance out of the box (i.e., without the need for retraining on in-domain data or any other ML or MLOps effort). Deploy it with a couple of clicks from Elastic’s UI and start leveraging the power of AI with your search.
In 8.11, we release a generally available second version: ELSER model-2 comes in two versions:
- The optimized model, which runs on the linux-x86_64 platform
- The cross-platform model
Both ELSER model-2 versions — platform-optimized and cross-platform — show improved relevance compared to the original ELSER release, as measured against the BEIR benchmarks. Importantly, the optimized version also shows significantly improved performance as it reduces inference latency. The Elastic Cloud supports the optimized version, so Elastic Cloud users will benefit from the materially improved performance of the optimized ELSER model-2.
Please note that the original version of ELSER (the model available prior to 8.11) will remain in technical preview.
Machine learning inference API
We are working to introduce a unified inference API that abstracts away the complexity of performing inference on different models that are trained for different tasks. The API introduces a simple, intuitive syntax of the form:
POST /_inference/<task_type>/<model_id>
In 8.11, we are releasing a contained first MVP iteration of this framework. This MVP is in technical preview and initially only supports ELSER. This greatly simplifies the syntax for creating an inference pipeline.
More importantly, in the future the new inference API will support both internal and external models and will integrate with the LLM ecosystem for our users to have the most powerful AI effortlessly and seamlessly at their fingertips, through a unified, self-explanatory API.
Lens in-line editing in dashboards
You can now edit a Lens visualization without leaving the dashboard instead of navigating back and forth to the Lens editor. A flyout will be open in the dashboard where you can perform any edits to your Lens panels. This new editing experience is more convenient and will save you time since the dashboard will not need to reload when saving your changes.
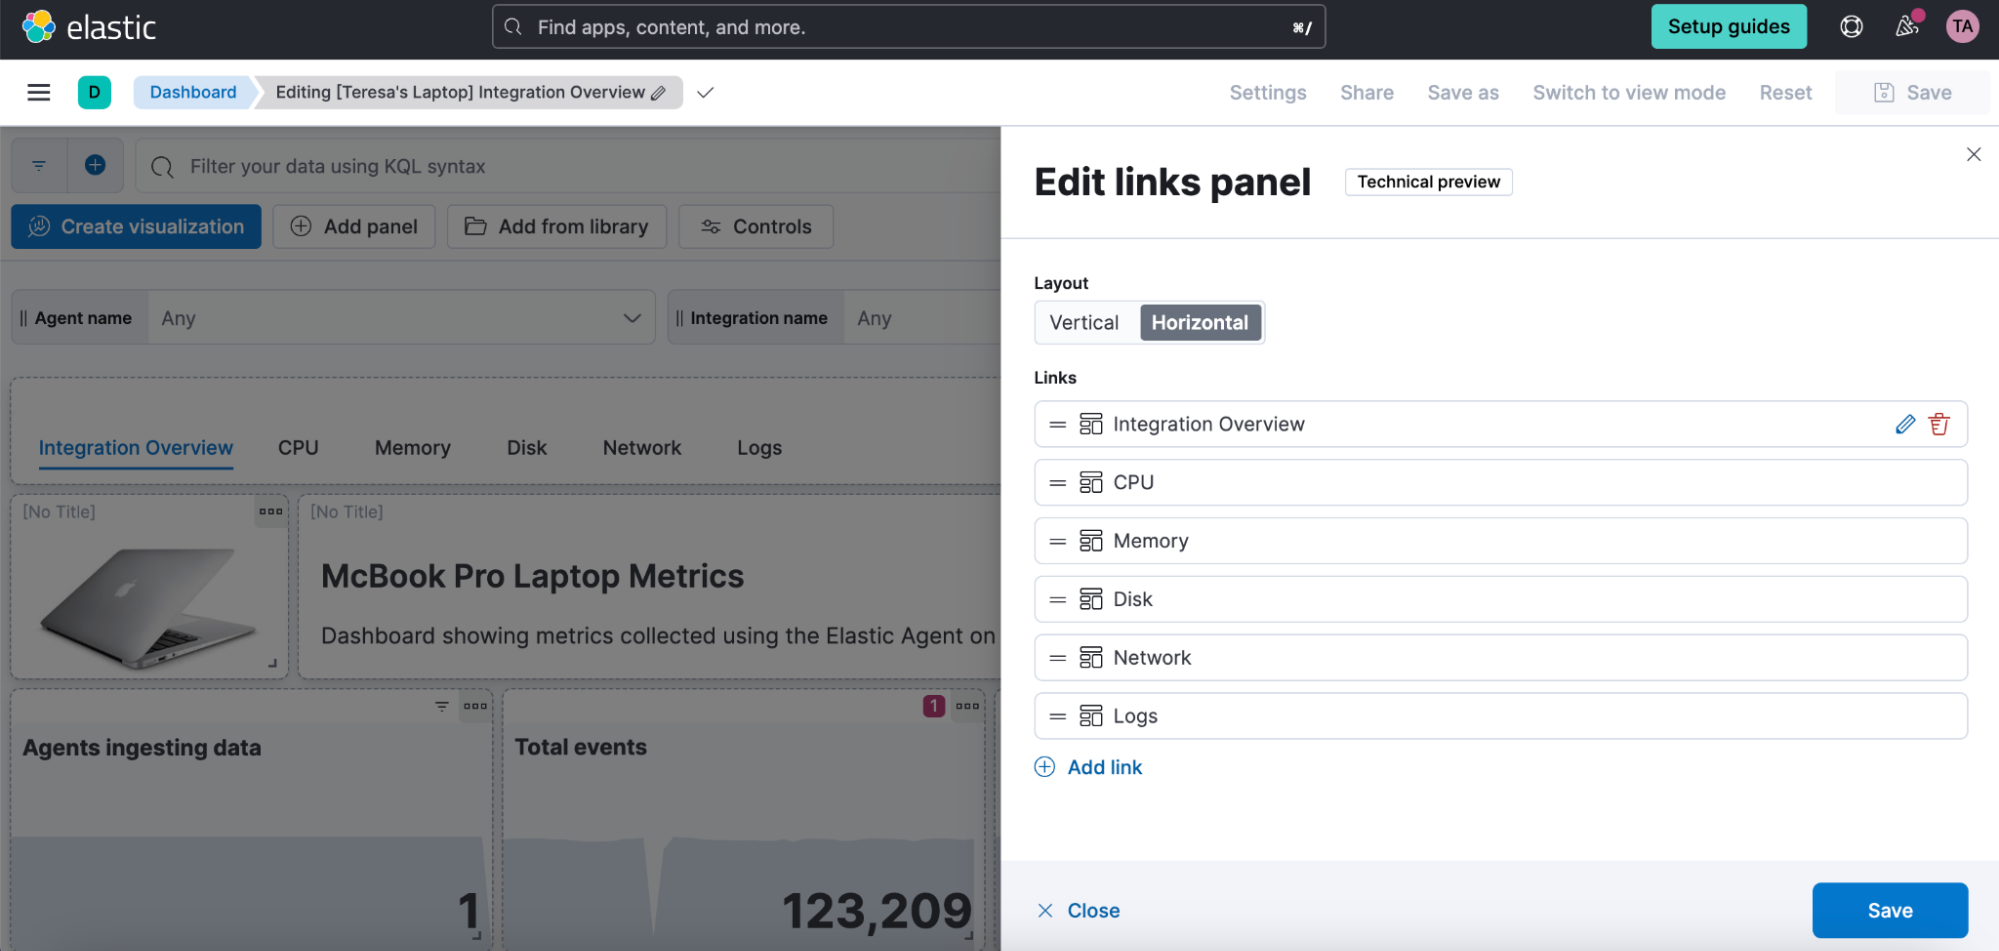
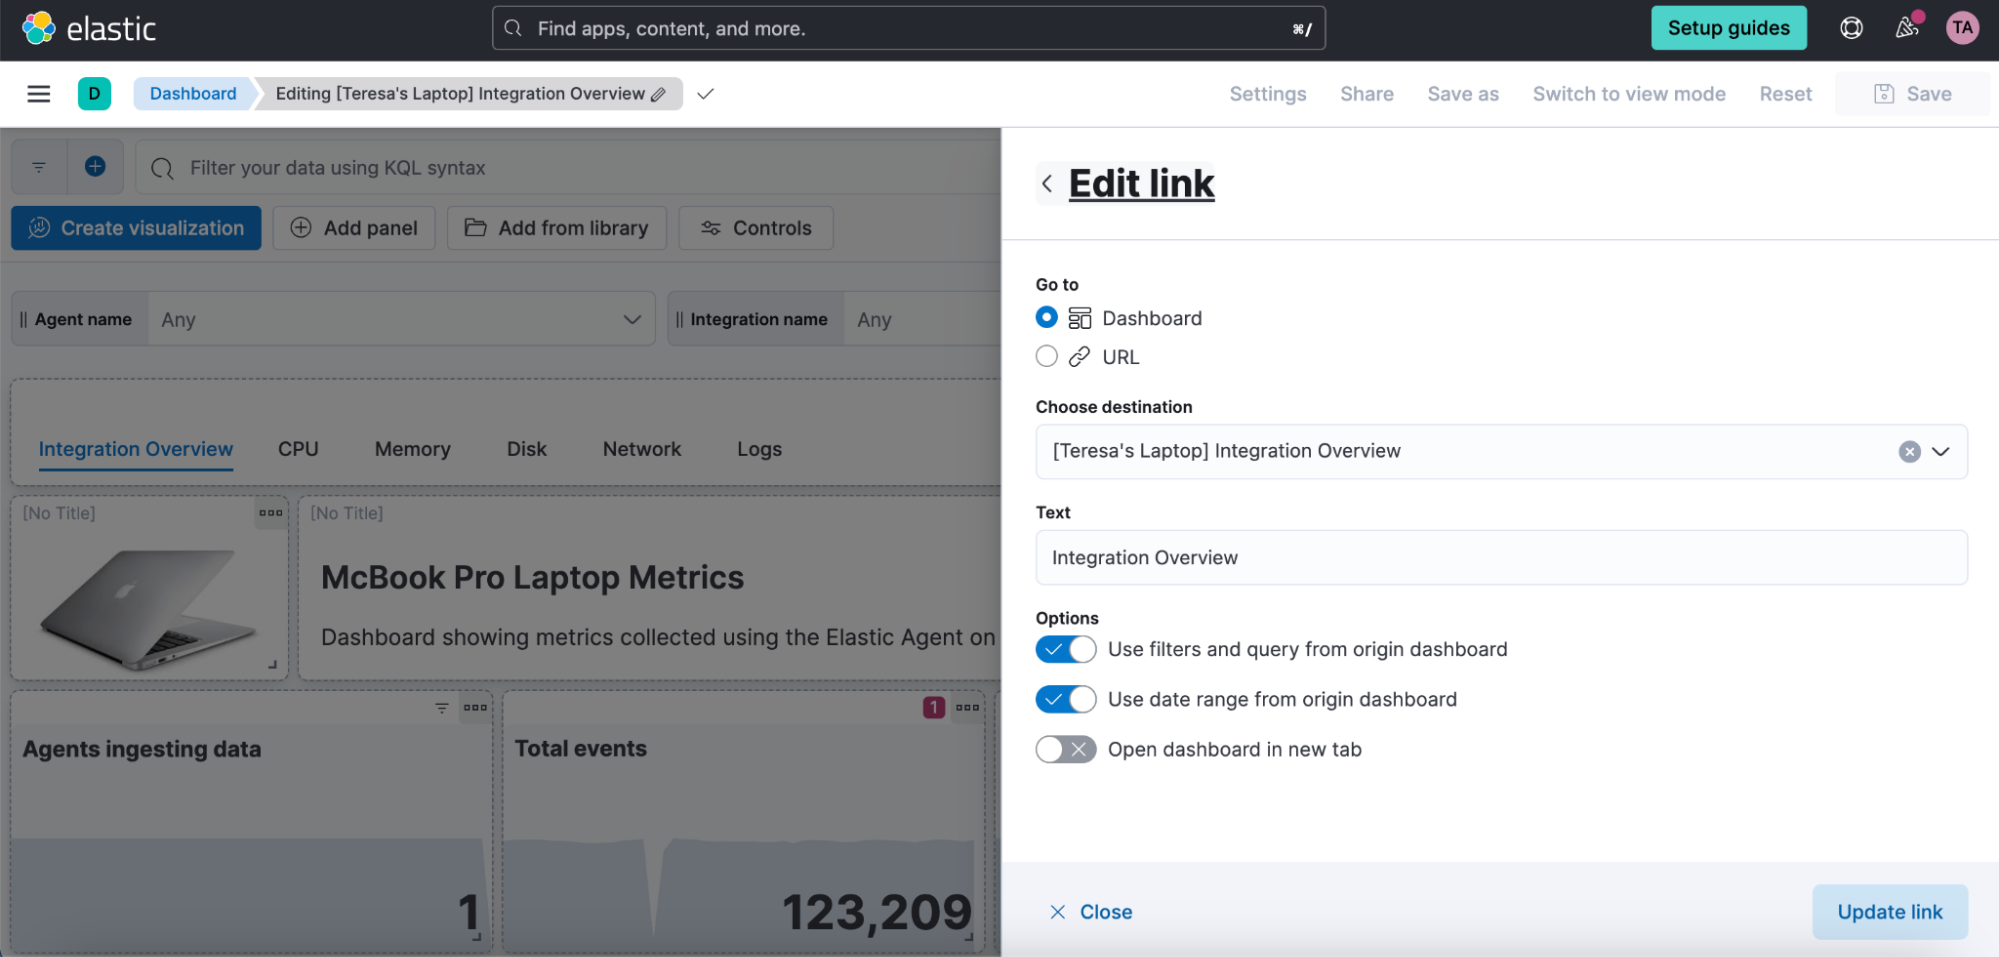
Links panel
You can now easily navigate from one dashboard to another using the links panel. Better organize your dashboards and make them more performant by chunking them in multiple dashboards with fewer visualizations and linking them together. You can carry over your filters, query, and time range when navigating to other related dashboards. Display your links horizontally or vertically as it better suits your dashboard layout.
You can also use the links panel to include external links in your dashboards (e.g., to your wiki page or other applications). Decide whether you want to open the links in the same browser tab or in a new one.
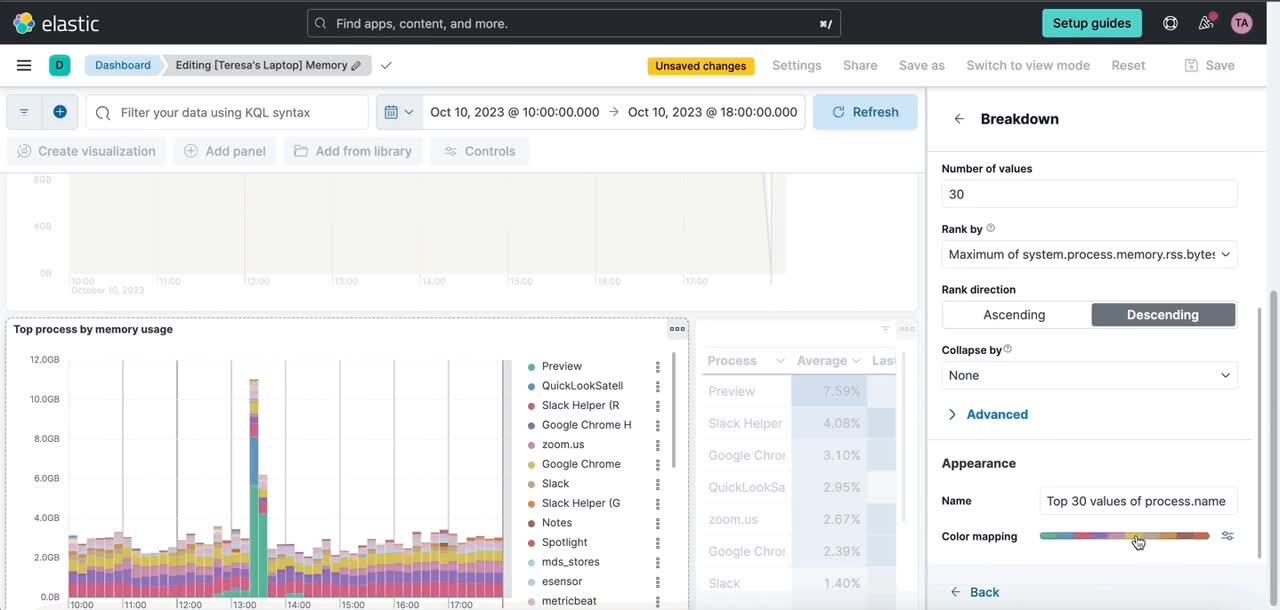
Introducing color mapping for enhanced data visualization
We’re thrilled to announce our latest Kibana feature, which brings significant benefits to your data visualization experience. Color is a fundamental visual element, alongside position and shape, that plays a crucial role in conveying information effectively.
Here’s what our new feature offers:
- Effortless categorization: Easily assign one or more field categories to specific colors. This makes it simpler than ever to organize and understand your data.
- Guided color selection: Our intuitive color picker provides you with predefined palettes that ensures your charts not only look great but also align seamlessly with different Kibana themes.
- Enhanced color palettes: We’ve reintroduced a clear concept of color palettes, making it easier for you to select and apply gradients, improving the overall aesthetics of your visualizations.
Whether you’re working with Cartesian, Partition, or Tag Clouds charts, these enhancements are designed to help you make the most of your data. With this feature, you can expect an improved ability to categorize, differentiate, and emphasize data points on your charts, ultimately leading to better insights and more visually appealing dashboards.
Introducing data stream lifecycle (tech preview)
To manage your Elastic data’s lifecycle, you can use index lifecycle management, which offers a lot of power to fully customize data tier movement, rollover, index settings, downsampling, and more. There are many possibilities and perhaps more customizability than some people need.
We’ve been working on a built-in simplified and resilient lifecycle implementation for data streams that is available now in 8.11. The main idea with data stream lifecycle is simplicity: We’ve designed this capability from the start to be easy to configure, so we removed as many implementation details as possible from the user’s concern, only exposing configuration that relates to your needs. We’ll only ask you things that are relevant to your use case and your business:
- How long should we keep the data before it gets deleted (retention)?
- For your Time Series Data Streams, do you want to reduce the granularity of the metrics over time to reduce storage costs (downsample)?
You can set the retention in Kibana’s Index Management page under Data Streams:
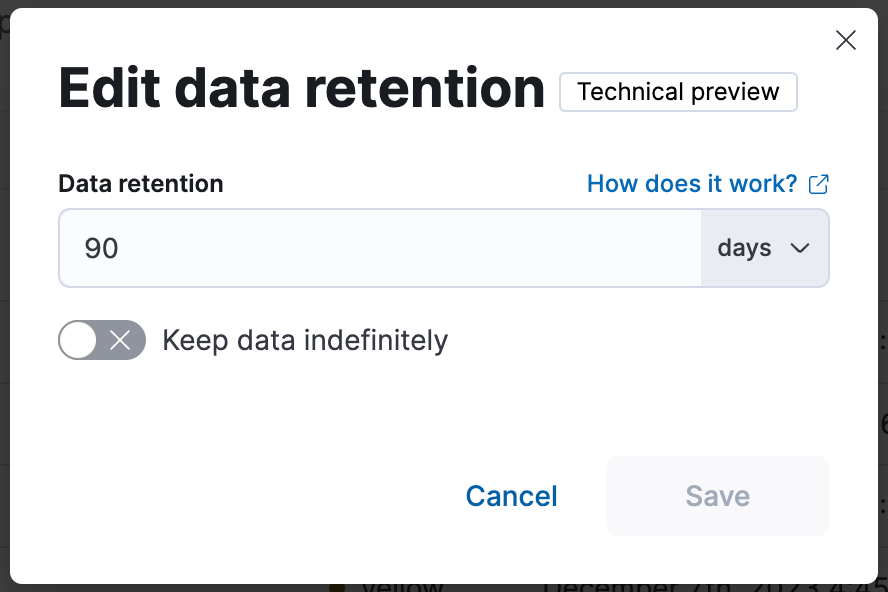
Or via the _data_stream API:
PUT _data_stream/my-data-stream/_lifecycle
{
   "data_retention": "90d"
}
Once you configure the lifecycle, we’ll manage everything else for that data stream. If you’re familiar with ILM, this means we are taking care of rollover and force merge.
That’s right: data streams with a configured lifecycle will be automatically rolled over and tail merged (a force merge implementation that's lightweight and only merges the long tail of small segments instead of the whole shard). With the shard and index maintenance tasks being handled automatically to ensure optimum performance, and trade-off between indexing and searching, you'll be able to focus on the business-related lifecycle aspects that you care about, like data retention and downsampling.
Data stream lifecycle does not currently manage data movement across tiers (warm, cold, frozen). Use cases requiring data tiering should continue to use ILM for now.
The implementation of this lifecycle setting for data streams has been designed very carefully, taking into consideration learnings from supporting ILM for years. ILM uses a stateful step-based execution, where an index has to move from one step to the next. This sometimes requires intervention to figure out why ILM is “stuck” and help to force it along in steps. Instead, data stream lifecycle uses a declarative execution approach, where each time it executes it will evaluate the current state of an index and execute the needed operations in order to fulfill the lifecycle end state configuration.
In 8.11, this feature is in technical preview.
Cross-cluster search response info at your fingertips
Cross-cluster search (CCS) is a great way to unify data across multiple clusters that can be spread all over the world and in different environments. We want it to bring complete search results as often as possible, but maybe some of the remote clusters are having a bad day. We’ll still return partial results whenever we can, but how do you know what’s missing, and which clusters had what errors? 8.11 brings additional search response accounting info, and now we make it easy to find it in Kibana’s Inspector.
Each visualization that has a search that didn’t return 100% without issues will have a warning that also links directly to the Clusters and shards tab of the Inspector.
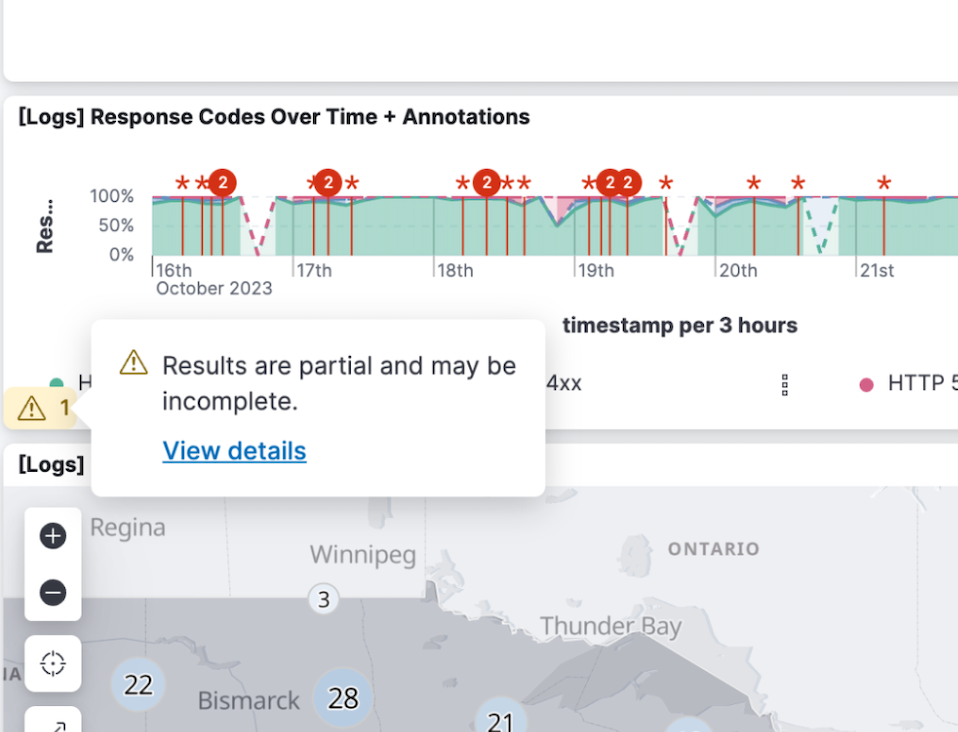
There you can see a list of all the remote clusters (and the local cluster), their search status, and the response time. Expand a cluster to see more detailed info (e.g., how many shards were successfully searched).
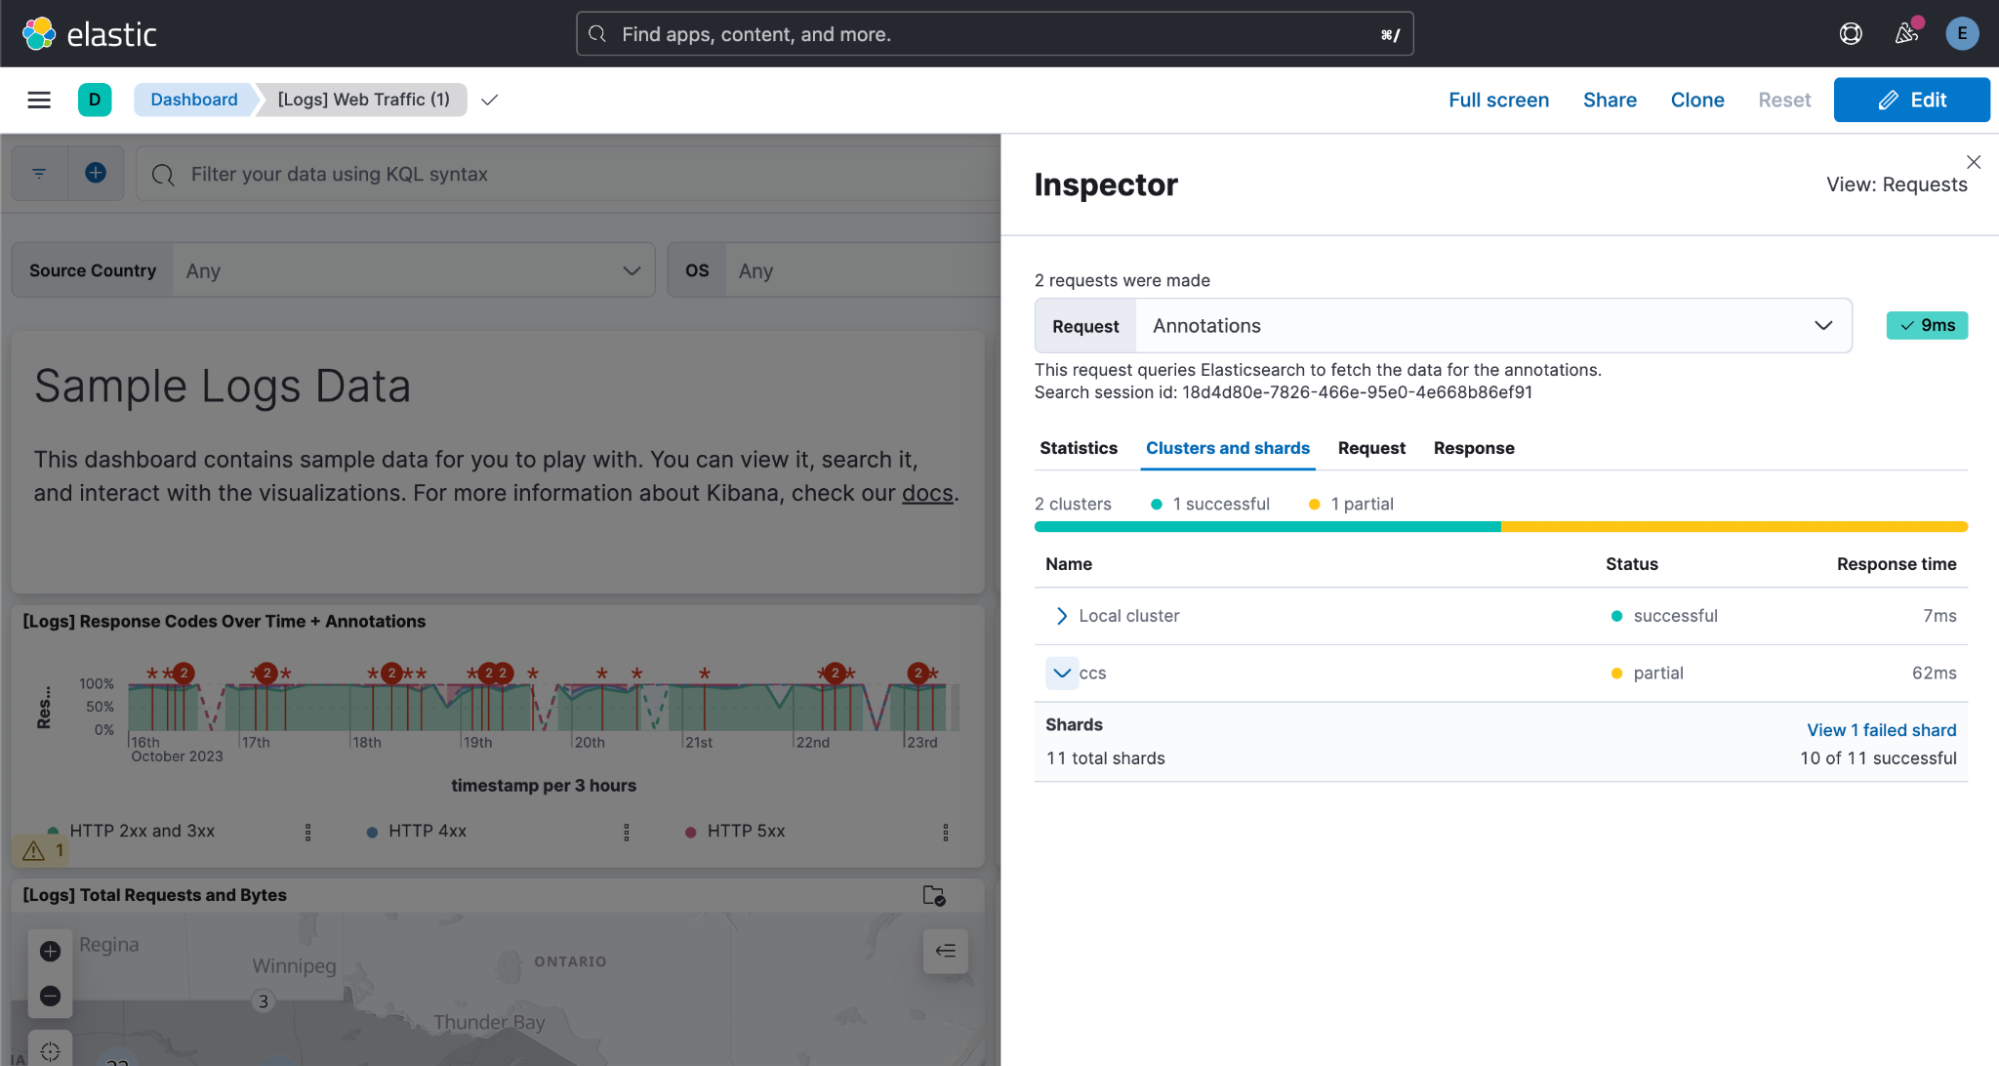
If you want to dig deeper into what happened, click the link in the Shards section to view shard failure details:
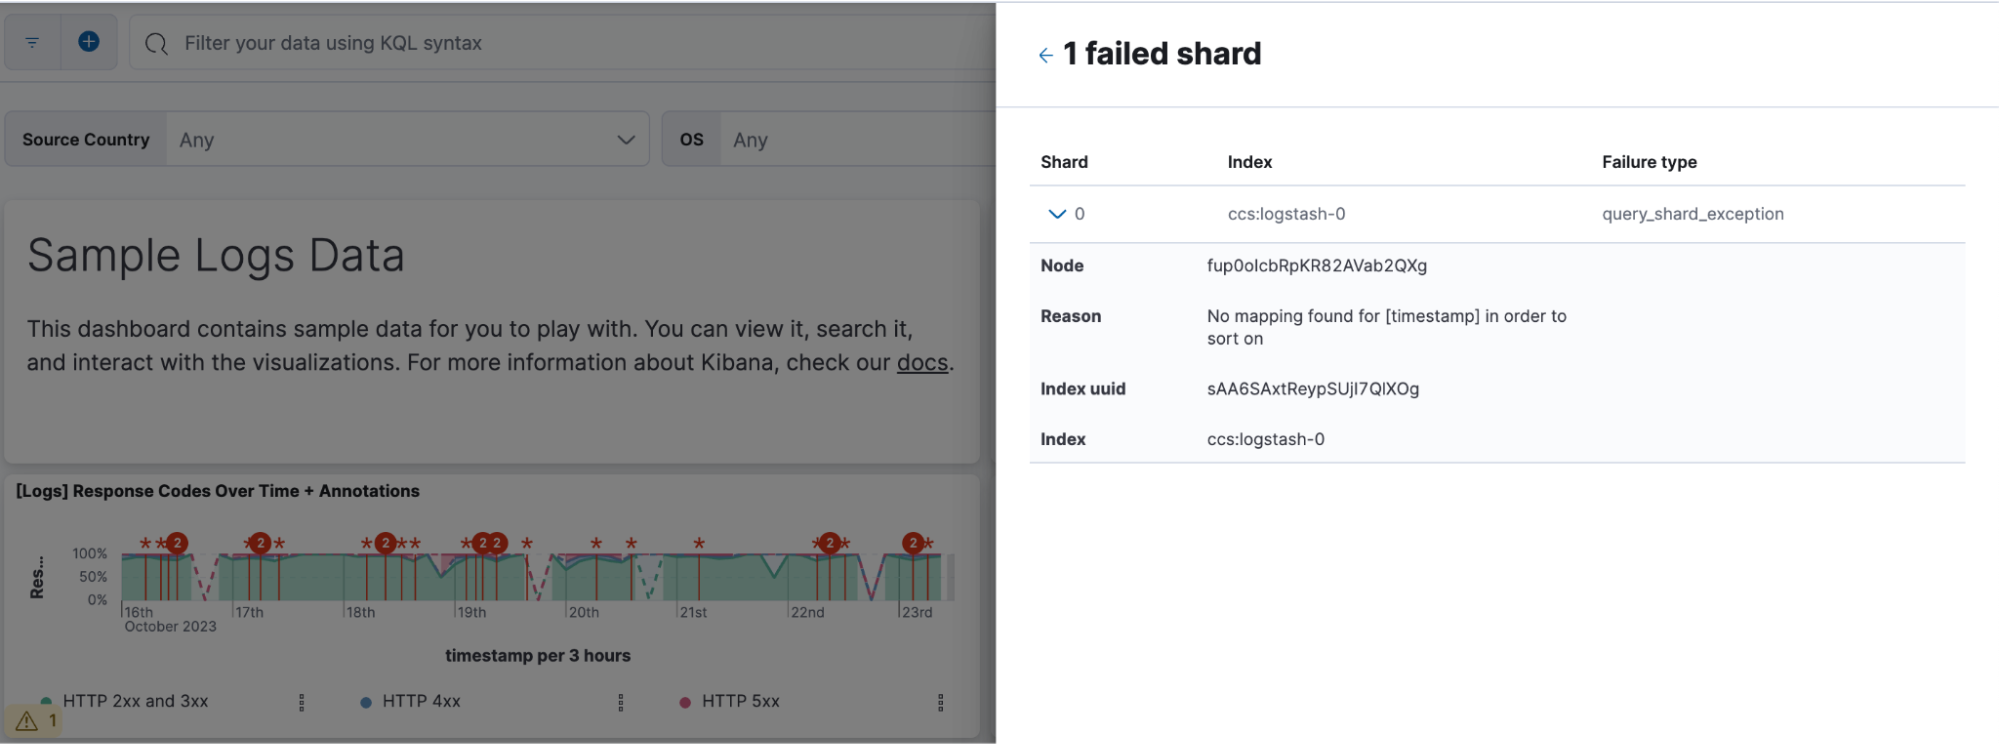
You can also access the Inspector from the panel menu in the corner of each visualization:
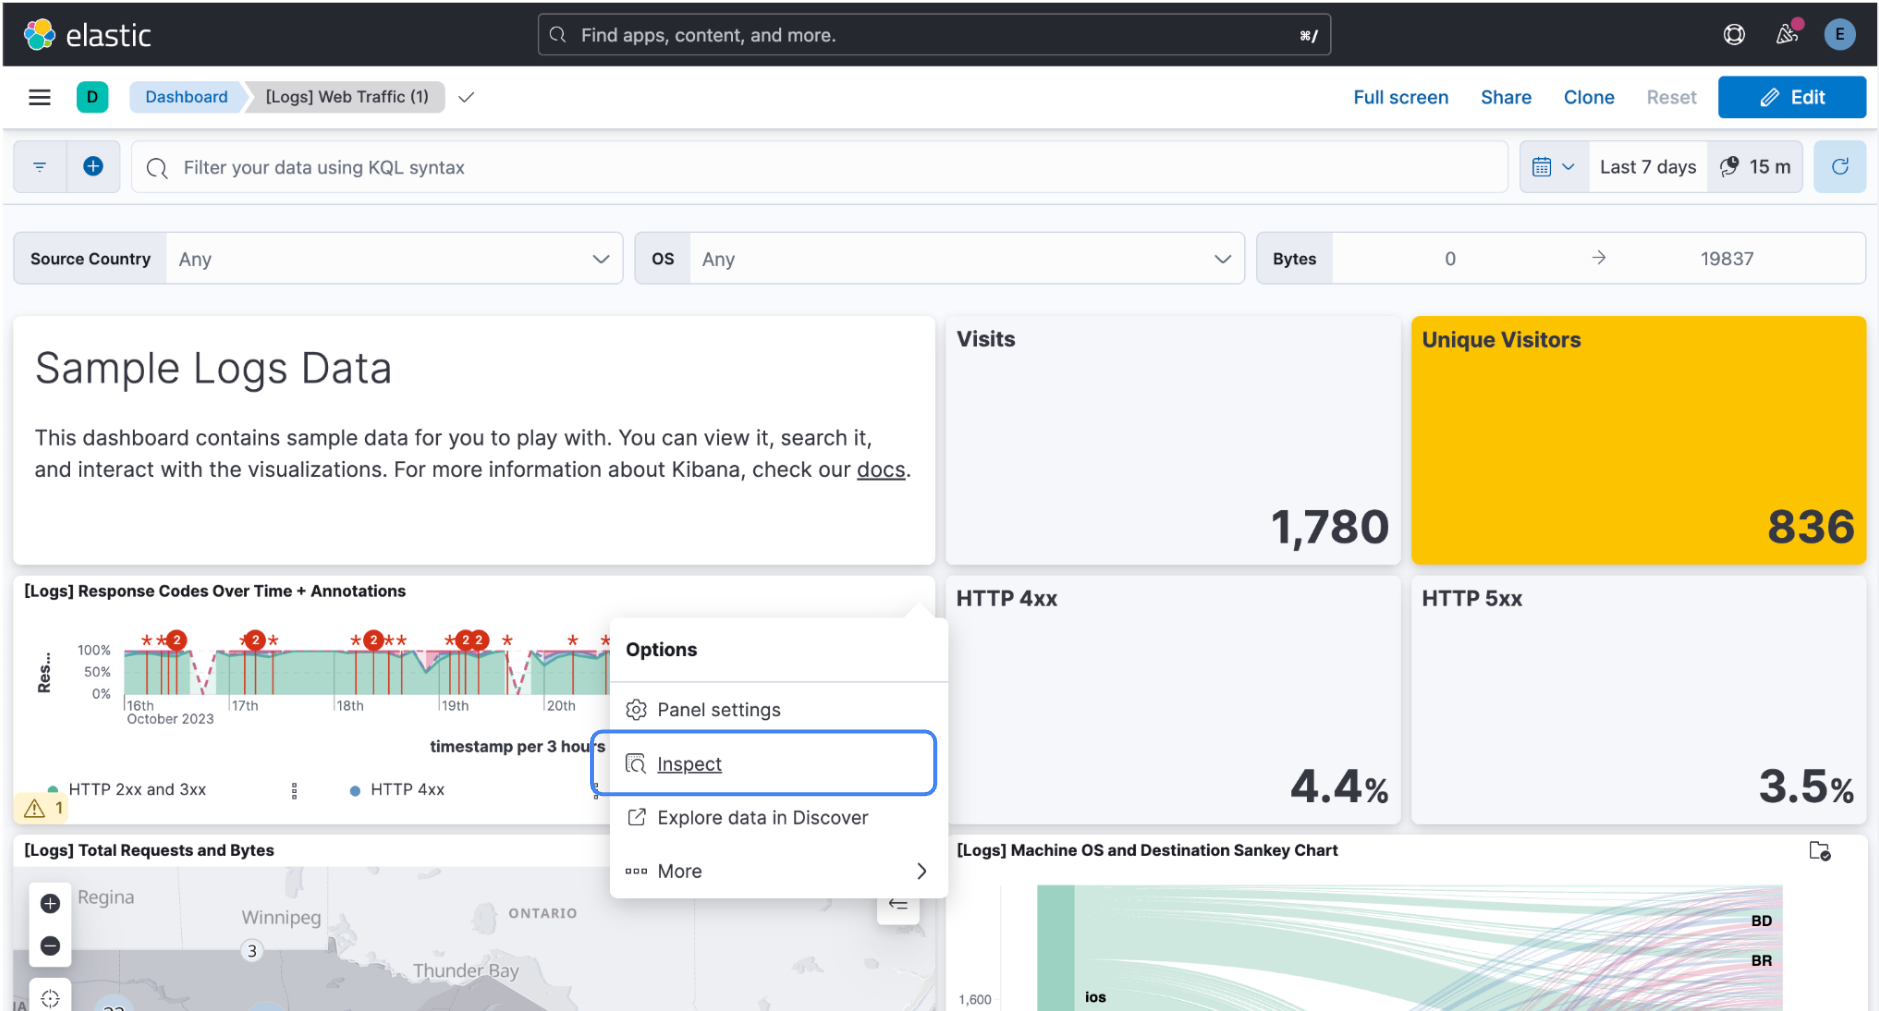
Click Inspect, click View: Requests, and then click the Clusters and shards tab.
In addition to this handy new view in Kibana, Elastic 8.11 also enhances the search response at the API response level. We now provide accounting for partial, failed, and running search statuses for each cluster in addition to the already present successful and skipped counters in the search response.
Search response clusters section in 8.10:
…
   "_clusters": {
      "total": 3,
      "successful": 2,
      "skipped": 1,
      "details": {
        "(local)": {
          "status": "successful",
          …
        },
…
In 8.10, both partial and successful were counted as successful, and both skipped and failed were counted as skipped.
Enhanced search response clusters section in 8.11:
…
   "_clusters": {
      "total": 6,
      "successful": 2,
      "partial": 1,
      "skipped": 1,
      "failed"; 1,
      "running": 1,
      "details": {
        "(local)": {
          "status": "successful",
          …
        },
…
You might use the running counter to monitor the progress of your asynchronous searches. It can potentially be used to create progress bars or provide real-time updates on ongoing searches. Separating partial from successful makes it easier to understand how accurate a search is, and the granularity can help users identify and address any issues more efficiently. The addition of a failed counter ensures that users are promptly informed about any clusters that have failed during their searches.
Finally, we’ve aligned the behavior so all this new information is available whether you use minimize_roundtrips:true or false with your search request.
Reroute processor is GA
We introduced the reroute processor in technical preview status in 8.8, enabling what we call document based routing. If you have documents coming in mixed together, maybe from a Firehose or docker logging driver, you can set up reroute processors to direct each kind of document to a more applicable ingest pipeline so they can be processed correctly for optimal searching. With Elastic 8.11, reroute is now GA.
If you want to learn more about this capability and see examples, check out this blog by our Observability team.
Finding the most similar paragraph using vector search
We have added the option for a document to have multiple vectors within a single field, and to rank by the most similar vector of the vectors within the document. There are many use cases in which this capability is critical, but two stand out as the most popular:
Chunking text: Many embedding models limit the size of the text to 512 tokens (often meaning approximately 512 words). This roughly translates to a paragraph length text. Users frequently want to search for the text that contains the most relevant paragraph. To do that, the users create a vector per paragraph and want to rank the documents by the most similar vector within each document, which is now supported.
Multiple images: A document frequently contains multiple images (e.g., if the document represents a real estate asset, it will contain multiple images of that asset; if a document represents a product in ecommerce, there will be different images of that product; and if a document represents a person, it will contain multiple images of that person). The user wants to find the most relevant document (e.g., asset, product, or person). The Convolutional Neural Network is designed to generate a vector for each image, and the user wants to rank the docs by the most similar image and vector.
For more information about this exciting and quite unique functionality, see the Adding passage vector search to Lucene blog.
4096 dimension dense vector
We have increased the number of dimensions supported for dense vector search to 4096 dimensions. As indicated in the past, we do not see an issue with raising this bar even further. The reason we maintain the limit at 4096 dimensions is that we currently don’t see production ready models that require higher dimensionality. If the need rises, we will raise the limit further.
Max inner product dense vector similarity
Elasticsearch now supports dense vector search using maximum inner product (MIPS). This option is added to the other supported vector similarity options (Euclidian, Manhattan, Dot Product, and Cosine). Maximum inner product is required for some vector search models, and in particular for some of those used for generative AI and RAG applications that have become a popular use case for using Elasticsearch in recent months.
Sparse vector data type
Elasticsearch now supports a sparse_vector data type, which can be used by the ELSER model. While it is not materially different from the rank_features data type that ELSER has been using so far, the use case is important, popular, and different enough to merit its own data type. If nothing else, it makes it easier to understand that way.
Exists query for sparse vectors
The Exists query returns the documents that have a particular value in a field. The Exists query has been enhanced to include sparse vectors. This is yet another example of how the envelope of services around the actual vector search is just as important in practice as the search itself. We found that users sometimes ingest docs using the ELSER model and then want to rerun only a small portion of the docs that do not have a populated sparse vector. The Exists query would be handy for that.
Persian language stemmer
Users can perform language analysis using the language analyzer plugins that Elasticsearch supports. It is however easier if Elasticsearch already comes with the plugin, and for that reason we have added support for the Persian language stemmer analyzer plugin.
Dense vector field types are indexed by default
We are taking action to make the use of dense vector search simpler and easier. As part of that we have made dense vector fields indexed by default. It is yet another operation that an administrator needs to do, which we can eliminate, since it is rare that vectors do not need to be indexed. Additionally, we will now dynamically choose the correct number of dimensions based on the first vector indexed. Less configuration, less hassle. Of course, experts can still avail themselves of the full suite of pre-existing options.
Try it out
Read about these capabilities and more in the release notes.
Existing Elastic Cloud customers can access many of these features directly from the Elastic Cloud console. Not taking advantage of Elastic on cloud? Start a free trial.
The release and timing of any features or functionality described in this post remain at Elastic's sole discretion. Any features or functionality not currently available may not be delivered on time or at all.
Share
- Share on Twitter
Share on Twitter
- Share on LinkedIn
Share on LinkedIn
- Share on Facebook
Share on Facebook
- Share by Email
Share by Email
- Print this page
Print