Elastic Observability 7.16: Ad hoc analytics and CI/CD pipeline visibility


 Share on Twitter
Share on Twitter

 Share on LinkedIn
Share on LinkedIn

 Share on Facebook
Share on Facebook

 Share by Email
Share by Email

 Print this page
Print
Elastic Observability 7.16 introduces curated data exploration views for ad hoc analysis and further extends visibility into complex and distributed systems with the general availability (GA) of dozens of prebuilt Elastic Agent data integrations, observability tooling for continuous integration and continuous delivery (CI/CD) pipelines, and a new native data source integration with Amazon Web Services (AWS) FireLens.
These new features allow customers to:
- Conduct ad hoc investigations to analyze “unknown unknowns” for observability
- Frictionlessly ingest data from complex, cloud-native environments
- Build and deploy faster and automate more reliably with visibility into CI/CD pipelines
Elastic Observability 7.16 is available now on Elastic Cloud — the only hosted Elasticsearch offering to include all of the new features in this latest release. You can also download the Elastic Stack and our cloud orchestration products, Elastic Cloud Enterprise and Elastic Cloud for Kubernetes, for a self-managed experience.
Uncover trends, investigate intermittent issues, and accelerate troubleshooting with curated data exploration views
In today's complex and distributed environments, SRE and DevOps teams need the ability to analyze “unknown unknowns” — scenarios where premade dashboards or canned machine learning jobs can’t solve the problems. For instance, they may need to conduct ad hoc investigations or test hypotheses regarding performance optimization and related investments.
The GA of data exploration views for real user monitoring, synthetics, and Mobile APM allows users to identify, visualize, and investigate any problems in the front end, such as unoptimized images and JavaScript errors. These curated views provide powerful ad hoc analytics for visualizing and overlaying multiple dimensions of data — with full control over filtering and how the data is broken down, without the need to know anything about index patterns or field names, removing the cognitive load and complexity of analyzing different time periods, cohorts, and data types.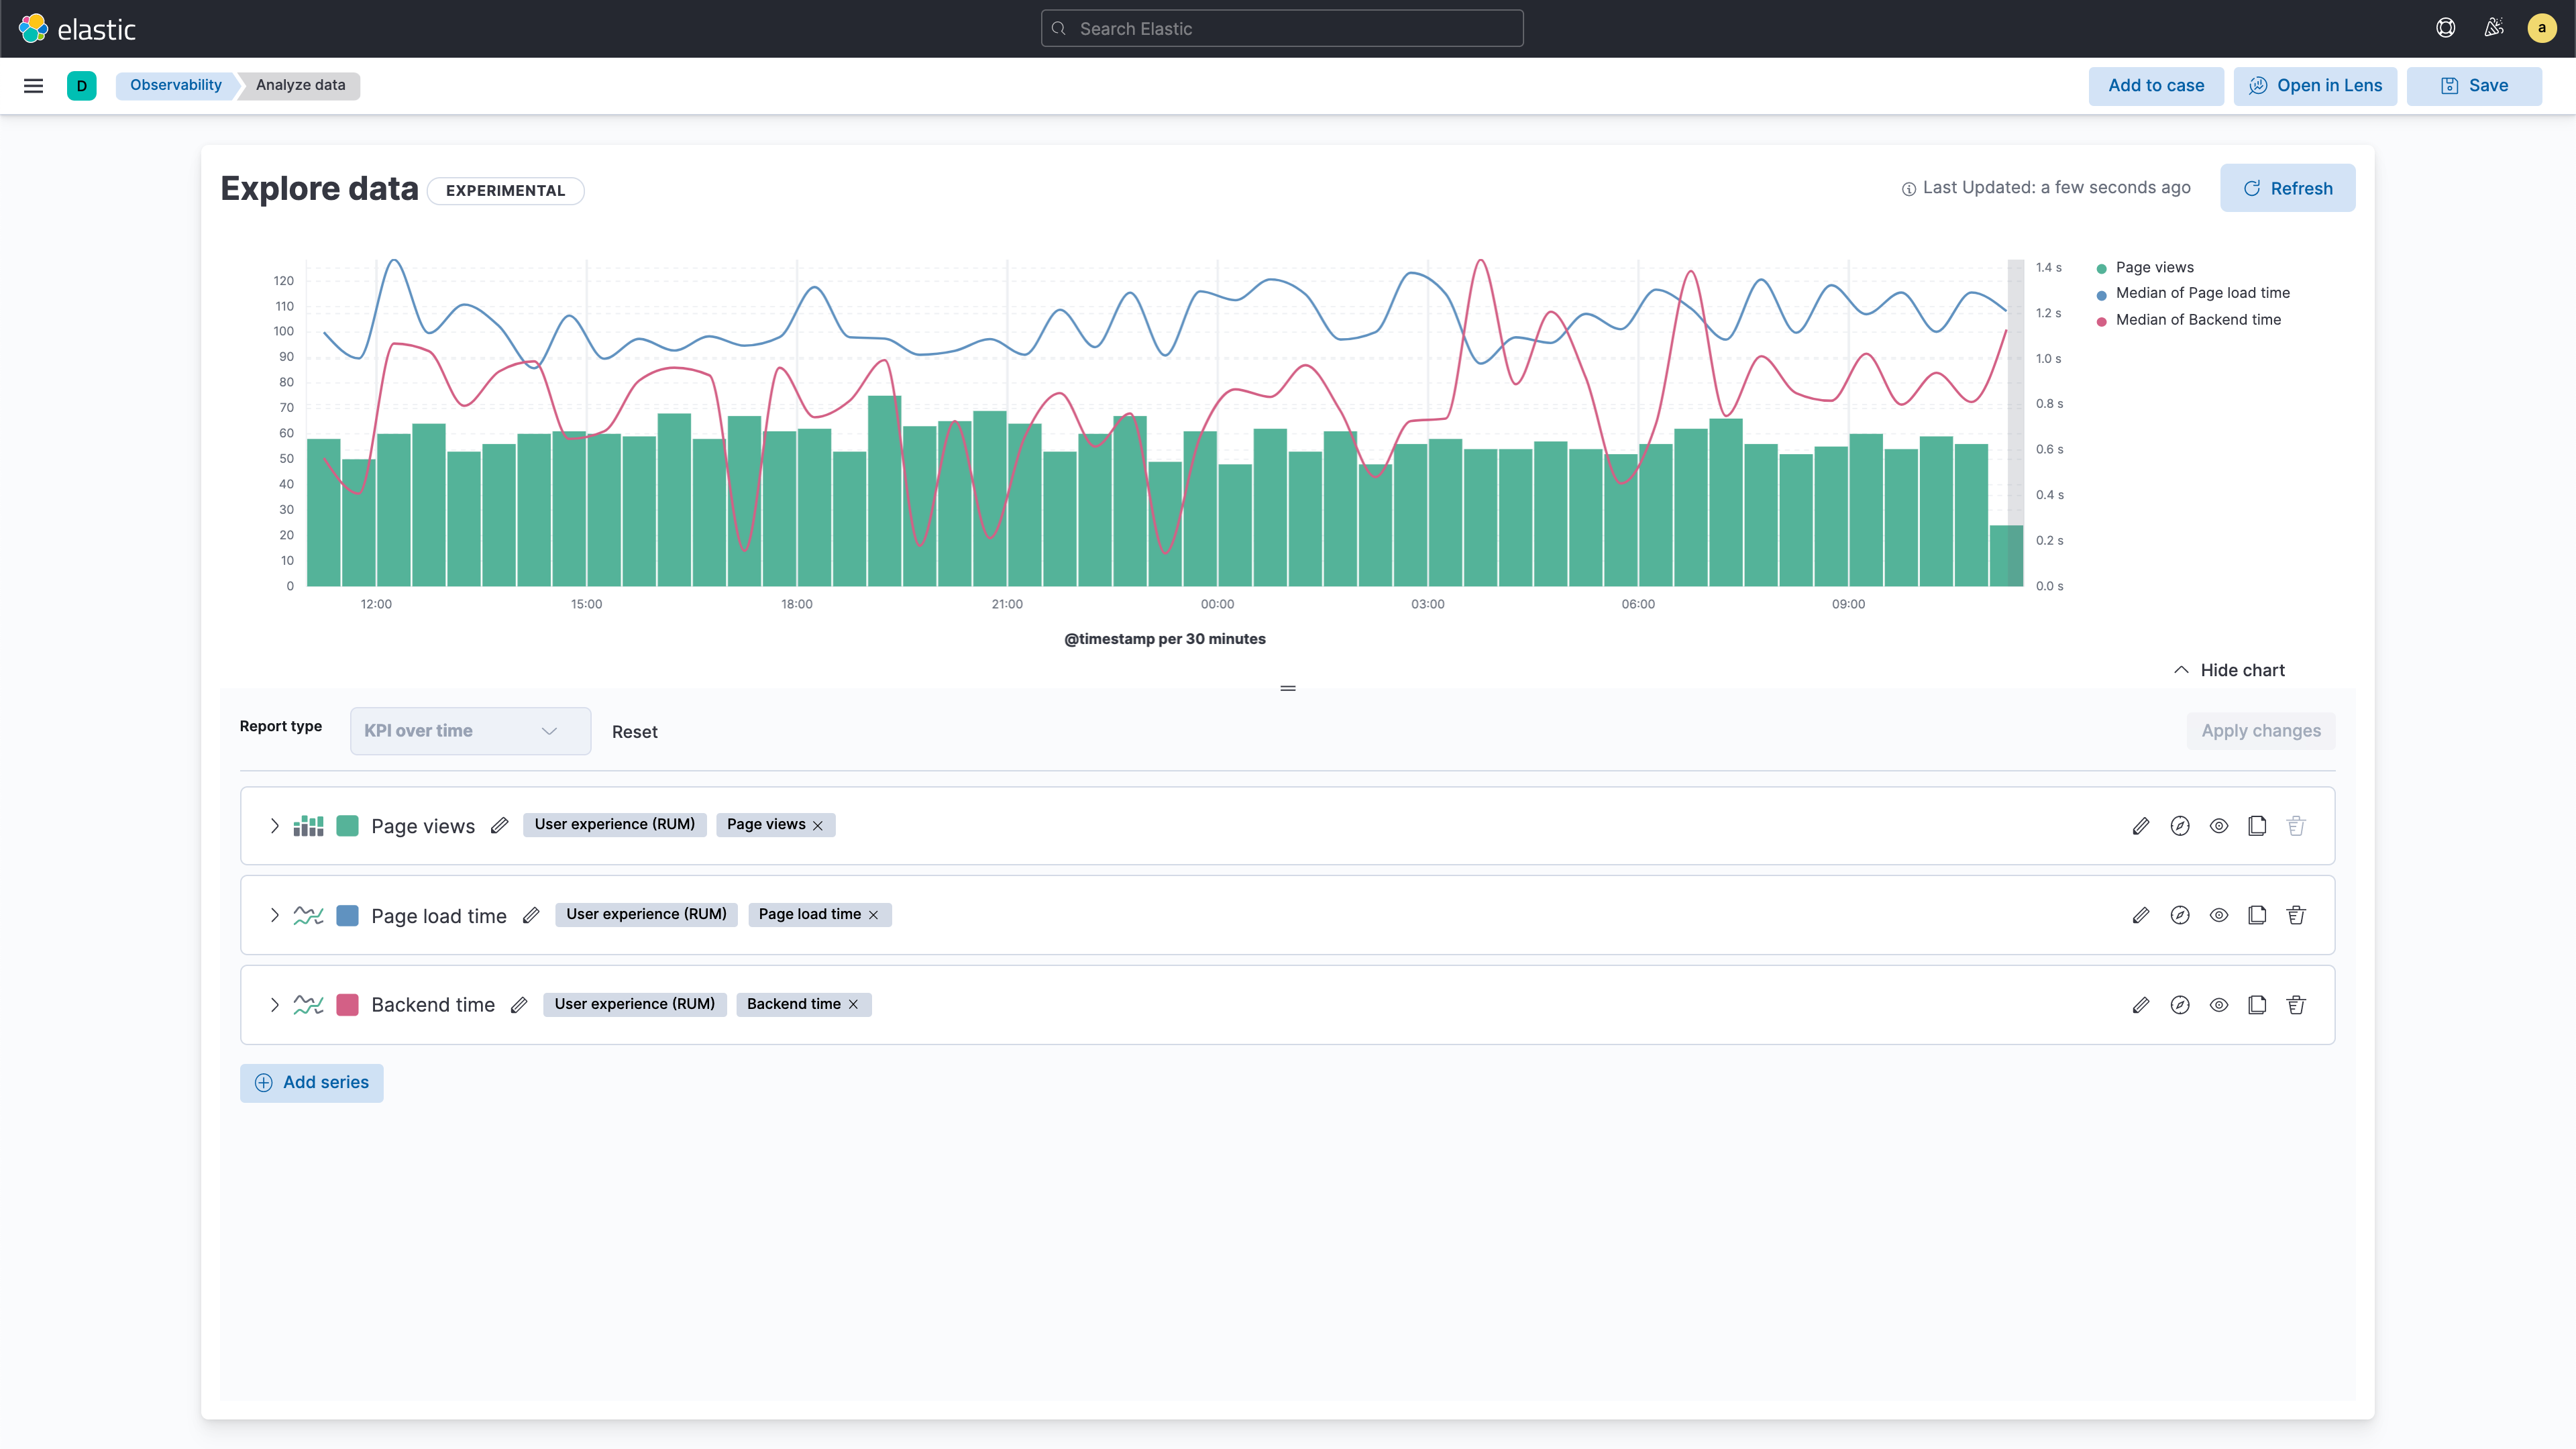
Streamline data ingestion with the new agentless AWS FireLens integration
We are also excited to announce the first native integrations with Amazon Web Services (AWS) on Elastic Cloud via AWS FireLens — a container log router for Amazon EC2 and AWS Fargate. Customers can now quickly and easily ingest container logs into Elastic Cloud within seconds using FireLens and Fluent Bit without needing to install and manage standalone data shippers. They also benefit from a simplified data architecture, allowing them to reduce operational complexities.
Get visibility into CI/CD build automation and deployment
Modern agile development processes and CI/CD automation have enabled software development teams to build and ship releases quickly, accelerating innovation and time to market. But without insight into the performance of their build, test, and deployment pipelines, application teams are vulnerable to development outages that can delay release cycles and impact the bottom line.
Elastic Observability provides key pipeline insights for monitoring, alerting, and troubleshooting of issues — such as error-prone jobs, slow builds, or flaky tests — during the entire software development lifecycle (SDLC). With Elastic 7.16, customers can now get even more granular CI/CD pipeline visibility with OpenTelemetry integrations for Ansible and Maven (technical preview), in addition to our existing plugin for Jenkins pipeline observability. These tools are widely used by DevOps, SRE, and development teams for automating the development pipeline: If these tools fail, the pipeline fails.
The new integrations for Ansible and Maven deliver deeper visibility into job execution and deployment errors for troubleshooting, optimization, and documentation purposes, enabling release teams to operate faster and automate more reliably. They provide comprehensive visibility into all Ansible playbooks and Maven builds, generating traces for each run, and performance metrics to help teams understand:
- Which Ansible tasks or Maven goals are run the most
- How often they fail
- How long they take to complete
As part of Elastic’s commitment to all things free and open, we have contributed these open standards-based CI/CD integrations to the Ansible, Jenkins, and OpenTelemetry communities.
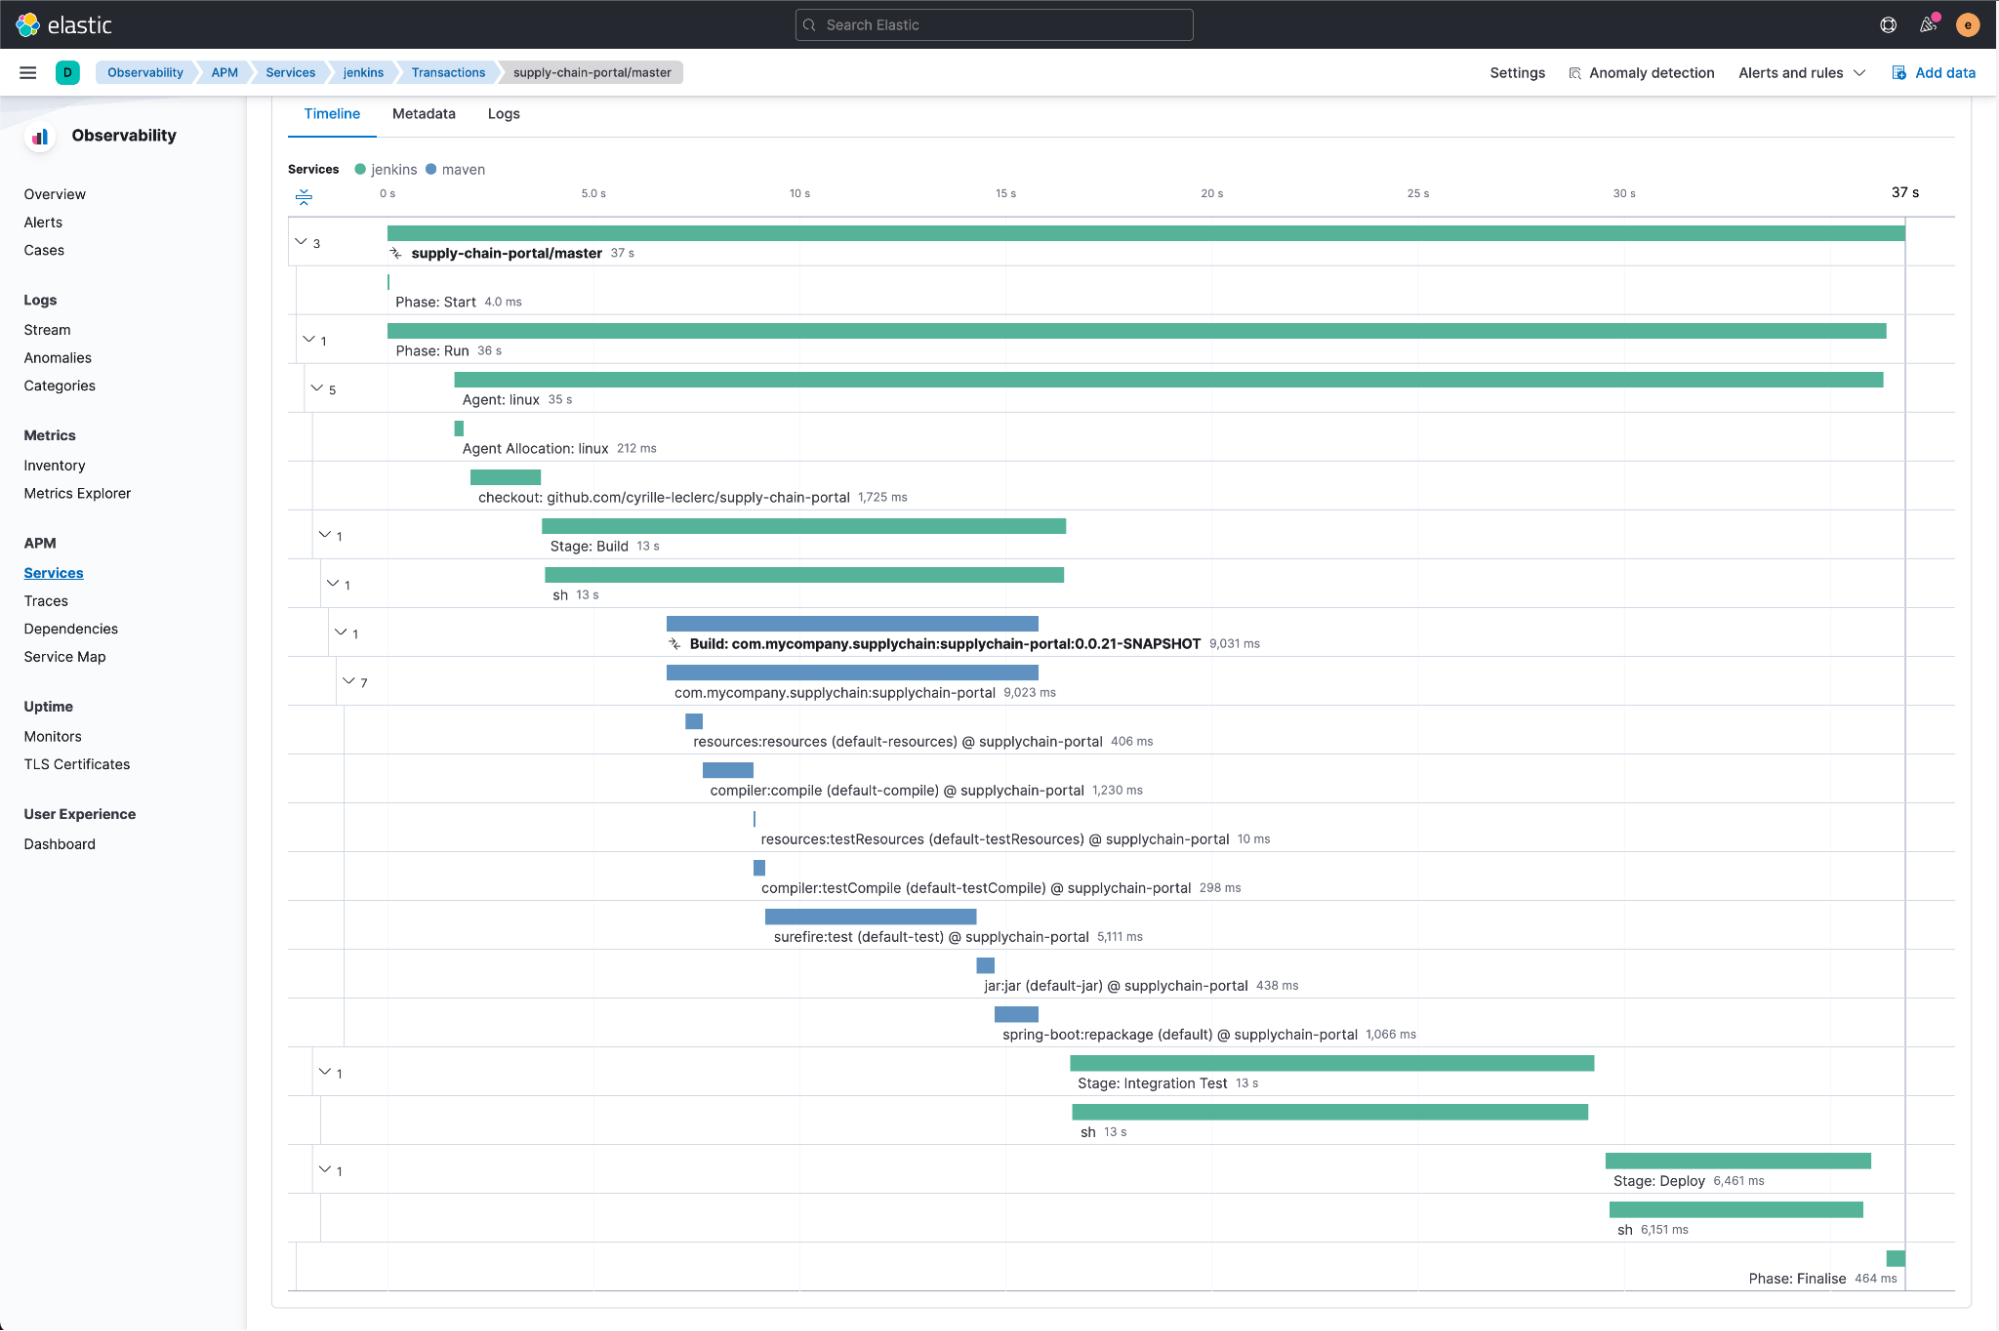
Elastic’s CI/CD observability is easy to implement as pipelines and traditional jobs are instrumented automatically without the need to modify existing scripts. Pipeline executions are intuitively visualized as distributed traces with the capability to analyze pipeline steps across any dimension to assess the nature and impact of the outage. Troubleshooters can further drill into the trace to identify the source of errors and slowdowns.
CI/CD administrators can also view health, errors, and performance metrics by pipeline, and drill down to understand its performance over time. This enables them to quickly assess the impact of issues: from the impact on just one pipeline to much broader outages impacting many pipelines, if not the entire CI/CD platform.
Unify and scale observability with one-click integrations across complex, cloud-native infrastructure
Telemetry from infrastructure, applications, and user devices powers multiple use cases related to the delivery of exceptional and secure customer experience. Elastic Agent enables the collection of logs, metrics, traces, availability, and security data in a seamless and unified way.
With the 7.16 release of Elastic Observability:
- Customers can now start leveraging the centralized management, scalability, security, and one-click integrations of the unified Elastic Agent across web, datastores, middleware, edge, and cloud-native infrastructure, covering the majority of observability use cases currently supported by Beats, including: Amazon Web Services (AWS), Apache, Docker, Google Cloud Platform (GCP), Kubernetes, MongoDB, MySQL, NATS, Nginx, Nginx Ingress Controller, Postgres, RabbitMQ, Redis, STAN, Tomcat, Traefik, and Zookeeper. Plus many more integrations for security use cases as well, all on a single platform.
- Customers can collect and store data in indices that are more granular and require fewer fields per index, resulting in better organized data and faster search performance.
- A new app in Kibana introduces a unified integrations view making it easier to discover all Elastic integrations and onboard data with one click. In addition, customers can reduce wasted storage and improve installation speed by installing only the integration components they need.
The APM Server integration for Elastic Agent and Fleet is now GA, providing an easier way to set up Elastic clusters to support APM use cases. This integration is a step towards better management of all monitoring components using Fleet.
Power collaboration across your workforce with Elastic and ServiceNow
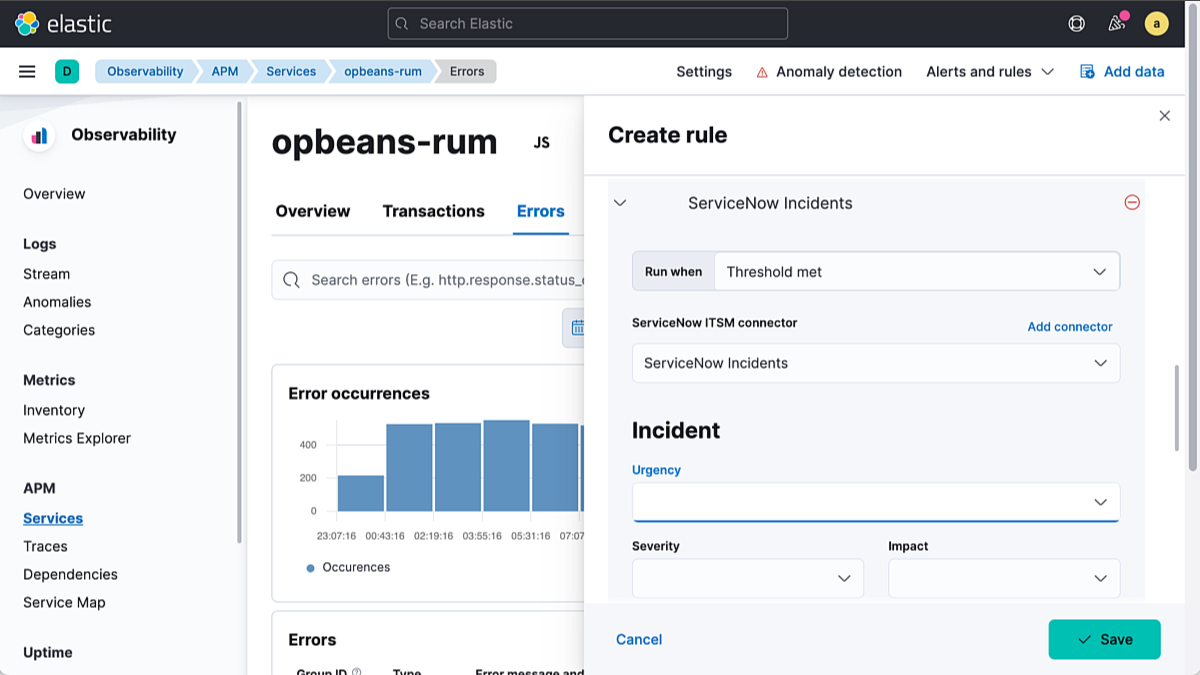
By integrating Elastic Observability with ServiceNow, users can standardize and streamline incident management workflows to facilitate robust collaboration within and across ITOps and DevOps teams.
This is now easier than ever, thanks to newly certified apps on the ServiceNow Store for the ITSM, Security Incident Response (SIR), and ITOM workflow products. Upon connecting with one or more of these apps, Elastic users have two ways to automate the generation of incidents:
- Case management integration (in technical preview for Observability) enables practitioners to escalate Elastic cases — including case details, data observables, analyst notes, and associated alarms — into ServiceNow incidents with just one click.
- Alerting integration enables admins to configure forwarding of individual Elastic alerts to ServiceNow and automate the creation of corresponding ServiceNow incidents.
View span events in OpenTelemetry traces, plus more APM enhancements
OpenTelemetry span events are now available in Elastic APM traces. Span events (distinct from spans) are structured logs that execute too fast to be worth capturing in a traditional span, but are nevertheless important to record, such as an exception thrown by a program. Customers can now view these exceptions and events attached to OpenTelemetry traces for greater application troubleshooting insight.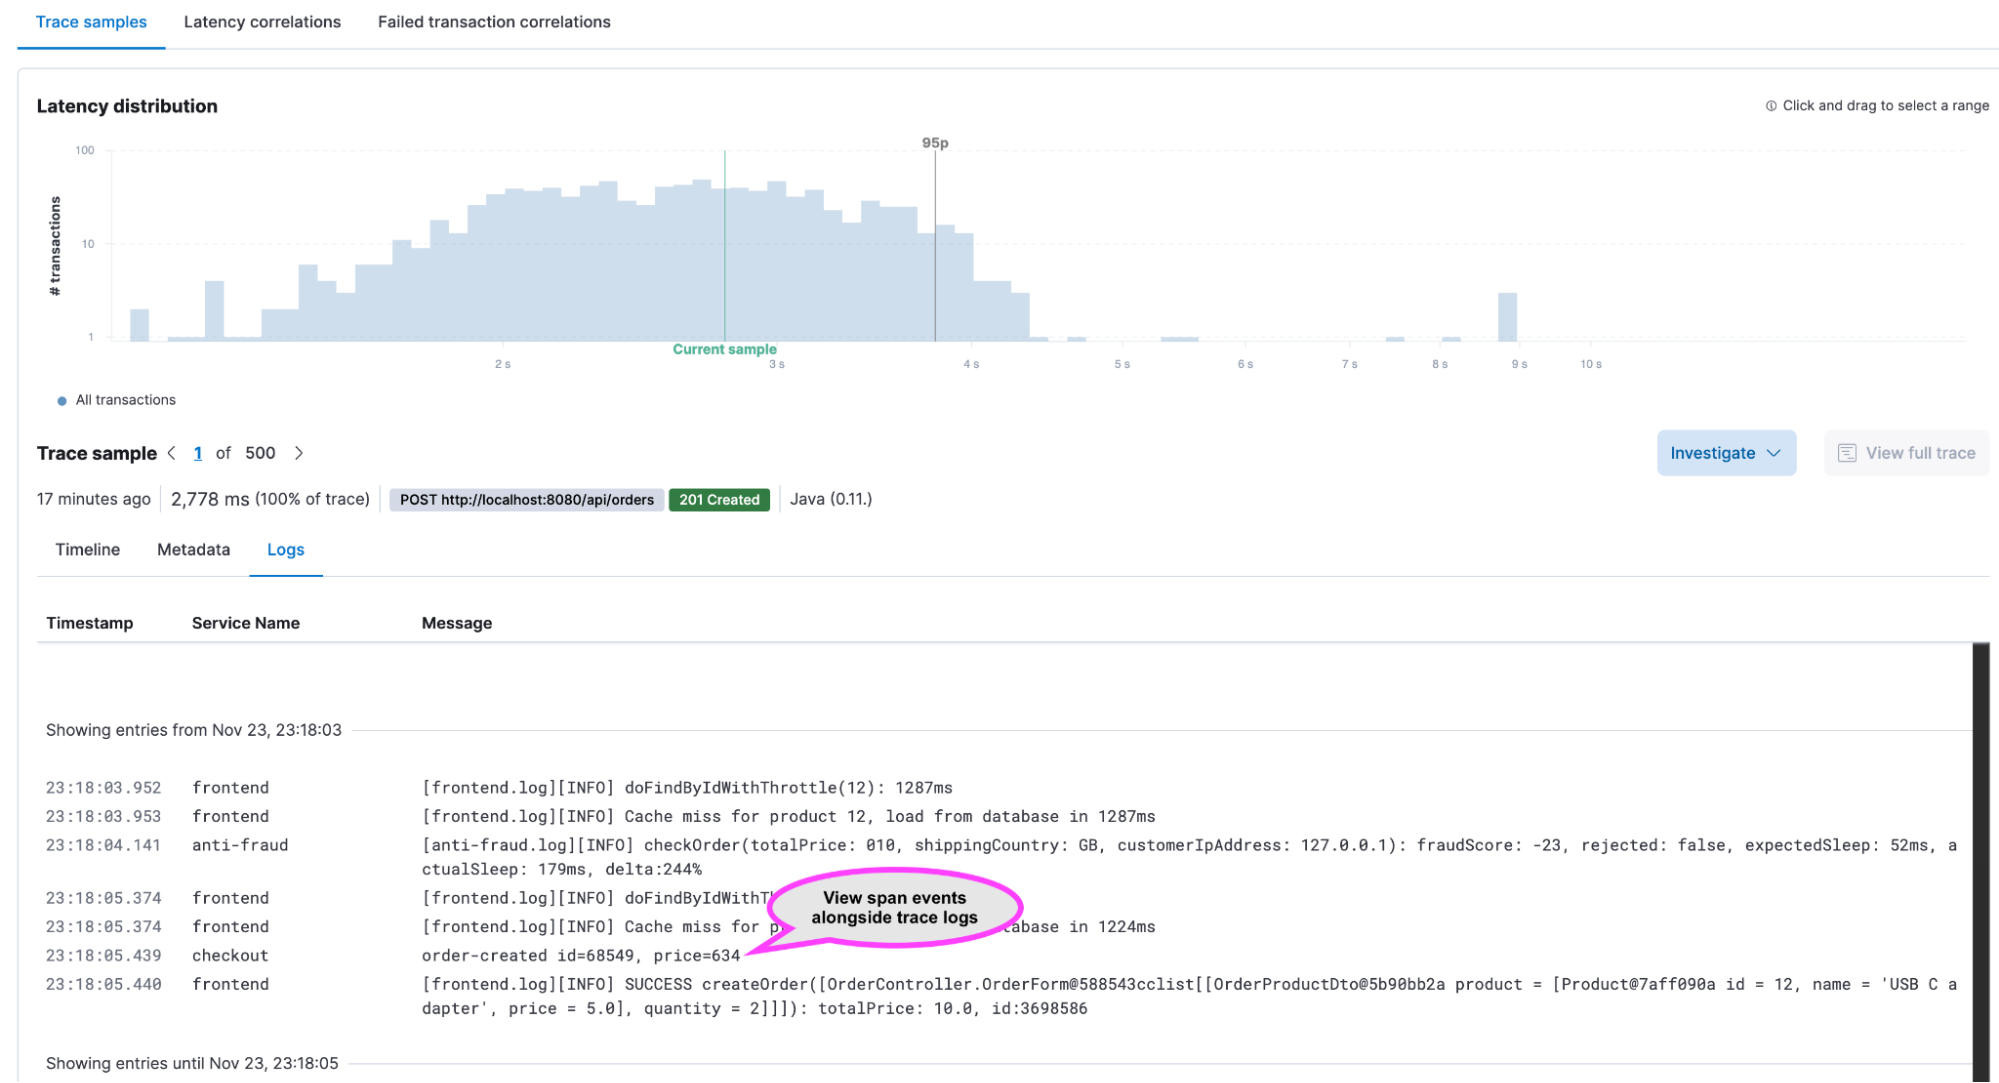
In addition to transaction latency correlation, transaction failure correlation is now also generally available, allowing users to correlate whether or not slow latency is caused by failures. Platinum users can additionally apply automated correlations to failed transactions to understand whether the failures are related to a specific subset of transactions.
We have also added GA support for .NET 6 and released a beta version of auto-instrumentation of .NET applications. Advantages of auto-instrumentation include:
- No code changes required
- Works with .NET Framework, .NET Core, and .NET 5
- Instruments many more frameworks including ADO.NET, RabbitMQ, and Kafka
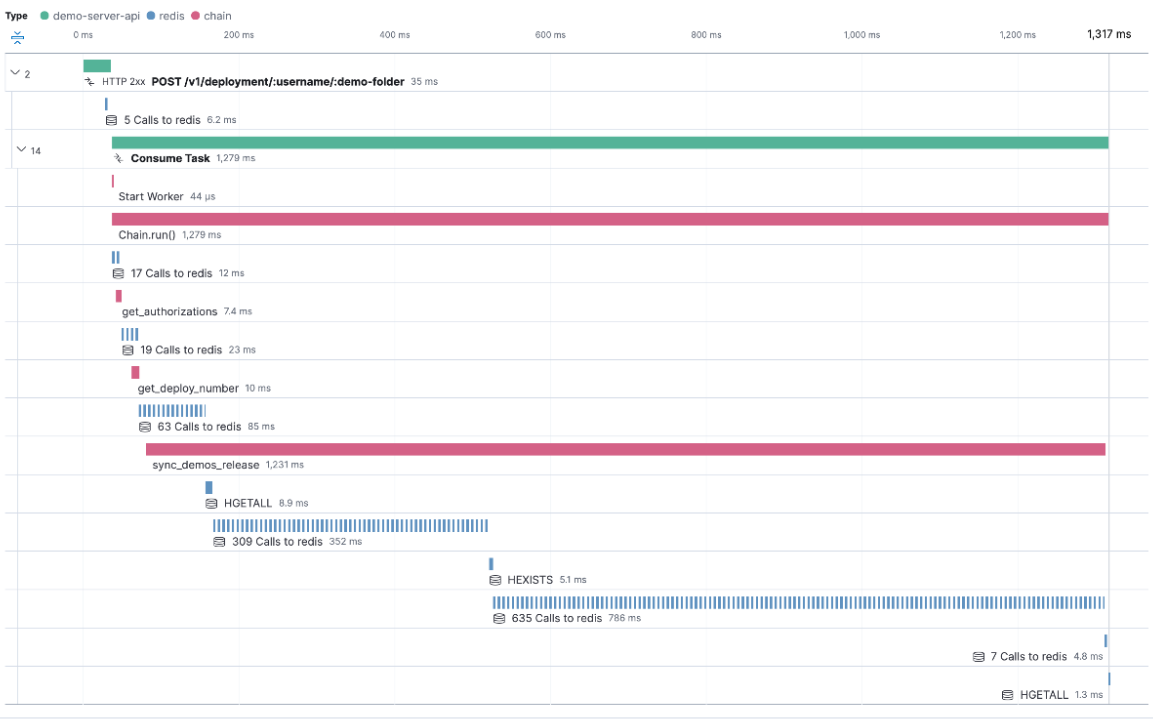
With our new compressed spans capability (in technical preview), customers can now optimize network transfer and storage costs by efficiently capturing and visualizing spans from data-intensive applications. For example, one of the biggest sources of excessive data collection are n+1 type queries and repetitive requests to a cache server or database on the backend. To mitigate the potential flood of spans to a backend, spans are collapsed into a single composite span and displayed with summarized context within the trace. This technical preview feature is currently available for Go, Python, and Ruby agents.
Also available in technical preview is the ability to natively monitor AWS Lambda using Elastic APM agents. This early version delivers end-to-end distributed tracing for Python and Node.js.
Track and investigate alerts through a unified view
New unified views for Observability alerts and cases are now available in technical preview. Customers can now see and track all alerts from a single alerts view. The cases view provides a workflow for investigating and collaborating on alerts. In addition, inline alert annotations within the APM Service Overview provide an enriched context for ready reference supporting troubleshooting and tracking.
Try Elastic Observability
Existing Elastic Cloud customers can access many of these features directly from the Elastic Cloud console. If you’re new to Elastic Cloud, take a look at our Quick Start guides (bite-sized training videos to get you started quickly) or our free fundamentals training courses. You can always get started for free with a free 14-day trial of Elastic Cloud. Or download the self-managed version of the Elastic Stack for free.
Read about these capabilities and more in the Elastic Observability 7.16 release notes, and other Elastic Stack highlights in the Elastic 7.16 announcement post.
The release and timing of any features or functionality described in this post remain at Elastic's sole discretion. Any features or functionality not currently available may not be delivered on time or at all.
Share
- Share on Twitter
Share on Twitter
- Share on LinkedIn
Share on LinkedIn
- Share on Facebook
Share on Facebook
- Share by Email
Share by Email
- Print this page
Print