Using the Elastic Stack for observability of Mulesoft CloudHub
Mulesoft CloudHub stats and metrics in a Kibana dashboardContinuing with the Observability series of MuleSoft components (part 1 was about using Elastic APM with Mule), I want to elaborate on how Elastic Stack can be used to provide visibility and longer-term data retention for Mule workers and APIs running in CloudHub. The main benefit in using Elastic for this is the ability to easily unify the logs and metrics from CloudHub with all other monitoring data produced by the rest of IT applications and infrastructure. Doing this helps reduce the number of monitoring systems and UIs that developers and support have to rely on, allows easy visualisation of CloudHub data alongside data from other components of organisation IT landscape, and creates more sophisticated alerting on CloudHub data combined with data from other sources.
What are Mule and CloudHub?
Mule is a lightweight application integration and API management tool suite. CloudHub is an integration Platform as a Service (iPaaS) environment, dedicated to running and managing Mule components and the APIs they expose. CloudHub can be seen as somewhat “serverless” environment. End users don’t need to provision their own servers and infrastructure to run Mule workers and APIs, but some of the usual attributes of serverless computing are missing, such as out of the box autoscaling.
Why Elastic?
The out-of-the-box monitoring in CloudHub allows storing logs, worker, and API metrics for a limited period of time. Additionally, the monitoring and alerting in CloudHub is done using its own separate interface that introduces yet another UI to the busy lives of Mule developers and support. Organisations that already standardised on or are wishing to get started with Elastic Stack can leverage the setup in this article to add CloudHub monitoring data to their other components monitored by Elastic. Once in Elastic Stack, the data can also be used to drive real-time Canvas dashboards, machine learning generated alerts and more comprehensive dashboarding capabilities in Kibana.
Elasticsearch Service on Elastic Cloud is also a great option for this setup since running Mule workers in CloudHub doesn’t require infrastructure. Elastic Cloud allows running Elasticsearch and Kibana without having to provision additional hardware. The Logstash component that is used in this setup will need a place to run, which can be either done on one of the available servers, or as a Docker container in cloud services, such as ECS or GCE.
Setting up Mule observability
Pictures are worth a thousand words, so I will illustrate the setup with the following diagram:
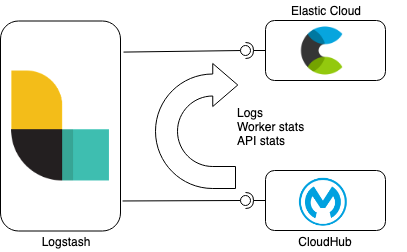
Data synchronisation with Elasticsearch and Logstash
Logstash in this setup is performing data synchronisation between CloudHub and Elasticsearch Service. CoudHub APIs are used in this example to log in, retrieve the required information about the environment, Mule workers and APIs and getting at the end to retrieve the data (logs, API and worker stats) associated with the monitored entities. The synchronisation is done in batches and is tracked using timestamp watermark stored in Elasticsearch.
Code
The code can be found in the following public GitHub repo. Needless to say, you are free to modify the code as you see fit. Get the code:
$ git clone https://github.com/michaelhyatt/elastic-cloudhub-observability
Running Logstash
After downloading and installing Logstash, add the following plugins:
$ cd logstash-7.3.1
$ bin/logstash-plugin install logstash-filter-prune
$ bin/logstash-plugin install logstash-filter-http
$ bin/logstash-plugin install logstash-filter-split
$ bin/logstash-plugin install logstash-filter-geoip
I built this example with Logstash version 7.3.1. It relies on a few environment variables, come for the CloudHub settings (CH_), including environment, username, and password, and Elasticsearch settings (ES_), for the URL, username, and password. An additional variable is used to control the batch size of the log lines to be synchronised with Elasticsearch:
$ cd elastic-cloudhub-observability
$ ES_USER=elastic \
ES_HOST=https://eshost:9200 \
ES_PASS=espass \
CH_USER=cloudhubuser \
CH_PASSWORD=cloudhubpassword \
CH_ENV=Production \
NUM_LOG_LINES=300 \
../logstash-7.3.1/bin/logstash --path.settings $PWD/logstash/config
Detailed design of Logstash pipelines
The logstash configuration is set up to work with pipelines. Pipelines in Logstash are a good way to achieve reuse of configuration fragments to avoid copy/pasting the same code into different places. In our case, the config consists of 4 pipelines defined in pipelines.yml file:
- pipeline.id: login
  path.config: logstash/login.conf
...
- pipeline.id: logs
  path.config: logstash/get_cloudhub_app_logs.conf
...
- pipeline.id: api-events
  path.config: logstash/get_api_events.conf
...
- pipeline.id: worker-stats
  path.config: logstash/get_worker_stats.conf
...
All the pipelines are designed to work with only one worker thread to avoid data duplication in Elasticsearch. This is a graphical representation of how different pipelines interact:
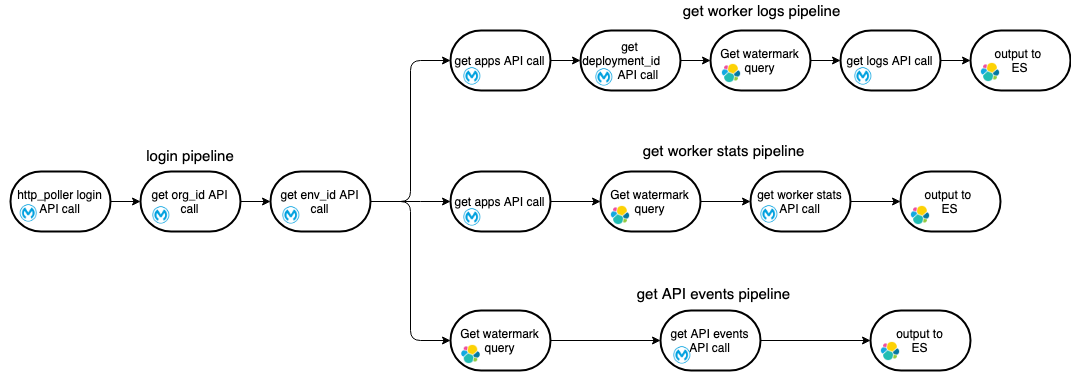
Login pipeline
Login pipeline is the one being reused for the other three It provides a login event that kicks off the other pipelines, since the API call sequence in all the three cases for logs, worker metrics, and API events always begins with the “login” and “get environments” API calls. It is implemented using Logstash HTTP poller input plugin which kicks off the entire process chain as per specified interval. If you wish to increase or decrease the sync frequency you can adjust the value, but ensure that the value is large enough to run the entire flow without another iteration starting while the previous one is still in flight:
input {
  http_poller {
    urls => {
      login => {
        method => post
        url => "https://anypoint.mulesoft.com/accounts/login"
        headers => {
          "Content-Type" => "application/x-www-form-urlencoded"
        }
        body => "username=${CH_USER}&password=${CH_PASSWORD}"
     }
    }
    request_timeout => 120
    schedule => { "every" => "60s"}
    codec => "json"
  }
}
At the end of the login pipeline, all the collected data is passed to the downstream pipelines using a pipeline output. Each pipeline is invoked in parallel with the copy of all the data collected by the login pipeline.
output {
  pipeline {
    send_to => ["logs", "api-events", "worker_stats"]
  }
}
Logs sync
Once the logs sync pipeline receives the initial data set from the login pipeline, it continues to orchestrate the calls to CloudHub APIs to eventually retrieve all the worker logs for all the application workers within the given environment. This is how the pipeline is started using the pipeline input config:
input {
  pipeline {
    address => "logs"
  }
}
At a high level, the pipeline orchestrates the following activities:
- Retrieves the information about the applications deployed within the given environment.
- For every application, it retrieves the deployment information that contains the worker info.
- For every worker, it retrieves the latest synchronised
record_idof the logs from Elasticsearch. Thisrecord_idis used as a watermark in the subsequent API call to get the next batch of log records. - Retrieves the next batch of log records from the CloudHub API.
- Stores the new records in Elasticsearch.
Mule workers stats sync
Similar to the logs retrieval pipeline, the Mule worker sync is triggered using the information from the login pipeline. It is then calling CloudHub APIs to eventually retrieve the Mule workers metrics to:
- Retrieve the information about the applications deployed within the given environment.
- For every application, retrieve the latest timestamp of the most recent worker stats/metrics.
- Using the latest timestamp, retrieve the latest batch of the worker stats.
- Store the new records in Elasticsearch.
API events sync
Following the above, the API event sync pipeline also starts with the information provided by the login pipeline and performs the following actions:
- Retrieves the latest timestamp of the API events from Elasticsearch.
- Invokes the API events API on CloudHub using the above timestamp.
- Stores the new API event records in Elasticsearch.
Ingesting Logstash logs and monitoring the data sync
It is important to ensure the Logstash instance synchronising the data is up and running. CloudHub APIs may change over time, infrastructure glitches may occur, and networks can be unstable. All of that can disrupt the data synchronisation, and it is important to monitor the health of the synchronisation itself — especially if you are relying on the synchronised data for alerting. Monitoring Logstash is not covered in the sample code but is pretty simple to achieve. Use Logstash command line switches to make Logstash log into a file so you can use the same Logstash instance to send the Logstash logs to your Elastic cluster, where they can also be stored and monitored. In addition to logging, you can use alerting or machine learning features in Elastic to look out for a low count of logged records to detect Logstash sync not working. I will leave this part to you to work out, but the "Configuring Monitoring for Logstash Nodes" documentation is a good starting point.
Central Logstash pipeline management
A great way to simplify Logstash configuration and management is to use Kibana central Logstash pipeline management. It allows vanilla Logstash instances that are configured only to communicate with Kibana to receive configuration from Kibana instead of loading the configuration from local files. Using central Logstash configuration management simplifies pushing changes out to Logstash directly from Kibana.
Using Kibana to visualise the data
Now that the CloudHub data is synchronised into your Elastic cluster, it can be visualised in Kibana, Canvas, or the Logs app. Sample visualisations are available within Kibana directory in the GitHub repo.
Logs
The CloudHub worker logs are stored in Elasticsearch in an ECS- (Elastic common schema) compatible way. This enables us to use the the Logs app in Kibana to introspect, filter, search, and tail the logs.
Worker stats and metrics
There are visualisations and a sample dashboard available in the app_dashboard.ndjson file in the kibana directory of the sample GitHub repository.
API events
Sample dashboards visualising API event data can be loaded from api_dashboard.ndjson file in the Kibana directory of the sample code GitHub repo.
Give it a try
Now armed with this information, you can get started monitoring your CloudHub services. You can use set up a free trial of the Elasticsearch Service on Elastic Cloud, or download the Elastic Stack.