Observability of MuleSoft: Using Elastic APM to monitor Mule flows
This is the first post in a series about observability of the MuleSoft stack. I am planning to cover additional uses of the Elastic Stack with the MuleSoft stack in the future, including:
- Collecting and searching through Mule logs
- CloudHub observability with Logstash
- Using Canvas for picture-perfect dashboards
Introduction to MuleSoft
Mule has gained popularity in recent years, displacing other ESB and integration technologies. I always explained this phenomenon to myself as its ability to quickly integrate systems and technologies to automate business processes. The result is a simple and lightweight integration layer that doesn’t overburden the user with operational concerns, such as heavy runtime management layers or proprietary communication protocols, like some of the competitors did. Still, when it comes to operating Mule components on premises, in containerised environments, or in CloudHub environments, customers are quite often left to integrate the integration layer (pun intended) with their own bespoke management and monitoring components of variable age and quality. This results in complex distributed environments operating in half-lit conditions, often resulting in support engaging in debugging and solving issues using incomplete information coming from inadequate tools.
This series of posts outlines my own endeavors with observability of the MuleSoft stack using Elastic tools, which in my (biased) opinion results in a very effective solution, delivering a truly seamless single-pane of observability glass for complex Mule and non-Mule component deployments.
A bit about Elastic Stack in general, and APM in particular
The Elastic Stack, or ELK, as many in the industry know it, consists of Elasticsearch, Logstash, Kibana, and more. The Elastic Stack serves a variety of purposes and finds a wide use in logging, monitoring, search, security, analytics, and many other use cases. Newer additions to the Elastic Stack include lightweight data shippers, or Beats, as well as Elastic APM for application performance monitoring. This post is about leveraging the Elastic APM Java Agent integrated with Mule runtime to collect runtime transaction performance and metric data from Mule components. The component that I call the Mule APM agent is of my own creation and is available in a GitHub repo. It is translating execution of Mule flows and processors into related APM Transaction and Span objects using Mule PipelineMessageNotification and MessageProcessorNotification events and listeners. If you are interested in the details, the code is in the repo. Have a look, take it for a spin, and help me improve it.
Setting up the Elastic Stack?
Examples in this post leverage the Elasticsearch Service on Elastic Cloud, which comes with all the features of the Elastic Stack, including machine learning, and is available for a free, 14-day trial. While the cloud is a great way to avoid running and managing servers for the Elastic Stack — you can achieve the same results with self-installed Elastic Stack. APM Server, agents, and the Kibana APM view are completely free to use under OSS and Basic licenses. So choose the deployment model that best suits your project.
How to instrument your Mule 3.x project
First of all, you will need Maven, which you should already have if you are working with Mavenised Mule projects. Download the jar file linked to the latest and greatest release, and install it into your local Maven repo:
mvn install:install-file -Dfile=<path-to-file> -DgroupId=co.elastic.apm \
    -DartifactId=apm-mule3-agent -Dversion=1.6.2 -Dpackaging=jar
Once the jar is installed into the local repo, you should reference the jar as a dependency in your project’s pom.xml file, as shown below. The latest version of the agent at the time of writing is 1.6.2, but make sure you check the GitHub repo for newer releases:
<dependency>
    <groupId>co.elastic.apm</groupId>
    <artifactId>apm-mule3-agent</artifactId>
    <version>1.6.2</version>
</dependency>
Lastly, import the tracer.xml once in your Mule configuration files. Once Mule is started, it will load all the relevant dependencies from tracer.xml and will be ready to trace your Mule flow:
<spring:beans>
    <spring:import resource="classpath:co/elastic/apm/mule/tracer.xml"/>
</spring:beans>
Configuring your Mule project
The agent understands the properties file in exactly the same way Mule does. It uses Elastic Java APM Agent properties, as described in the documentation, with the addition of its own properties to control what is being tracked, as per README.md. Here is an example properties file configuration. Note the section outlining the connection to the APM server deployed as part of Elastic Cloud deployment. As a side note, the Elasticsearch Service comes standard with a 512MB Elastic APM node.
# Elastic Apm Java client properties
elastic.apm.log_level=DEBUG
elastic.apm.instrument=false
elastic.apm.active=true
# APM server running locally
elastic.apm.server_urls=http://localhost:8200
# Or, try APM on Elastic Cloud. Create trial deployment and update the below details
#elastic.apm.server_urls=https://xxxxxxxxxxxxxxxx.apm.ap-northeast-1.aws.cloud.es.io:443
#elastic.apm.secret_token=<secret_key>
elastic.apm.application_packages=
elastic.apm.service_name=component1
elastic.apm.service_version=v1.0.0
elastic.apm.stack_trace_limit=3
elastic.apm.span_frames_min_duration=0ms
# Mule apm specific properties
elastic.apm.mule.capture_input_properties=true
elastic.apm.mule.capture_input_properties_regex=http_(.*)
elastic.apm.mule.capture_output_properties=true
elastic.apm.mule.capture_output_properties_regex=(.*)
Running your instrumented Mule project locally
Start your Mule project normally in Anypoint Studio. If your APM agent is configured properly, it displays the following line in a log file:
[apm-server-healthcheck] INFO co.elastic.apm.agent.report.ApmServerHealthChecker - Elastic APM server is available: {"ok":{"build_date":"2019-04-02T14:55:26Z","build_sha":"5665711544eb3fcb956e7d1c61795e427bf97097","version":"6.7.1"}}
If your agent can’t connect to the APM server, there will be an error message, but the Mule component will load normally. It is a good idea to keep an eye on Mule log for errors.
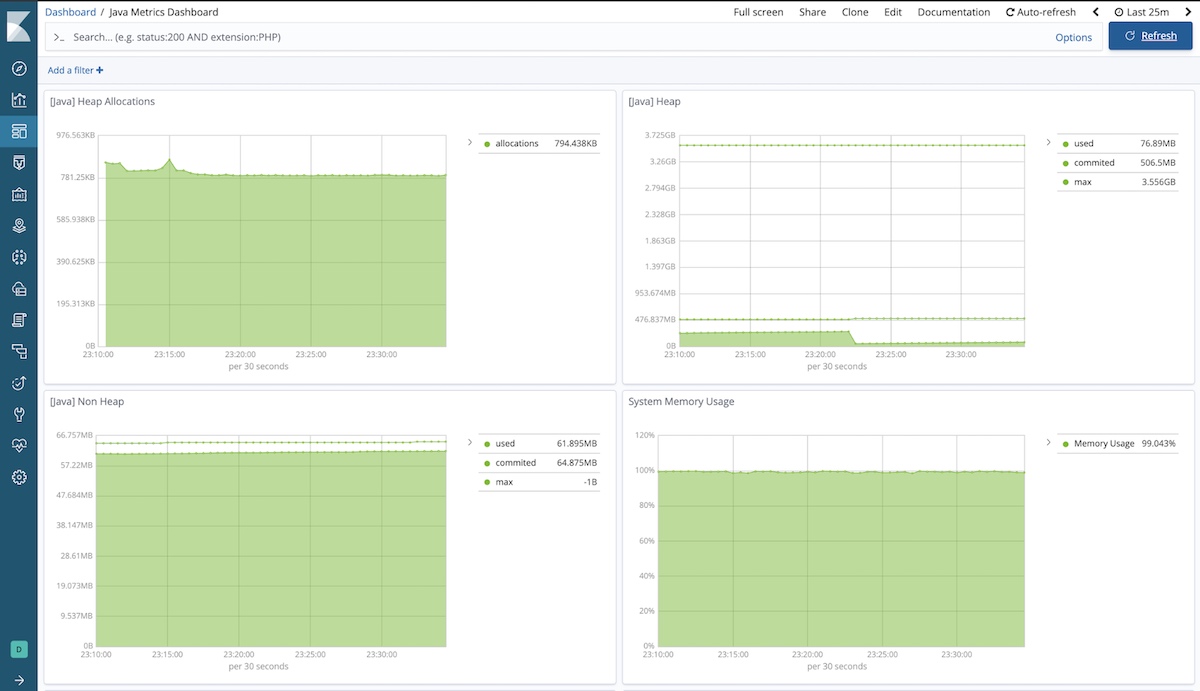
Once the component is up, the corresponding service will be visible in Kibana collecting JVM metrics. And once the component starts processing transactions, you’ll see APM dashboard in Kibana populated with APM services, transactions, and spans. The agent will also send JVM metrics into Elasticsearch that can be visualised in Kibana. Check out the sample dashboards and Canvas deployments in the GitHub repo.
CloudHub deployment
Follow the usual procedure to deploy to CloudHub. Ensure that CloudHub Mule workers are able to communicate to the APM server, and the server is accessible from CloudHub. For security, configure your APM server to use https and configure a secret. Make sure the properties file is up to date with the connection details. By the way, Elastic Cloud–managed APM servers pre-create secrets and are configured to use https.
How to use Mule APM agent in a domain-based project
Mule 3.x supports on-prem deployments of multiple Mule projects into one Mule server that shares certain configurations between them, such as JDBC databases or http listeners. In such cases, the mule-domain-config.xml file can be instrumented with one reference to domain-specific tracer initialisation, so multiple Mule projects deployed as part of a Mule domain don’t have to be instrumented separately. The rest of the prerequisite steps, maven dependency, and property file config for the domain are exactly the same for CloudHub or standalone Mule projects.
<spring:beans>
   <spring:import resource="classpath:co/elastic/apm/mule/domain-tracer.xml" />
</spring:beans>
Please note that different Mule projects deployed into the domain will share the same service name and will only differ by their top-level flow names that will become APM transactions.
Example projects
Please check out these example projects, which include instructions on how to run them:
- example-app — Consists of two components communicating with each other using https and illustrating Elastic APM with distributed tracing. Check out the video below to see how it works.
- example-domain-app — Shows how to instrument Mule domain projects.

Final result
Now, for some eye candy with the data captured by Mule APM agent. First and foremost, the Kibana APM dashboard shows multiple Mule components communicating with each other. This following view is generated by example-app.
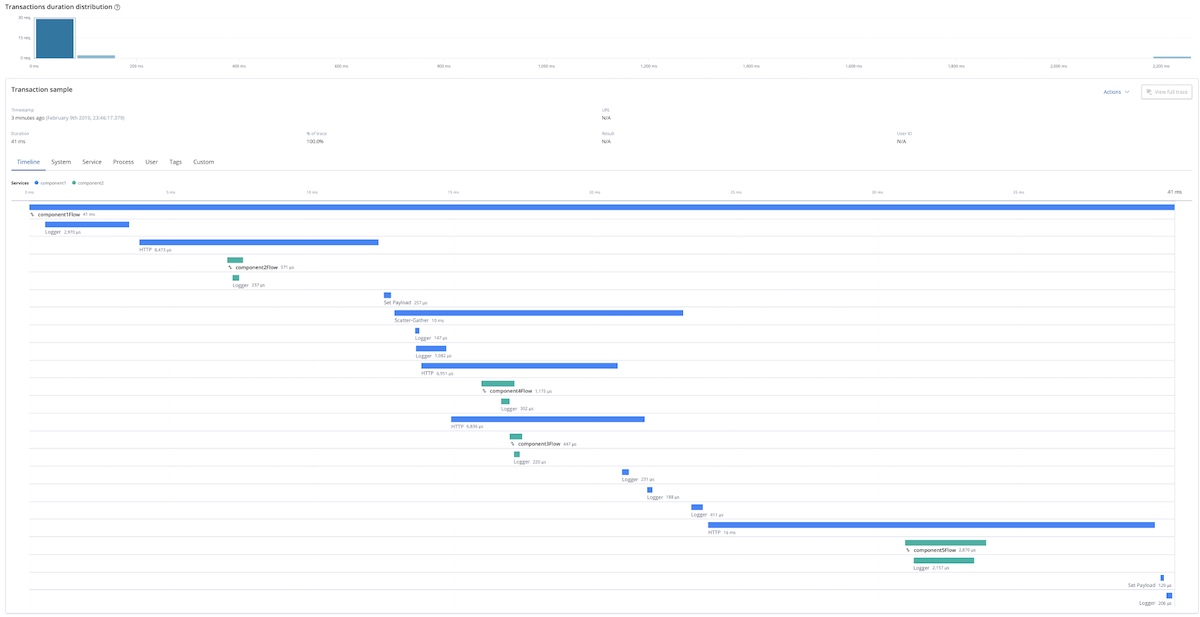
Dashboards
Kibana allows you to create various visualisations from the data kept in Elasticsearch. APM collects latency and duration information for Mule flows and process steps, so it is possible to create various visualisations and dashboards illustrating performance of your Mule components. It also collects main JVM metrics, such as GC stats, CPU, and memory utilisations, so using it to monitor the health of Mule JVM components is quite easy. As a starting point, check out the sample dashboard in the kibana-objs folder of the Mule APM agent repository.
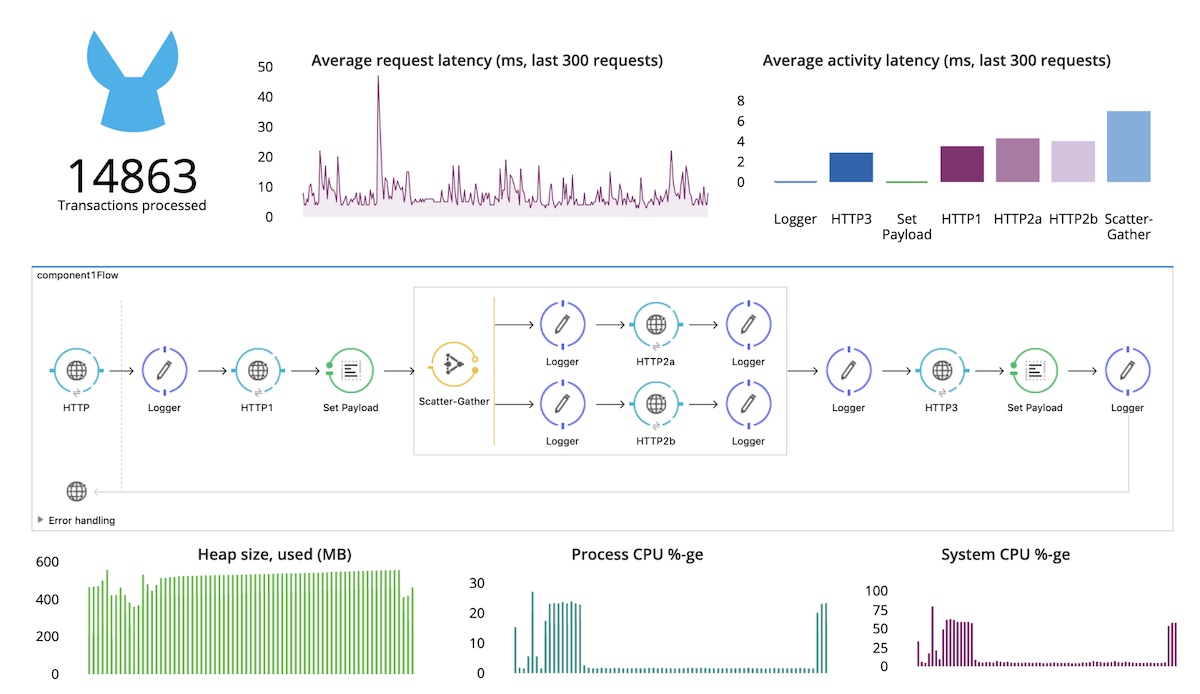
Canvas
While default Kibana visualisations have a lot of structure and a standardised look and feel, Canvas in Kibana allows you to create pixel-perfect infographics driven by live data collected in Elasticsearch. It can be quite handy for creating your own infographics overlaid on top of Mule processes, such as building that Business Activity Monitoring dashboard your boss always wanted:
Machine learning with Mule
Elastic machine learning can really help elevate your monitoring capabilities of Mule (and non-Mule components alike) to a new level, such as the following:
- Alerting on abnormally long execution time of top-level Mule process
- Detecting increasing latency of dependent component responses
- Looking for that new Mule log file entry that was never there before with mlcategory
Until next post...
Ok, that’s it for this post. Stay tuned for more Elastic observability stories for Mule. And while you wait, check out the Mule APM agent and let me know how it works for you. And if you run into any general questions, reach out on our Discuss forums.