Schema on write vs. schema on read
Elastic Stack (or ELK Stack as it’s widely known) is a popular place to store logs.
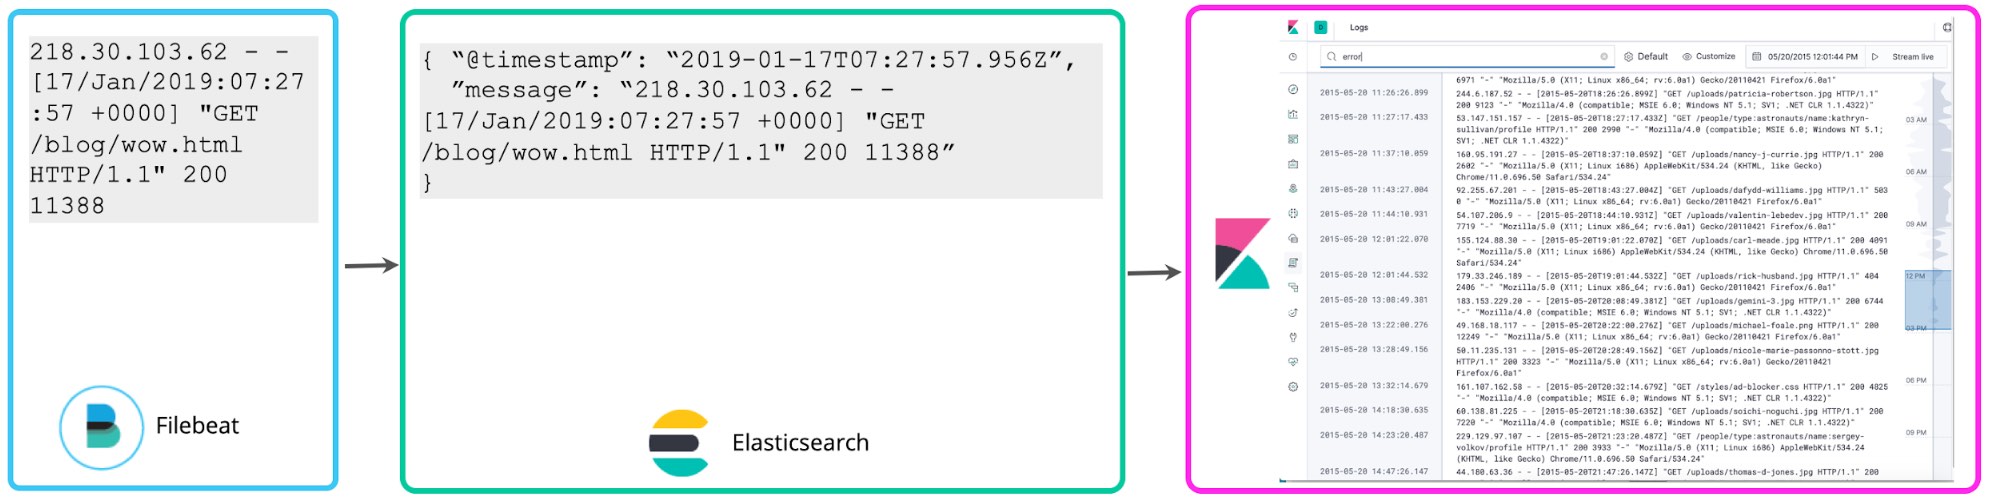
Many users get started by storing logs with no structure beyond parsing out the timestamp and perhaps adding some simple tags for easy filtering. Filebeat does exactly that by default – tails logs and sends them to Elasticsearch as quickly as possible without extracting any additional structure. The Kibana Logs UI also assumes nothing about the structure of the logs — a simple schema of “@timestamp” and “message” is sufficient. We call this the minimal schema approach to logging. It is easier on the disk, but not very useful beyond simple keyword search and tag-based filtering.
Once you’ve gotten acquainted with your logs, you typically want to do more with them. If you notice numbers in logs correlated with status codes, you may want to count them to see how many 5xx level status codes you had in the last hour. Kibana scripted fields allow you to apply schema on top of logs at search time to extract these status codes and perform aggregations, visualizations, and other types of actions on them. This approach to logging is often referred to as schema on read.
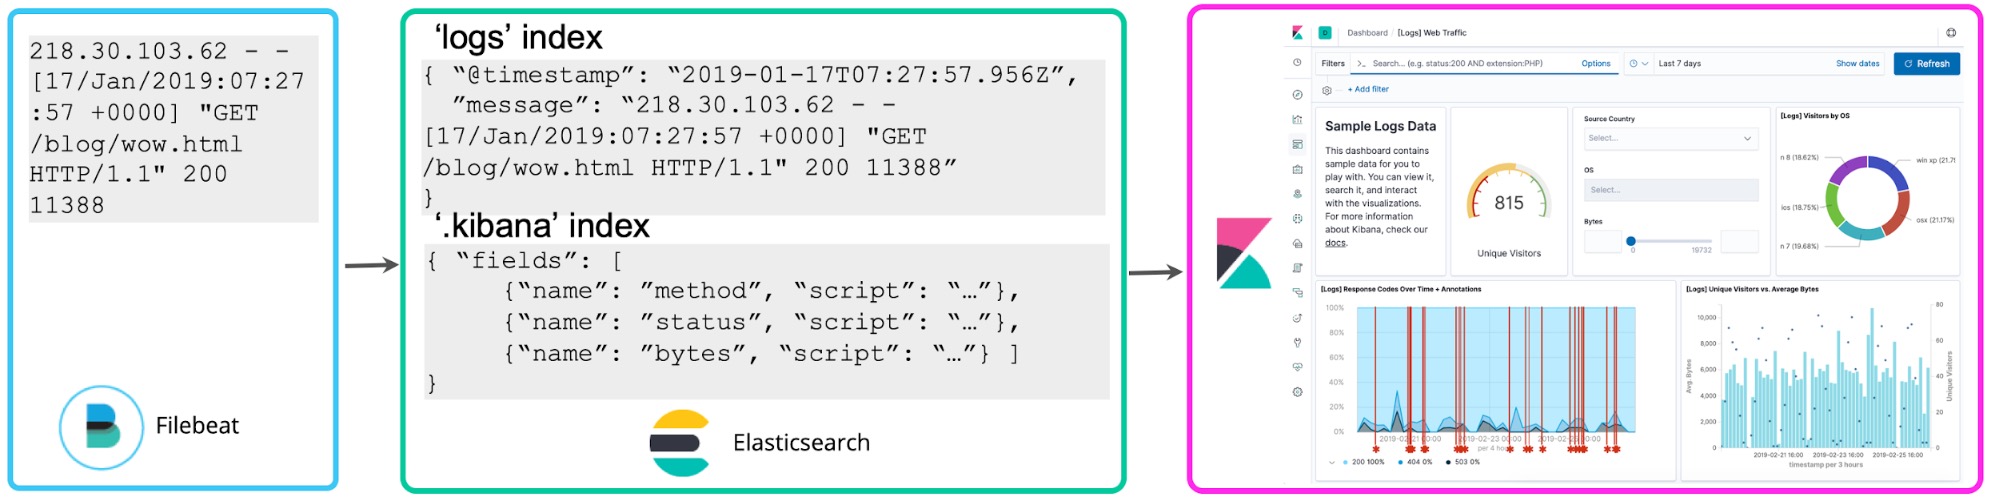
While convenient for ad hoc exploration, the drawback of this approach is that if you adopt it for ongoing reporting and dashboarding, you will be re-running the field extraction every time you execute a search or re-render the visualization. Instead, once you’ve settled on the structured fields you want, a reindex process can be kicked off in the background to “persist” these scripted fields into structured fields in a permanent Elasticsearch index. And for the data streaming into Elasticsearch, you can set up a Logstash or an ingest node pipeline to proactively extract these fields using dissect or grok processors.
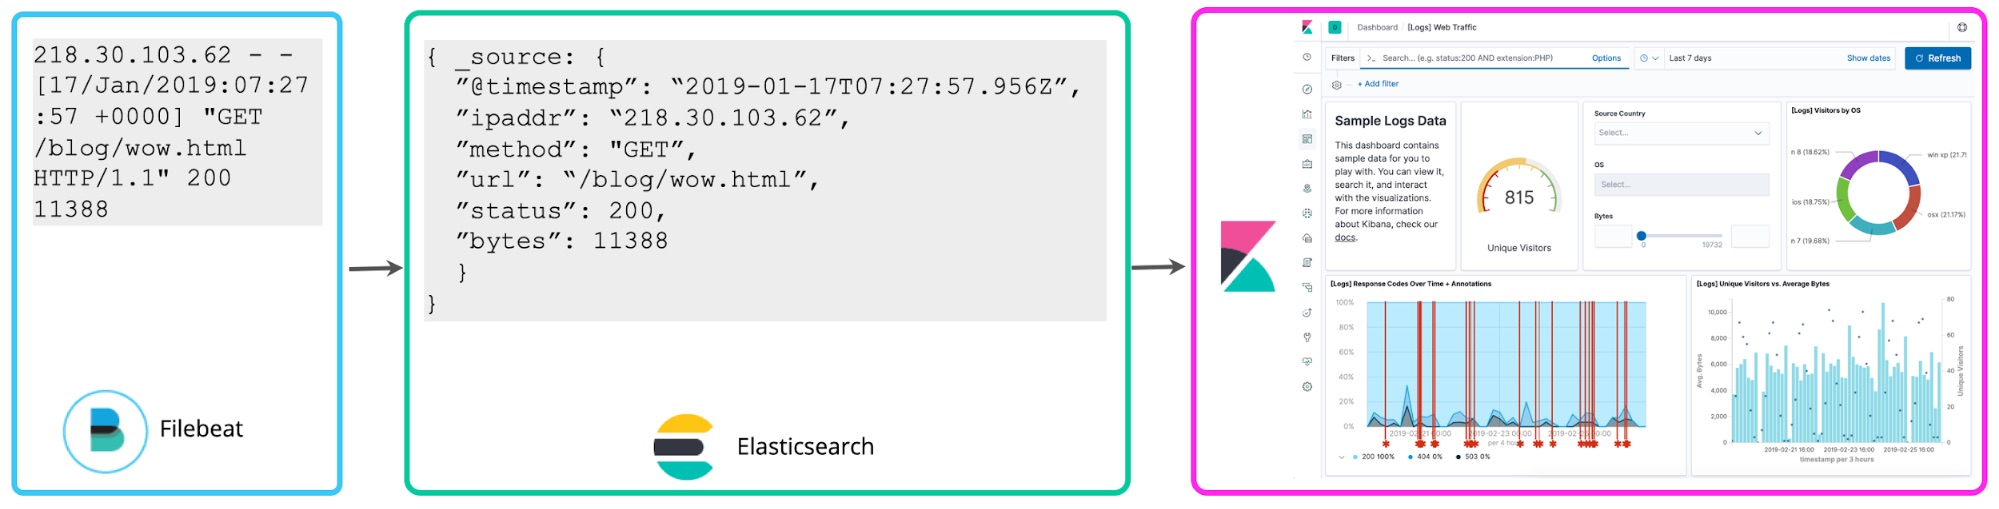
Which brings us to a third approach, which is to parse logs at write time to extract the above-mentioned fields proactively. These structured logs bring a lot of additional value to analysts, removing the requirement for them to figure out how to extract fields after the fact, speeding up their queries, and dramatically increasing the value they get from the log data. This “schema on write” approach to centralized log analytics has been embraced by many ELK users.
In this blog I will go through the trade-offs between these approaches and how to think about it from the planning perspective. I’ll review why structuring logs upfront has intrinsic value, and why I think it is a natural place to evolve to, as your centralized logging deployment matures, even if you start with little structure upfront.
Exploring the benefits of schema on write (and dispelling myths)
Let’s start with why you’d even want to structure logs when you write them to a centralized logging cluster.
Better query experience. When you search logs for valuable information, a natural thing to start with is simply searching for a keyword like “error”. Returning results on a query like that can be accomplished by treating each log line as a document in an inverted index and performing full-text search. However, what happens once you want to ask more complex questions, such as “Give me all log lines where my_field equals to N?” If you don’t have the field my_field defined, you can’t ask this question directly (no auto-complete). And even if you realize your log has this information, you now have to write the parsing rule as part of your query to extract the field in order to compare it to the expected value. In Elastic Stack, when you structure your logs upfront, Kibana autocomplete will automatically suggest fields and values to build your queries. This is a huge boost to analyst productivity! Now, you and your colleagues can ask questions directly, without each of you having to figure out what the fields are and having to write complex parsing rules at search time to extract fields.
Faster historical queries and aggregations. Queries on structured fields in Elastic Stack, even run on large amounts of historical data, will return in milliseconds. Compare that to minutes or hours to return an answer in typical “schema on read” systems. This happens because filtering and running statistical aggregations on structured fields extracted and indexed upfront is much faster than running regex across every log line to extract the field and operate on it mathematically. This is particularly important for ad hoc queries, results of which cannot be accelerated upfront, since you don’t know which queries you’ll be running during the investigation.
Logs to metrics. Related to the point above, the result of extracting numerical values from structured logs looks surprisingly like numerical time-series, or metrics. Running aggregations on top of these valuable data points quickly has tremendous value from an operational perspective. Structured fields allow you to treat numerical data points from logs as metrics at scale.
Truth in time. When you need to resolve fields like IP address to hostname, you need to do so at index time, as opposed to later at query time, because later resolutions may no longer be valid for the earlier transaction -- a week later that IP may be linked to a completely different hostname. This applies to lookups against any external source, which only offers the most recent snapshot of the mapping, such as username resolution against identity management systems, asset tag against CMDB, and so on.
Real time anomaly detection and alerting. Similar to aggregations, real-time anomaly detection and alerting works most efficiently at scale with structured fields. Otherwise, the ongoing processing requirements on your cluster are quite onerous. We speak to many customers that are held back from creating alerts and anomaly detection jobs because extracting fields at search time simply doesn’t scale for the amount of alerting they need. This means the log data they collect is only suitable for largely reactive use cases and limits the return on investment in that project.
Logs in observability initiatives. If you have an observability initiative underway, you know that is is not sufficient to simply collect and search logs. Log data should ideally be correlated with metrics (e.g. resource usage) and application traces to tell an operator a holistic story about what is happening with the service, no matter where data points come from. These correlations work best on structured fields – otherwise the lookups are slow, and the analysis is unusable in practical situations at scale.
Data quality. When your events are subject to upfront processing, you have the opportunity to check for invalid, duplicate, or missing data and correct those problems. If you rely on schema on read, you don’t know if your results are coming back accurate, because validity and completeness of your data has not been verified upfront. This may lead to inaccurate results and incorrect conclusions based on the data coming back.
Granular access control. Applying granular security rules, such as field-level restrictions, on top of unstructured log data is challenging. Filters restricting access to data at search time can help, but they have significant limitations, such as inability to return a partial results consisting of a subset of the fields. In Elastic Stack, field-level security allows users with a lower set of privileges to see some fields and not others across the whole dataset. So protecting PII data in logs while allowing a larger set of users to operate on other information becomes that much easier and more flexible.
Hardware requirements
One common myth about “schema on write” is that it automatically means that your cluster will require more resources to parse the logs and store both the unparsed and parsed (or “indexed”) formats. Let’s examine a few trade-offs you should consider specific to your use case, because the answer is, in fact, “it depends”.
One-time parsing vs ongoing field extraction. Parsing and storing your logs in a structured format does consume processing capacity on the ingest side. However, running repeated queries on top of unstructured logs that execute complex regex statements to extract fields consumes way more RAM and CPU resources on an ongoing basis. If you anticipate that the common use case for your logs is to only service an occasional search, perhaps structuring them upfront is overkill. But if you anticipate that actively querying your logs and running aggregations on top of log data is expected, the one-time cost on ingest may be less onerous than the ongoing cost of re-running the same operations at query time.
Ingest requirements. With additional processing upfront, your ingest throughput may be somewhat lower, compared to what it would be, if you did nothing. You can introduce additional ingest infrastructure to handle that load, by independently scaling your Elasticsearch ingest nodes or Logstash instances. There are good resources and blogs on how to approach this, and if you are using Elasticsearch Service on Elastic Cloud — scaling ingest is as easy as adding more "ingest capable" nodes.
Storage requirements. The truth — as counterintuitive as it may seem — is that storage requirements may actually be lower when you do some work to understand the structure of your logs upfront. Logs can be verbose and noisy. By examining them upfront (even if you don’t fully parse every field), you can decide what log lines and extracted fields to keep online for search in your centralized log cluster and what to archive right away. This approach can reduce the overall disk requirements of storing verbose and noisy logs. Filebeat has lightweight dissect and drop processors exactly for this purpose.
Even if you have to keep every log line due to regulatory requirements, there are ways to optimize storage costs with “schema on write”. First, the control is yours; you don’t have to fully structure your logs – if your use case calls for it, only add a few important pieces of structured metadata and leave the rest of the log line unparsed. On the flip side, if you fully structure your logs, where every bit of important data ends up in structured storage, you don’t have to keep the “source” field in the same cluster that has the indexed logs – archive that off to cheap storage.
There are also many ways to optimize Elasticsearch defaults if storage still remains of major concern — you can get compression ratios down with a few simple tweaks. You can also utilize hot/warm architectures and frozen indices to get the most out of your storage when it comes to less frequently accessed data stored for longer retentions. However, do remember that, when it comes to hot data, storage is relatively cheap compared to minutes waiting to get an answer to your query when you most need it.
Defining structure upfront
Another myth we hear is that structuring logs ahead of storing them is hard. Let’s demystify this claim a bit.
Structured logs. Many logs are already produced in structured formats. Most common applications support logging directly to JSON. This means, you can start ingesting your logs directly into Elasticsearch and storing them in structured formats without the need to parse them.
Pre-built parsing rules. There are dozens of pre-built parsing rules officially supported by Elastic. For example, Filebeat modules structure known vendor logs for you and Logstash contains an extensive grok pattern library. Many more pre-built parsing rules are available in the community.
Auto-generated parsing rules. Defining rules for extracting fields from custom logs is helped by tools like Kibana Data Visualizer, which automatically suggests how to parse them. Just paste a log sample in and get a grok pattern you can use in ingest node or Logstash.
What happens when your log format changes
The final myth we hear is that “schema on write” makes it harder to deal with changing log formats. That is simply not true – someone will have to deal with changing log formats, regardless of which approach you take to extract intelligence from your logs, upfront or after the fact, assuming you are doing more than full-text search. Whether you have an ingest node pipeline grokking the log as it is indexed or a Kibana scripted field that does the same at search time, when the log format changes, the logic extracting fields will need to get modified. Note that for Filebeat modules we maintain, we keep track when upstream log vendors come out with new versions and will update compatibility after testing.
There are several approaches to dealing with changing log structures at write time.
Modify parsing logic upfront. If you know the log format is going to change, you can create a parallel processing pipeline and support both versions of the log for a period of the transition. This usually applies to formats of the logs you control in-house.
Write minimal schema on parse fail. Not all changes are known ahead of time, and sometimes logs not under your control change without notice. You can account for that eventuality in the log pipeline from the very beginning. On grok parse fail, write minimal schema of timestamp and unparsed message and send an alert to the operator. At that point, it is possible to create a scripted field for the new log format, to avoid disruption in the analyst workflow, modify the pipeline going forward, and consider re-indexing the fields for short duration of the disruption in parsing logic.
Delay writing event on parse fail. If writing minimal schema is not helpful, you can instead fail to write the log line, if the parsing logic fails, and set the event aside in a “dead letter queue” (Logstash offers this functionality out of the box), and send the alert to the operator, who can fix the logic and re-run the events from the dead letter queue through the new parsing pipeline. This creates a disruption in analysis, but you don’t have to deal with scripted fields and re-indexing.
An apt analogy
This is turning out to be a long writeup, and if you made it this far, I commend you! One thing that helps me internalize a concept is a good analogy. And in speaking with Neil Desai, a Security Specialist at Elastic, I recently heard one of the best analogies for “schema on read” vs “schema on write”, which I hope you also find helpful.

In closing – the choice is yours
As mentioned at the beginning, there is not necessarily a one-fits-all answer for every centralized logging deployment when it comes to “schema on write” vs “schema on read”. In fact, most deployments we see are somewhere in the middle – they structure some logs to a great extent and leave others in the most basic schema (@timestamp and message). It all depends on what you are trying to do with the logs, and whether you value the speed and efficiency of structured queries vs the writing data to disk as soon as possible with no fuss upfront. The Elastic Stack supports both.
To get started with logs in Elastic Stack, spin up a cluster in Elasticsearch Service or download it locally. And check out the new Logs app in Kibana that optimizes your workflow for working with logs in any shape or form, structured or unstructured.