Small, Medium, or Large - Scaling Elasticsearch and Evolving the Elastic Stack to Fit
I and my colleagues here at Elastic support customers large and small, from Fortune 500 companies to startups. They have a wide range of use cases; the size of their Elastic Stack deployments vary greatly too. In this post, we will focus on scaling the Elastic Stack to collect logs and metrics data and visualize them in Kibana. We will follow a pattern of ingest, store, and use.
Modularity, flexibility, most of all, simplicity, are our main goals. We will examine a number of deployment topologies in increasing complexity based on our knowledge of the Elastic products and the experience of our customers. We will demonstrate how to expand from a minimalist pattern to multi-data centers logging platform.
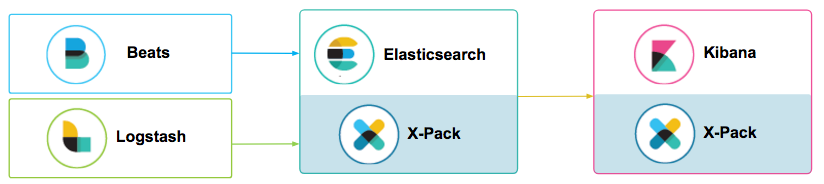
The Minimalist
It all starts with exploring and visualizing logs, events, and metrics. Great, we got you covered! Filebeat and Winlogbeat are simple tools for a simple task. Output from Beats to Elasticsearch, the data is ready to visualize in Kibana.
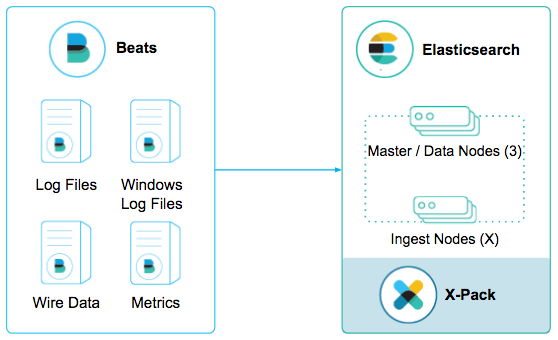
But wait, we can make this better with Elasticsearch ingest node processors. We can parse log events and enrich the documents with custom fields. There are 120 predefined reusable patterns available to the Elasticsearch ingest node grok processor; plus there are dozens of other ingest node processors to add new data fields or mutate existing ones. Together with Filebeat modules, we are off collecting, parsing, and visualizing common log formats like Apache or Nginx HTTP server, or Syslog.
As an added bonus, since we have Elasticsearch and Kibana set up, adding Packetbeat, Metricbeat, and Heartbeat to collect network and system stats and uptime, index them into Elasticsearch, and explore the data using Kibana is a cinch. To make it even easier, each of these Beat modules come with a sample dashboard.
Include Elastic's X-Pack security in the stack, we have encryption and secured transmission between Beats and the Elasticsearch cluster.
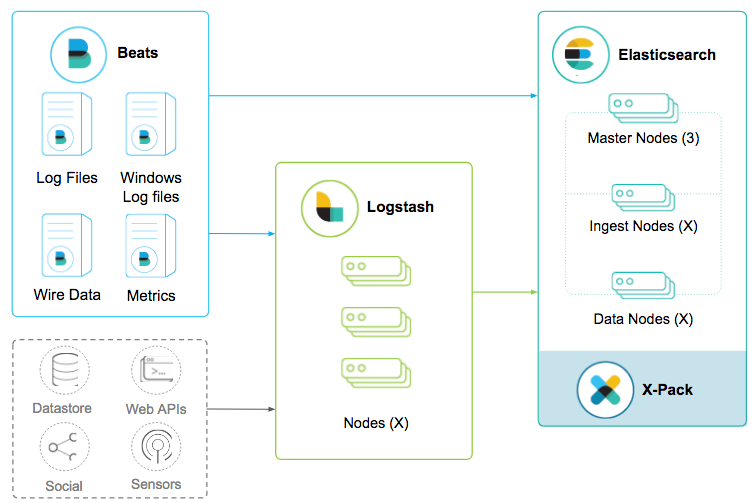
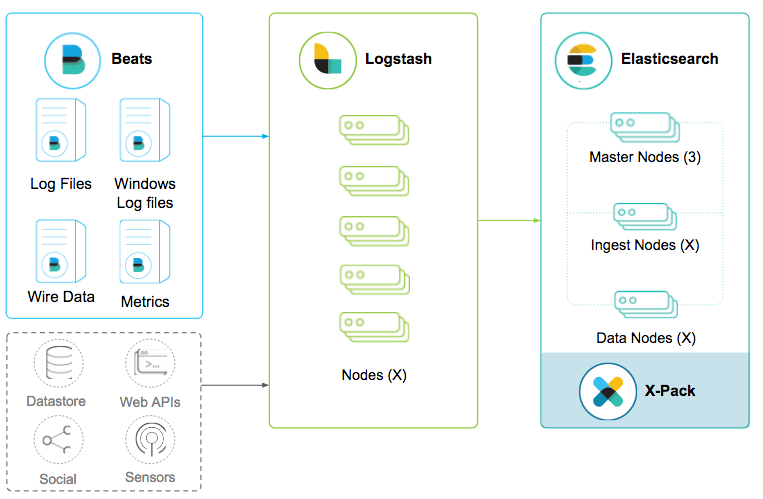
Doing More
Why stop at logs and metrics? What about other inputs, like Kafka, AWS Kinesis, Google Pub/Sub, TCP, UDP, JDBC, S3, SQS? Add Logstash to the stack. Besides being able to collect data from a variety of inputs, if we direct the Beats output through Logstash before reaching Elasticsearch, we can now do advanced transformations like aggregate or enrich data using lookup filters such as translate, dns, JDBC streaming, or Elasticsearch, which provide the ability to gather data from multiple external sources into a single document. Furthermore, Logstash can send data to S3 or HDFS for archiving in addition to indexing into Elasticsearch.
Safety First
I know one of our goals here is simplicity. What if Elasticsearch or Logstash is overloaded? Or what if Logstash or its host is terminated abnormally? What to do when things go wrong will add complexity to our stack. Fortunately, with just what we have in the current pattern, there are a number of built-in resiliency mechanisms that provide some safety net.
Filebeat and Winlogbeat use a back-pressure sensitive protocol when sending data to Elasticsearch or Logstash so they won’t overwhelm the pipeline. Also, both guarantees at least once delivery.
Logstash has a configurable persistent queue that provides data durability in events of abnormal shutdown of Logstash or its host, ensuring at least once delivery. Also, it can buffer bursts of events, eliminating the need for an external message broker, thereby avoiding adding an extra component to the stack.
Enable the Logstash dead letter queue to persist events or messages that failed to process due to mapping errors or alike to disk along with meta information like time, source and reasons for the failures. A Logstash pipeline can use the deadletterqueue input plugin to read from the queue and reprocess the events at a later time.
That said, this pattern does have limitations:
- Logstash input plugins that do not use a request-response protocol cannot be protected from data loss. For example: TCP, UDP, and many other Logstash input plugins that do not acknowledge receipt to the sender.
- The Logstash persistent queue does not provide queue level replication. Therefore, it cannot achieve high availability or protect data from permanent failure like disk corruption or machine loss without additional hardware level protections.
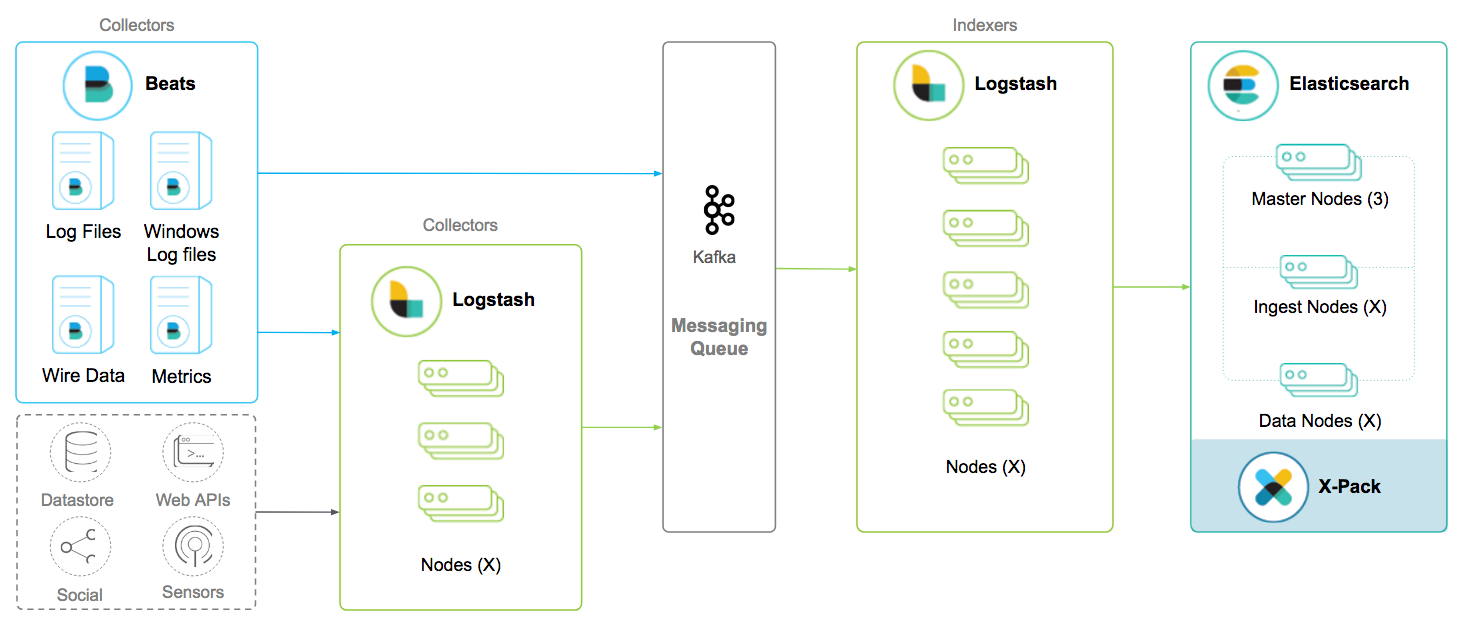
Adding a Message Queue to the Stack
To address the Logstash persistent queue limitations, we will need to introduce a queuing mechanism like Kafka to the stack. The added benefit of having a message broker is to decouple the indexing module from the collection module. The collection tier or the collectors, are the Beats and Logstash instances that sit between the inputs and the message queue. The indexing tier or the indexers are the Logstash instances between the message queue and Elasticsearch. We can add or subtract from each tier independently. This will be very valuable as more inputs and use cases feed into the stack.
Centralized Logstash
As more user groups and use cases become customers of our stack, we are evolving into a logging platform or logging as a service. How to manage configurations will be a key factor in selecting a deployment topology. In that, we see two common patterns, each with its own advantages and drawbacks.
One pattern is to let each user group control their own Elasticsearch document schema and the configuration of their Beats and Logstash instances to transform log events before arriving at the message queue. This approach achieves two things:
- Configuration changes for each group are independent from others.
- A single uniform indexer configuration greatly simplifies its management.
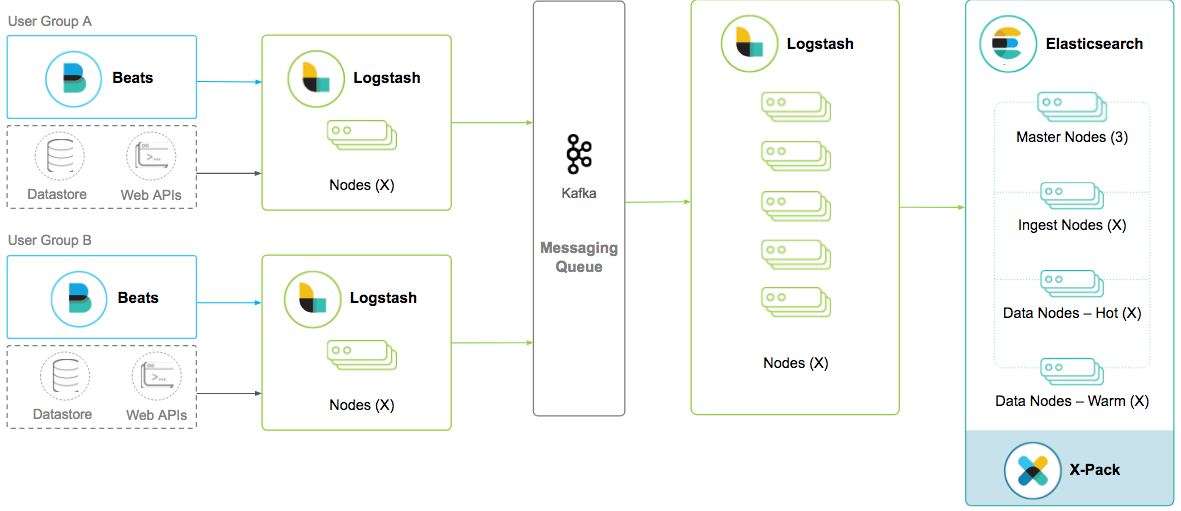
One common issue with this pattern is sometimes events or messages may not be properly processed prior to making their way to the indexers. Whether it is incorrectly formatted or simply too large, poison events can cause indexing rate to drop.
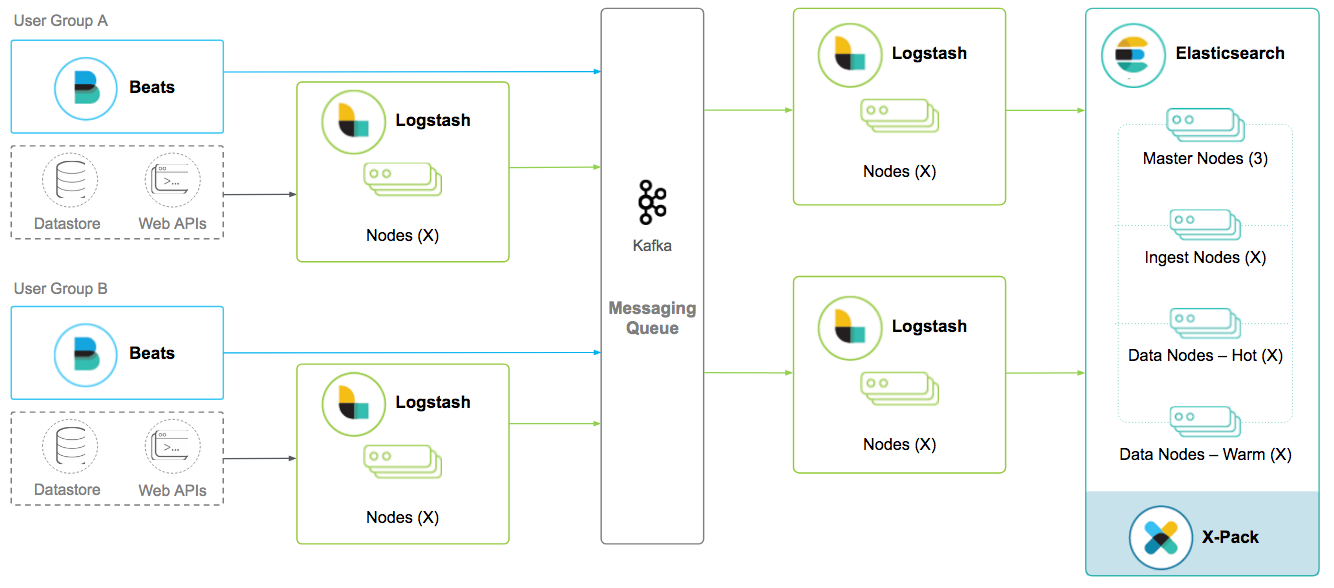
Multiple Logstash Instances
The alternative is to exert control over events or messages processing behind the message queue: one Logstash instance per user group or use case so we can tailor the configuration accordingly. The advantage is we can be certain of the quality of the documents being indexed into Elasticsearch. The obvious drawback is the increased responsibility of customizing and managing the configuration of each Logstash instance.
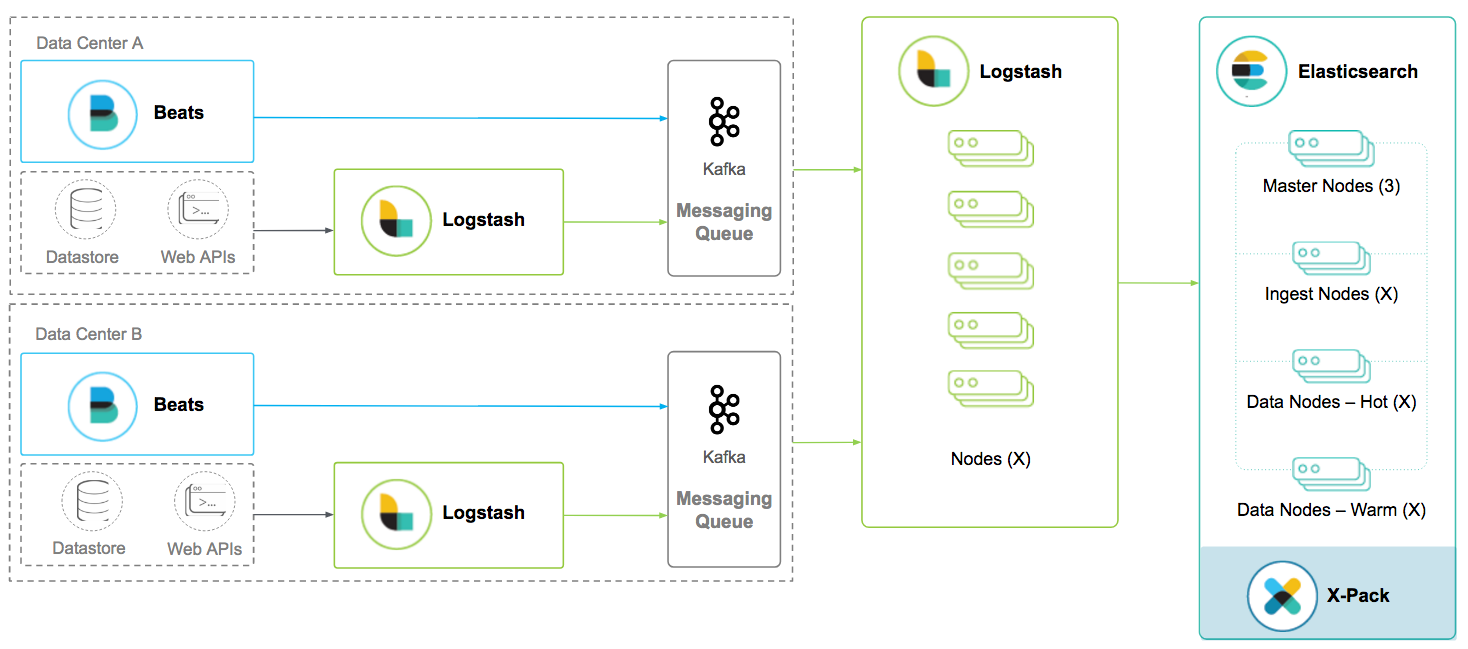
Multi Data Centers with a Queue at Each DC
So far, we have discussed deployment patterns within a single data center. In the scenarios when there are multiple data centers, commonly, there is a local Elasticsearch cluster. The Elasticsearch cross cluster search enables us to query across multiple Elasticsearch clusters.
There are occasions where data are collected from multiple data centers and indexed into a single centralized Elasticsearch cluster. Our concern here is unreliable network connection. Having a queuing mechanism at each data center greatly reduce the likelihood of data loss in event of network malfunction.
Kibana High Availability
Turning our attention to the data presentation layer, Kibana. It is the preferred visualization, data exploration, and management tool for our users. One scenario we want guard against is a single user, who is performing a wildcard prefix query, blocking other users from using the tool. To avoid a single point of failure and provide high availability, deploy at least two instances of Kibana. Each Kibana instance can connect to a separate Elasticsearch coordinating only node so we can load balance Kibana requests between the instances. Elasticsearch coordinating only nodes are neither data nodes nor master eligible nodes. They distribute requests to data nodes in a round robin fashion and perform sorts and aggregations.
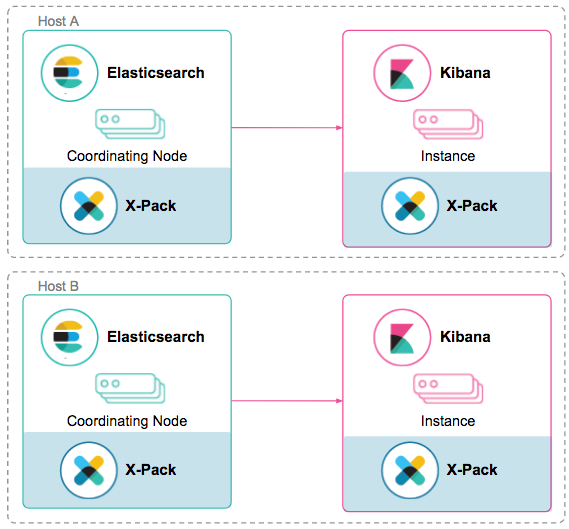
In general, Kibana is not resource intensive with the exception of generating reports containing dashboards, visualizations, and saved searches with X-Pack reporting. Often, we see customers co-locate Kibana instances with Elasticsearch coordinating only nodes. The advantage of such an approach is twofold:
- Each Elasticsearch coordinating node can act as a load balancer between the data nodes.
- Eliminate a network hop between the Elasticsearch coordinating node and Kibana.
When the Elastic Stack is serving multiple user groups or multiple use cases, the need for access control arises. Elastic X-Pack security offers us the ability to limit what a user can view and explore through Kibana. I want to go into more details about this pattern, which is common among our enterprise customers.
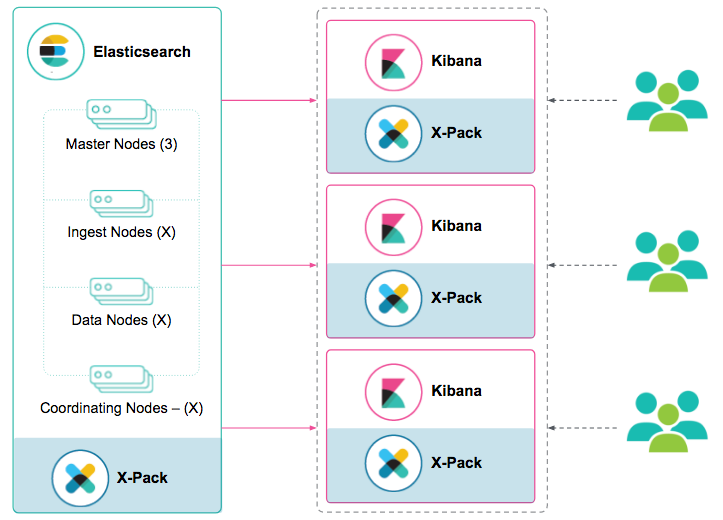
We will need to run multiple instances of Kibana, one for each user group or use case; we are looking forward to native access control of Kibana objects in the future. Each Kibana instance stores its metadata in an Elasticsearch index. Using Elastic X-Pack security and Kibana’s role management UI, we can create user roles that have access to the Kibana metadata index for the Kibana instance and the Elasticsearch data associated with the use case or user group. In the up and coming Kibana 6.0 release, there will be a built-in Kibana view role, which greatly simplifies the role definition process. Assigning users to roles, we are able to limit the data a user can see through Kibana dashboards and visualization objects. By integrating Elastic X-Pack security with Active Directory or LDAP, we can map AD or LDAP users to roles that we have created in Elasticsearch. In addition, using X-Pack document and field level security, we can further restrict the Kibana objects that a user can access.
Finally, include Elastic X-Pack monitoring components to the stack, we can view the health and performance of the Elasticsearch and Logstash instances within Kibana.
Elastic Cloud Enterprise
A completely different approach to our logging platform use case is Elastic Cloud Enterprise. It allows you to deploy the Elastic Stack with X-Pack on hardware of your choice, public or private cloud, or bare metal; it automates resizing of the Elastic stack as needed. Imagine the ability to centrally manage multiple instances of the stack: versioning, upgrading, taking snapshots for the managed clusters, having replication and failover.
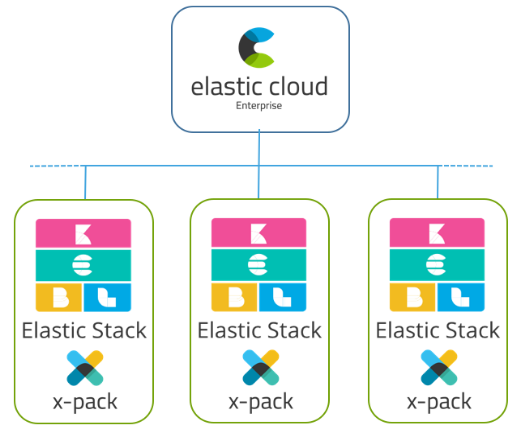
Since containerization is a key characteristic of Elastic Cloud Enterprise, we can supply each user group or each use case with their own "mini" stack, an Elasticsearch cluster and its corresponding Kibana instances. Another added benefit besides security is better resource isolation. ECE limits the CPU, memory and disk allocation of each node it manages, so two different clusters running on the same host are much better resource-isolated from one another compared to two different indices on the same cluster. In the future, we do plan to add the full stack to Elastic Cloud Enterprise.