Storing and enriching alerts for information security with Elasticsearch
Editor's Note: With the release of Elastic Stack 7.11, the new alerting framework is now generally available. In addition to existing connectors to 3rd party platforms like Slack PagerDuty, and Servicenow, 7.11 adds Microsoft Teams to the list of built-in alerting integrations. Read more about this update in our alerting release blog.
Within Elastic, the information security team is tasked with security detection and analytics, among many other activities of a typical information security team. To find abnormal and malicious behavior within our environment we leverage Elastic SIEM for investigations and threat hunting. When we find a pattern of behavior we want to be alerted on during an investigation or hunt we take the request JSON behind our investigation and put in to Watcher for alerting. Recently, we decided to start capturing the payload of our alerts in a separate index with the following goals:
- Better reporting on the alerts that fire and observables (hosts, users, IPs, etc…) that are part of an alert payload.
- Enrichment of alert payloads with MITRE ATT&CK information and response playbooks. This will further speed up analysts and provide additional reporting on observed behaviors and coverage of the MITRE ATT&CK framework.
Watcher has an index action that allows you to index data into Elasticsearch but I wanted to do more than just send the alert data in to another index, I wanted to enrich it with additional data so I got creative to make this happen.
Alert indexing and enrichment
I won’t dive in to the body of the Watcher; I’m going to assume if you’re reading this you’ve already got Watcher setup for alerting. To get the enrichments in to the alert payload, I used a Watcher payload transform to list each object in ctx.payload.hits.hits, and then added in the enriched, MITRE ATT&CK framework fields. You’ll notice we used parameters to inject the values for the newly created fields. This makes it easier to update the injected values without getting lost in the JSON:
"transform": {
    "script": {
      "source": "List x = ctx.payload.hits.hits.stream().map(d -> {d._source['threat.framework'] = params.framework; d._source['watcher.name'] = params.watcher; d._source['threat.tactic.name'] = params.tactic; d._source['threat.technique.id'] = params.techniqueid; d._source['threat.technique.name'] = params.techniquename; return d._source}).collect(Collectors.toList()); return x;",
      "lang": "painless",
      "params": {
        "watcher": "logFileChanges.json",
        "framework": "MITRE ATT&CK",
        "tactic": "Execution",
        "techniqueid": "T1059",
        "techniquename": "Command-Line Interface"
      }
    }
  }
Now the enriched alert payload is ready to be sent into the new index. This is where the index_payload action comes in. Another transform is used to return the documents in the ctx.payload._value that we created with the transform above and then we specify the index we want to put the alerts in, in our case it’s newIndex.
"actions": {
    "index_payload": {
      "transform": {
        "script": {
          "source": "return ['_doc':ctx.payload._value];",
          "lang": "painless"
        }
      },
      "index": {
        "index": "newIndex"
      }
    }
  },
Cool, Now What?
Now that you’re storing and enriching alert data you’ll probably want to do something with it. This is where all the hard work of getting your alerts stored and enriched pays off. Now you have another index with data that you can report and alert on. Let’s dive in to some ways I’m using this alert data.
Reporting
Now that we have all of our alerts populating a new index with injected fields for our monitoring environment, we can start reporting on our observations. I set up a Canvas dashboard that lets us gain insights into what we’ve observed in our environment. Here is the Canvas dashboard with some sample data so you can see it in action.
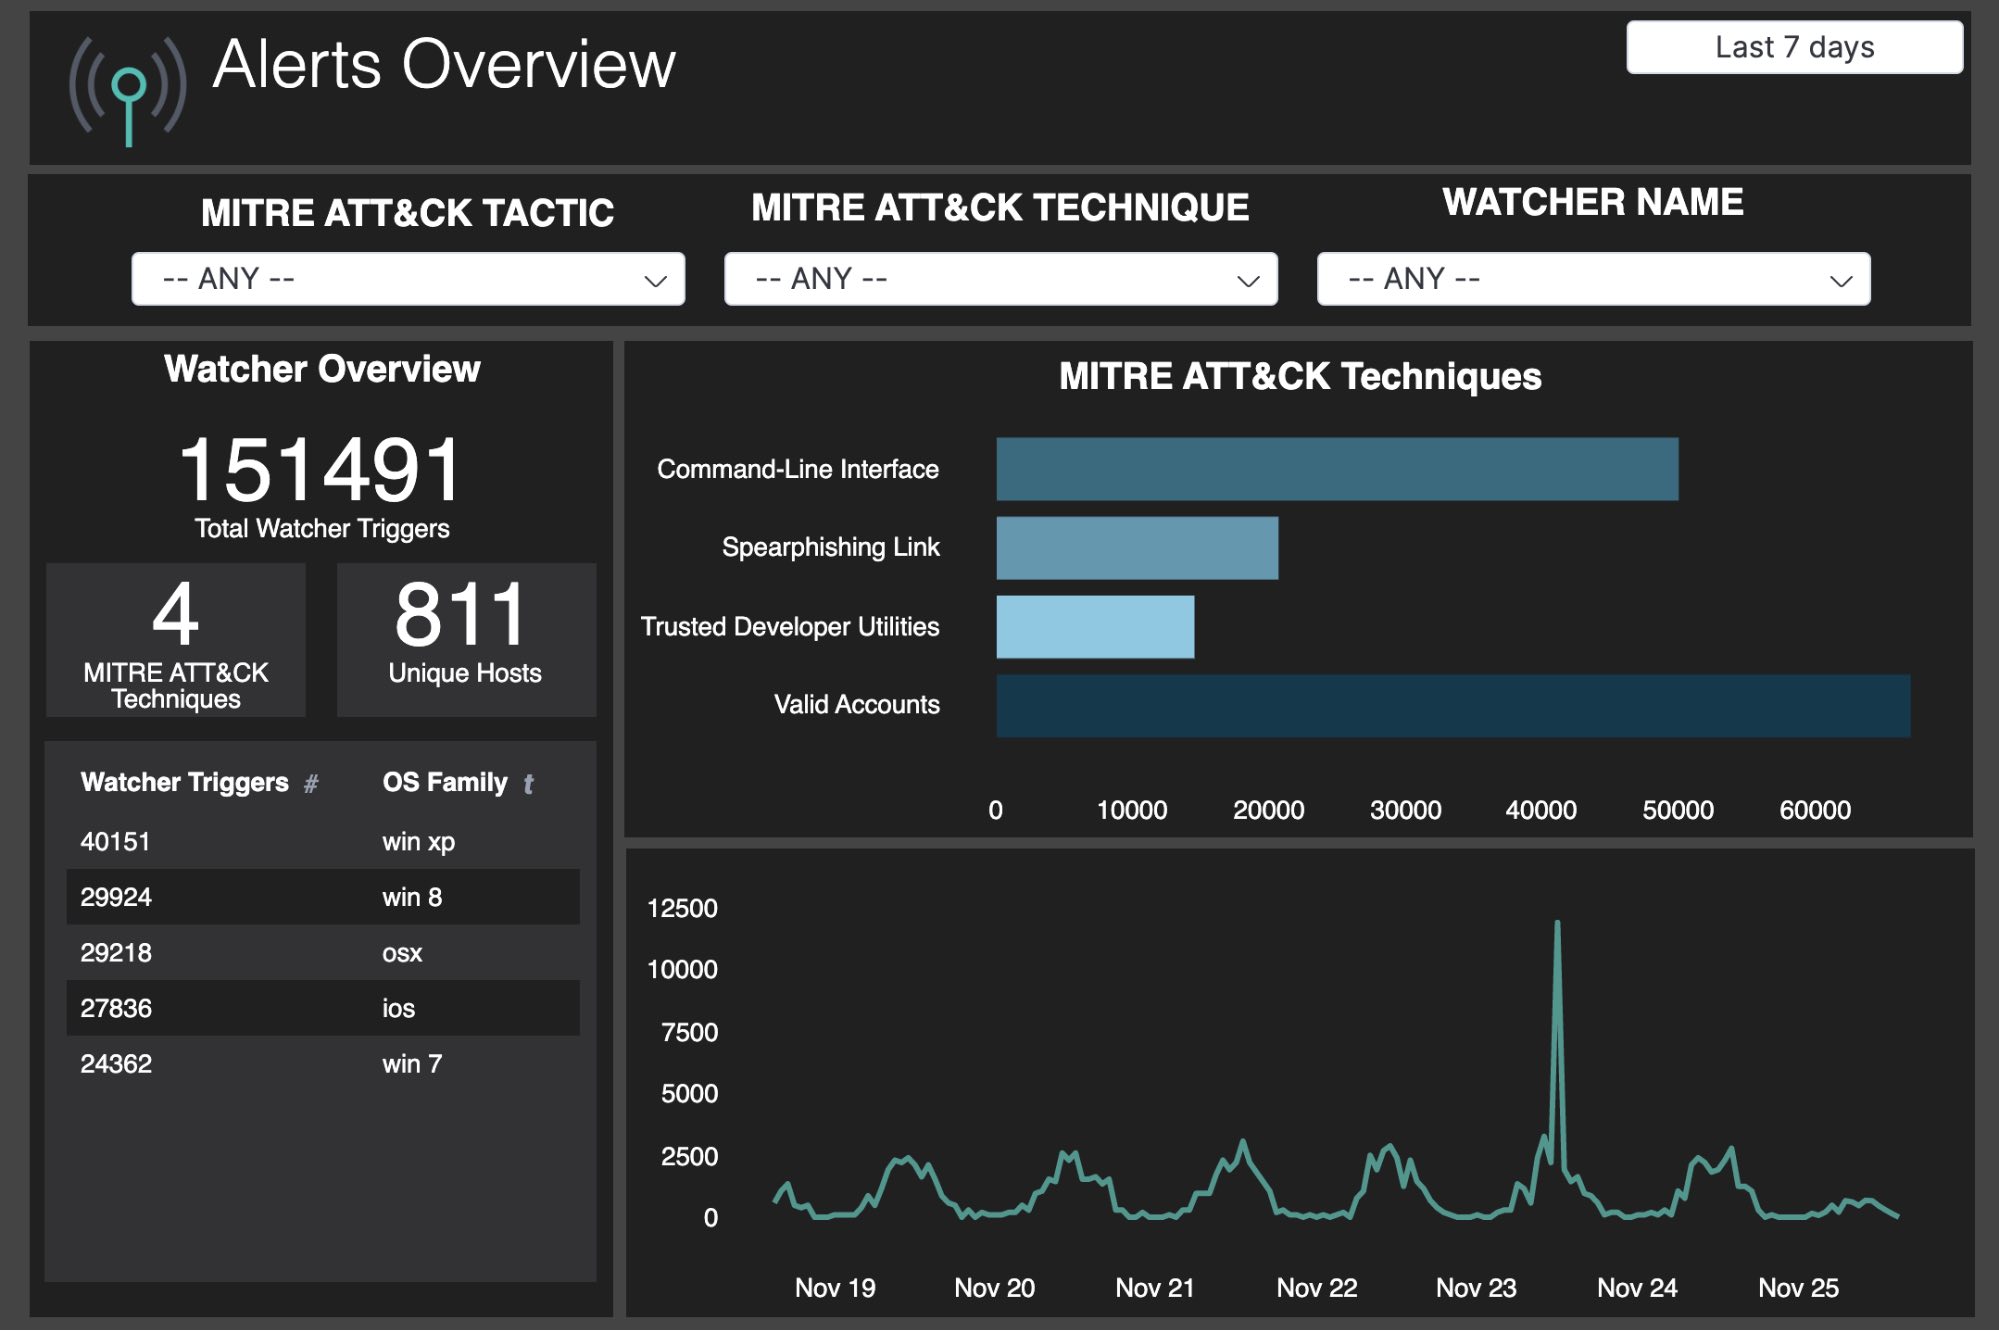
With this Canvas dashboard we are showing an overview of the alerts enriched with MITRE ATT&CK information. You can see the total number of alerts triggered and that is further broken down by MITRE ATT&CK Technique, host, and operating system. This can start to give us insight into if an attack is targeted at a single or small number of hosts or if there is just a lot of activity happening in general. We can also see if the alerts are all for a particular operating system or not. This may result in reviewing the configuration and security posture of that OS since we can see more alerts being generated from them.
The Canvas dashboard also shows us a breakdown of the MITRE ATT&CK Techniques by technique so we can see which techniques are being utilized and alerted on. We can also see with the Timelion element when these alerts are happening. This can show us if the attacks are spread out evenly, ramping up over time, or spiking.
Easier reporting, check. More meaningful reporting, check. Now lets make these alerts more useful for the analyst.
Alert Enrichment
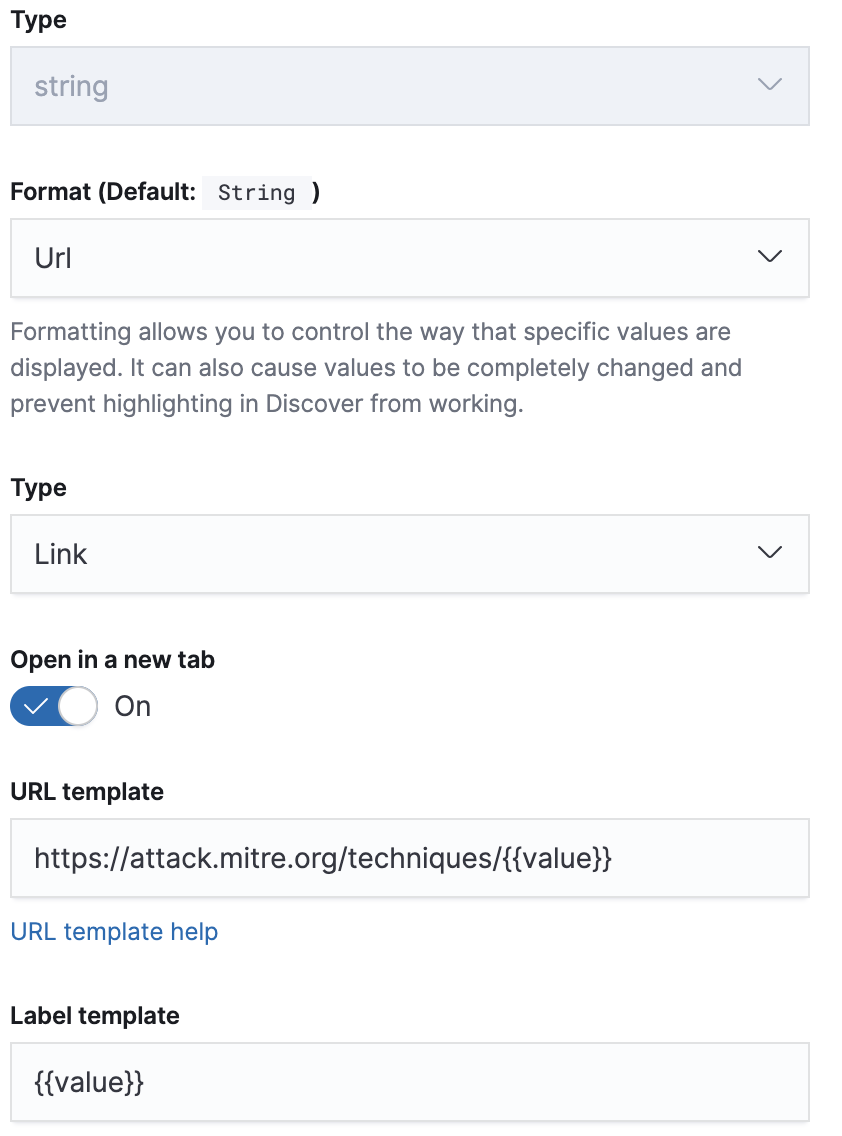
We already know the Elastic Stack is really fast at providing search results but we’re always looking for ways to make analysis even faster and more efficient. To speed up the analysts’ ability to investigate faster I made two of the injected fields link back to relevant information. Here is how I did that for threat.technique.id in the index pattern for this index.
I also did this for the field watcher.name. This is how those fields show up in the Discover view now
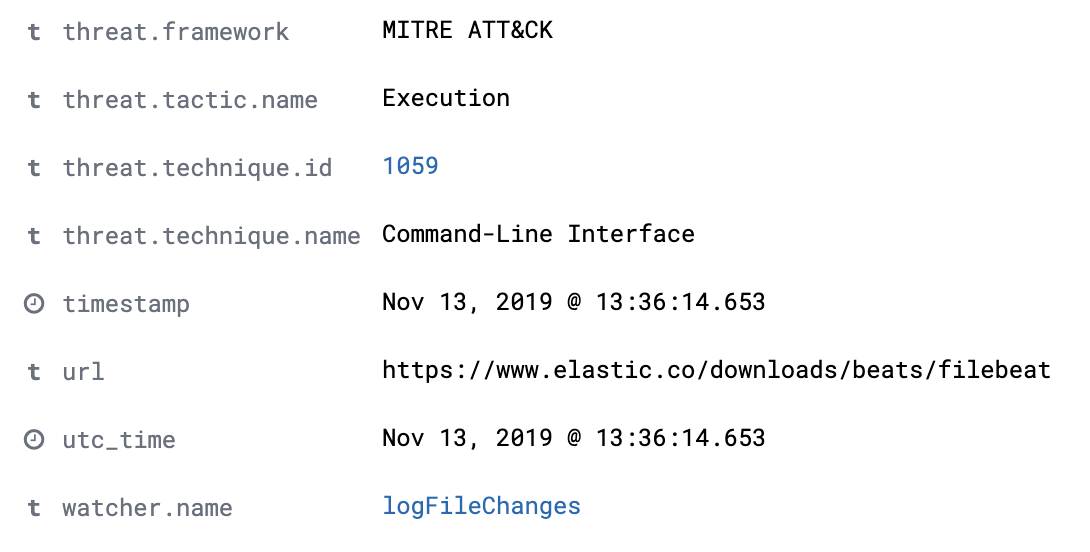
Where do these links take you? The link for threat.technique.id links back to the relevant MITRE ATT&CK Technique page so the analyst can read through the details of the technique if they aren’t familiar with it. The link to watcher.name links back to our triage playbook for this watcher so analysts don’t have to remember where to find the relevant playbook.
Wrapping up
And just like that, we’ve stored and enriched alert payloads to make reporting and we’ve met our goal of improving security detection capabilities. These same techniques can be used no matter your use case and I’m hopeful that you found this useful and can begin to do similar things within your environment. I encourage you to try it out yourself. And if you’re not currently using Elastic SIEM or Watcher, you can give them a whirl in a free trial of the Elasticsearch Service. And as always, if you run into any problems, reach out on our Discuss forums. Enjoy!