Monitoring Linux software RAID metrics with Metricbeat
The Unix world has a variety of RAID solutions, ranging from specialized distributions, such as FreeNAS, to hardware RAID, as well as OS-level solutions such as
graid on BSD and mdadm on Linux. These systems all report a variety of state data and metrics through a wide array of interfaces. With the release of 7.2, Metricbeat now reports expanded metrics on Linux software RAID. In this post, we’ll look at the software RAID metrics available in Linux, and how to ingest them with Metricbeat.
Linux software RAID metrics
Linux software RAID devices, usually created using mdadm, expose a variety of metric interfaces. One of these is via ioctl, which uses the GET_DISK_INFO and GET_ARRAY_INFO request codes. Users don’t often interact with ioctl, but you can see the data they return using tools like mdadm --status:
sudo mdadm --detail /dev/md0
/dev/md0:
           Version : 1.2
     Creation Time : Tue Jun  4 15:29:29 2019
        Raid Level : raid1
        Array Size : 101376 (99.00 MiB 103.81 MB)
     Used Dev Size : 101376 (99.00 MiB 103.81 MB)
      Raid Devices : 2
     Total Devices : 2
       Persistence : Superblock is persistent
       Update Time : Tue Jun  4 15:29:31 2019
             State : clean
    Active Devices : 2
   Working Devices : 2
    Failed Devices : 0
     Spare Devices : 0
Consistency Policy : resync
              Name : ubuntu-bionic:0  (local to host ubuntu-bionic)
              UUID : 03183b64:f3ec0a8e:f0e1d1fc:ea0f2bba
            Events : 17
    Number   Major   Minor   RaidDevice State
       0       8       33        0      active sync   /dev/sdc1
       1       8       34        1      active sync   /dev/sdc2
Another is /proc/mdstat, which provides a human-readable procfs interface:
Personalities : [linear] [multipath] [raid0] [raid1] [raid6] [raid5] [raid4] [raid10]
md0 : active raid1 sdc2[1] sdc1[0]
      101376 blocks super 1.2 [2/2] [UU]
unused devices: <none>
The final interface, and the one that Metricbeat utilizes as of 7.2, is /sys/block/mdX:
ls -l /sys/block/md0/
total 0
drwxr-xr-x  9 root root    0 Jun  4 15:56 ./
drwxr-xr-x 11 root root    0 Jun  4 15:23 ../
-r--r--r--  1 root root 4096 Jun  4 15:53 alignment_offset
lrwxrwxrwx  1 root root    0 Jun  4 15:53 bdi -> ../../bdi/9:0/
-r--r--r--  1 root root 4096 Jun  4 15:53 capability
-r--r--r--  1 root root 4096 Jun  4 15:29 dev
-r--r--r--  1 root root 4096 Jun  4 15:53 discard_alignment
-r--r--r--  1 root root 4096 Jun  4 15:53 ext_range
-r--r--r--  1 root root 4096 Jun  4 15:53 hidden
drwxr-xr-x  2 root root    0 Jun  4 15:53 holders/
-r--r--r--  1 root root 4096 Jun  4 15:53 inflight
drwxr-xr-x  2 root root    0 Jun  4 15:53 integrity/
drwxr-xr-x  5 root root    0 Jun  4 15:56 md/
drwxr-xr-x  2 root root    0 Jun  4 15:53 power/
drwxr-xr-x  2 root root    0 Jun  4 15:53 queue/
-r--r--r--  1 root root 4096 Jun  4 15:53 range
-r--r--r--  1 root root 4096 Jun  4 15:53 removable
-r--r--r--  1 root root 4096 Jun  4 15:53 ro
-r--r--r--  1 root root 4096 Jun  4 15:53 size
drwxr-xr-x  2 root root    0 Jun  4 15:53 slaves/
-r--r--r--  1 root root 4096 Jun  4 15:53 stat
lrwxrwxrwx  1 root root    0 Jun  4 15:53 subsystem -> ../../../../class/block/
drwxr-xr-x  2 root root    0 Jun  4 15:53 trace/
-rw-r--r--  1 root root 4096 Jun  4 15:29 uevent
This sysfs interface provides a number of metrics based on the RAID level of the array. As of 7.2, Metricbeat only reads from a few of these files: size, md/array_state, md/level, md/dev-X/state, md/sync_completed, and md/sync_action. These last two are only available if the RAID array is redundant; that is, a 1, 4, 5, 6, or 10 array.
Ingesting Linux software RAID data with Metricbeat
If you’re already using the Metricbeat system module, enable the RAID metricset. By default, the configuration is present, but commented out in modules.d/system.yml. Uncomment the lines to get started:
#- module: system
#  period: 5m
#  metricsets:
#    - raid
#  raid.mount_point: '/'
If you’re running Metricbeat inside of Docker, configure Metricbeat to monitor the host machine, and set the hostfs variable in system.yml to reflect the sysfs mount point.
After you configure the metricset, start Metricbeat and look for events from the RAID metricset:
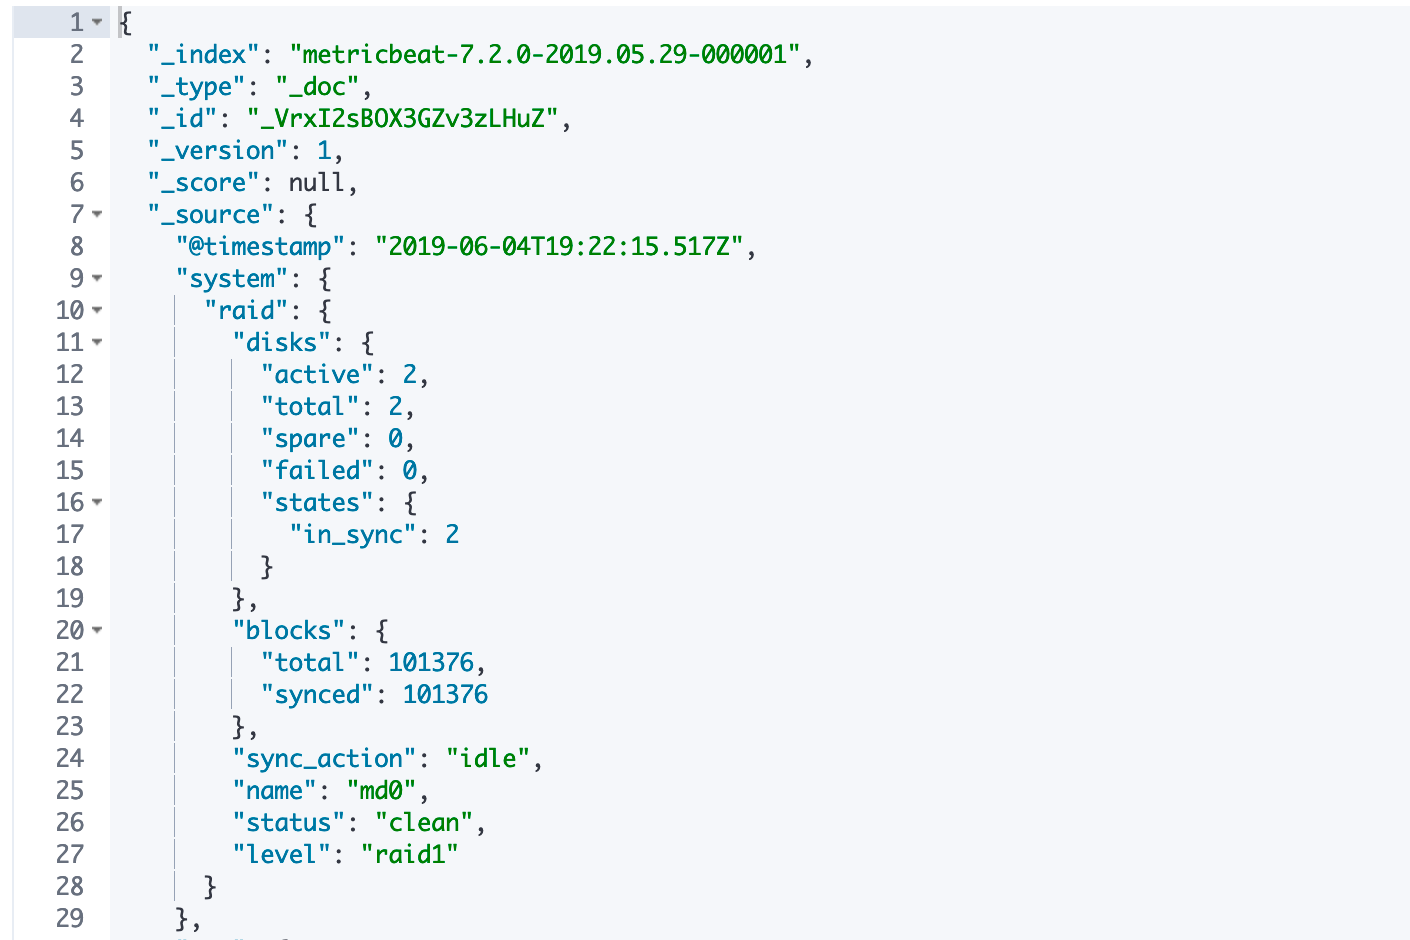
Metricbeat normalizes disk states into four categories: active, total, spare, and failed. The states object reports the raw states from the operating system. This structure allows us to keep metrics consistent as we add more platforms to the metricset. The blocks object will show the state of any sync action in the array, or the total block size if no action is taking place.
Example: Finding failed disks in Kibana
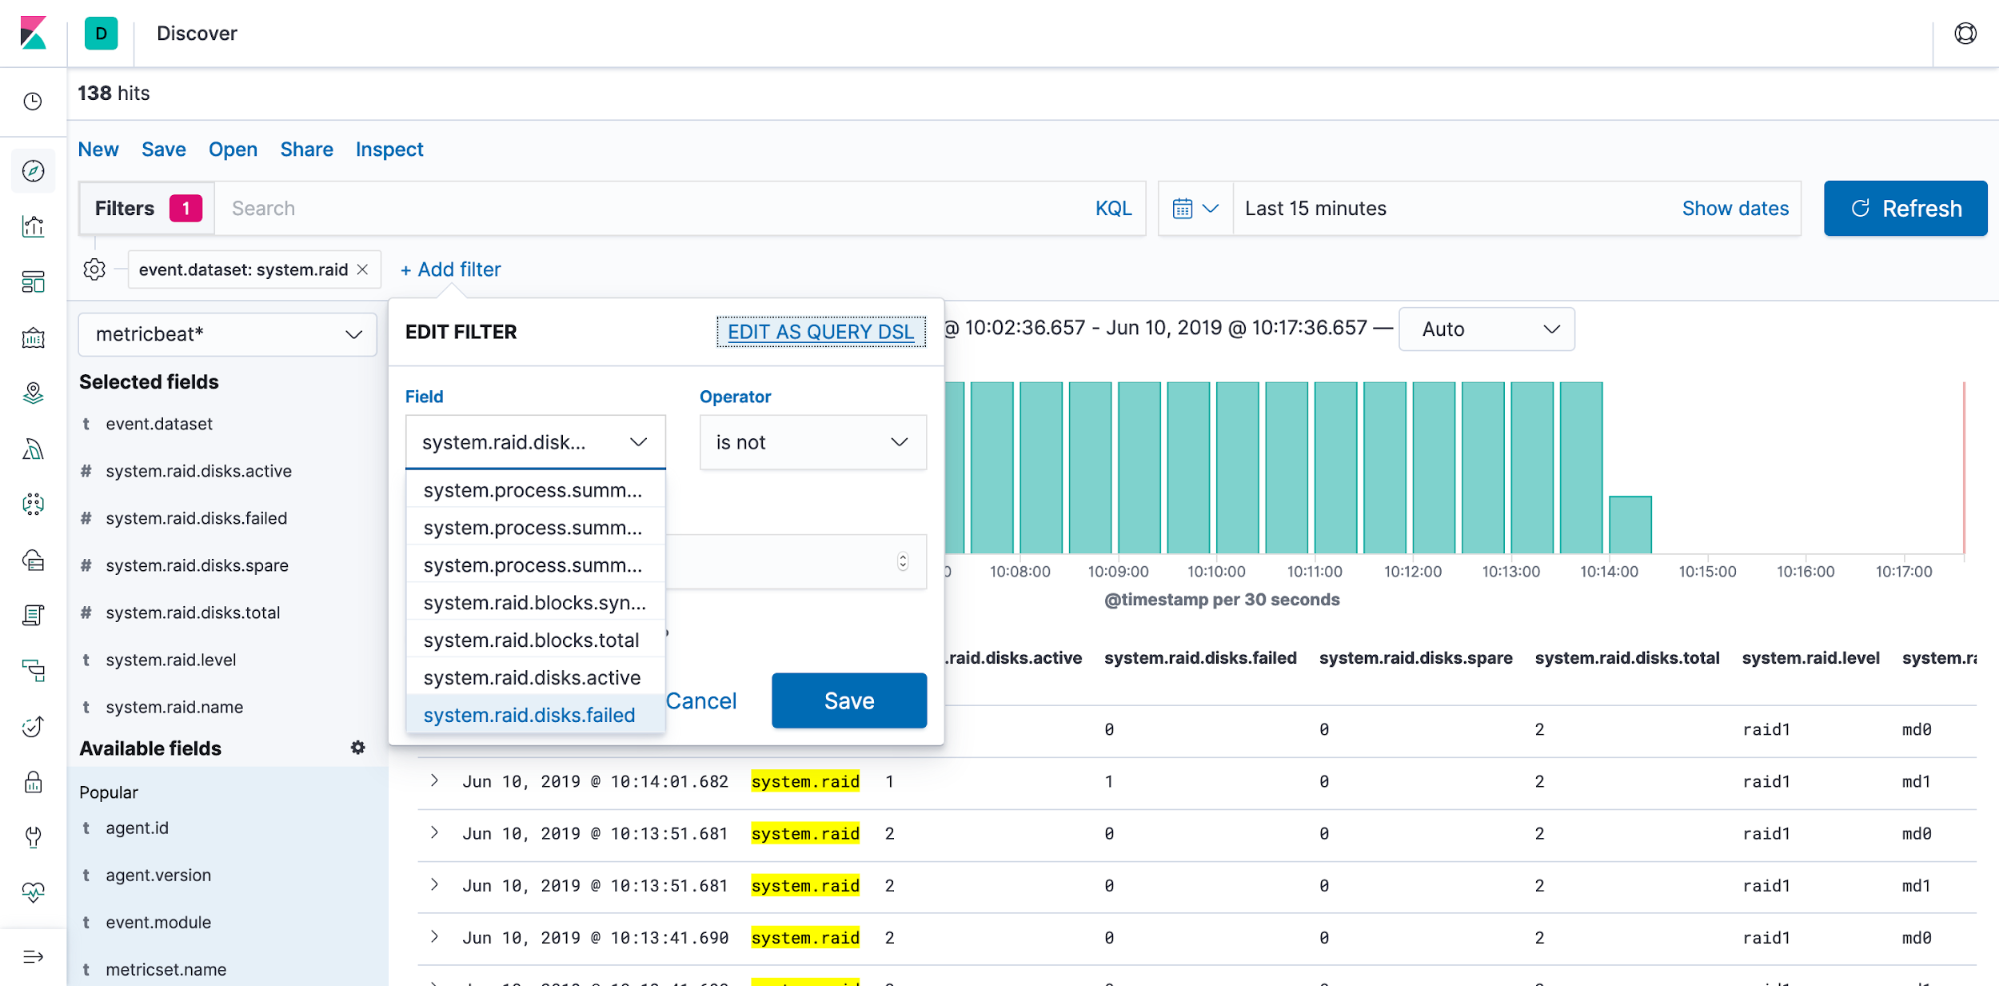
Once you’re ingesting RAID data into Elasticsearch, it’s easy to find RAID arrays with failed disks or other problems using the Discover app.
Just create a new filter rule using the system.raid.disks.failed field, and filter for values other than 0:
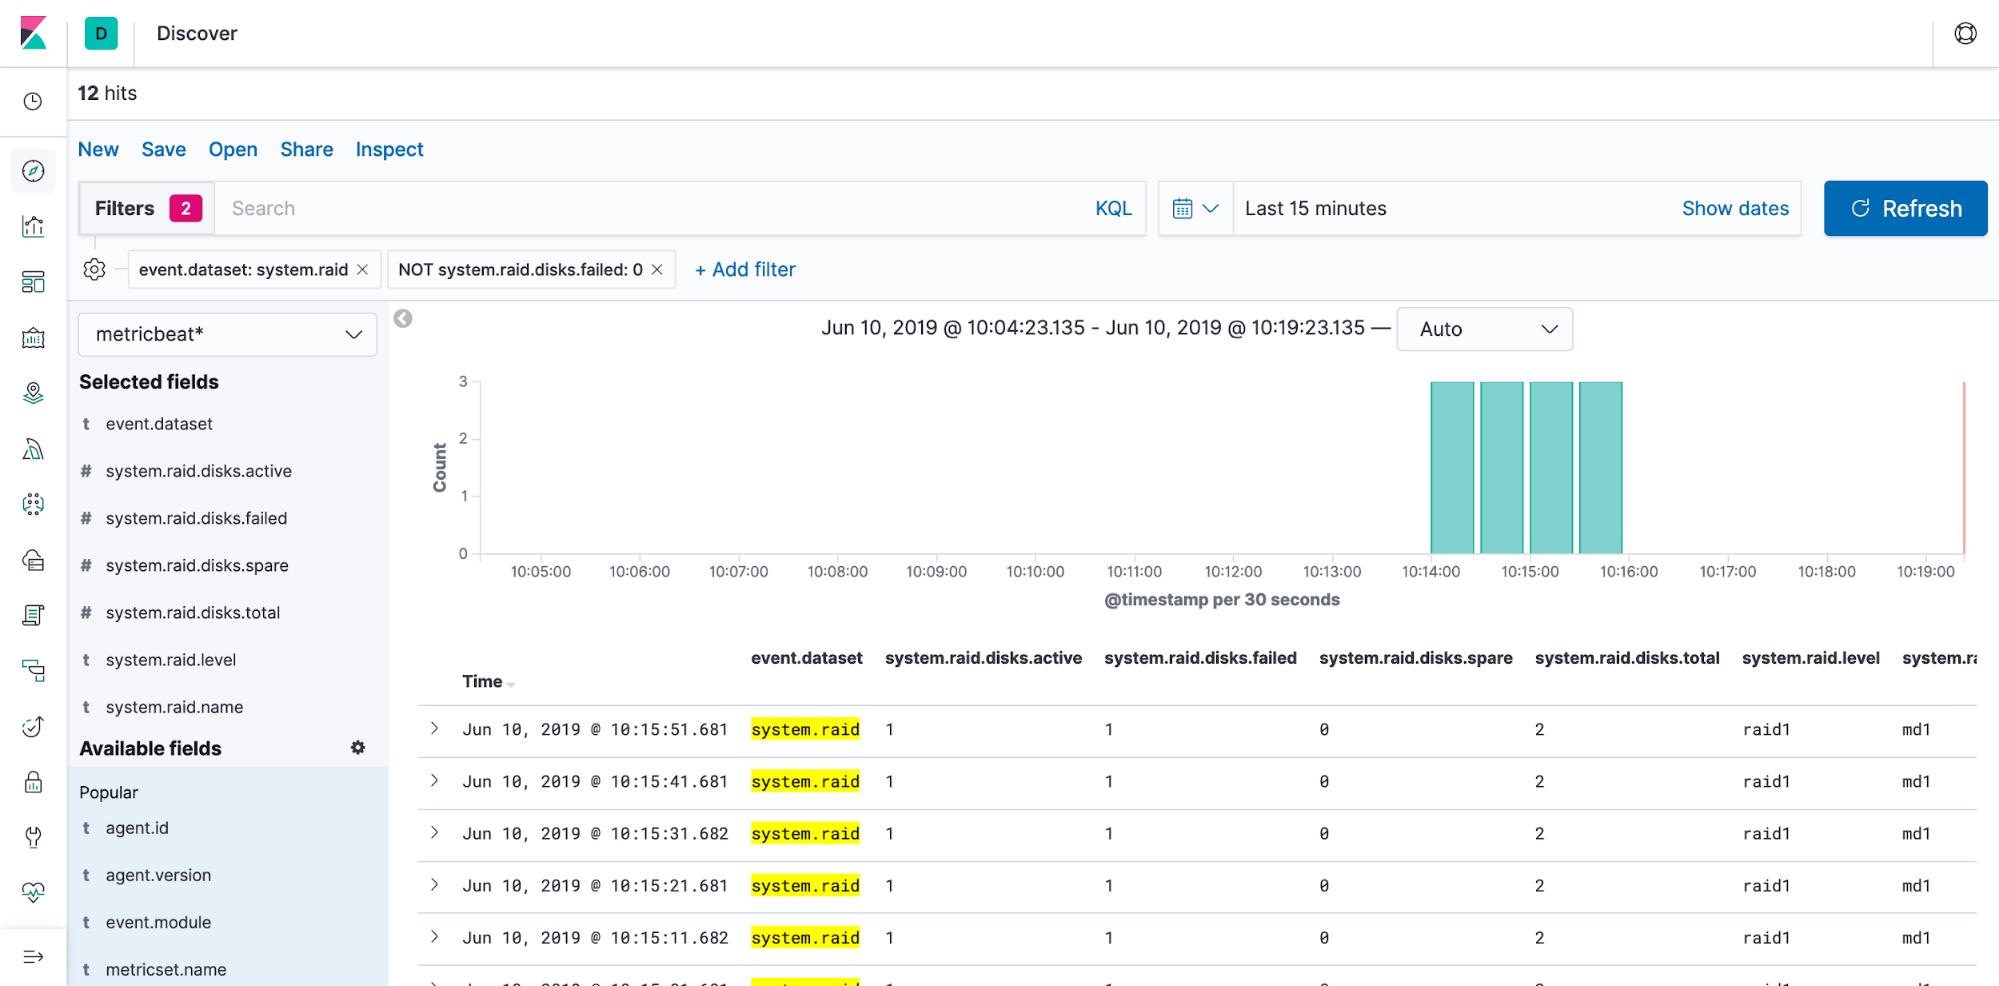
We can now see that the md1 array has a failed disk that should be addressed:
Wrapping up
And it’s that simple to start monitoring your Linux software RAIDs with Metricbeat and the Elastic Stack. You can try it out in a 14-day free trial of the Elasticsearch Service, or download and run it locally today. If you run into problems, be sure to reach out on our Discuss forum.