From pipe dreams to reality: Announcing Elastic’s piped query language, ES|QL


 Share on Twitter
Share on Twitter

 Share on LinkedIn
Share on LinkedIn

 Share on Facebook
Share on Facebook

 Share by Email
Share by Email

 Print this page
Print
Today, we are pleased to announce the technical preview of Elastic®’s new piped query language, ES|QL (Elasticsearch Query Language), which transforms, enriches, and simplifies data investigations. Powered by a new query engine, ES|QL delivers advanced search capabilities with concurrent processing, improving speed and efficiency irrespective of data source and structure. Quickly resolve issues by creating aggregations and visualizations all from a single screen for an iterative and smooth workflow.
Evolution in Elasticsearch
Over the past 13 years, Elasticsearch® has significantly evolved, adapting to user needs and the shifting digital landscape. Originally for full-text search, Elasticsearch expanded to support a broader set of use cases based on user feedback. Throughout this journey, the Elasticsearch Query DSL, our first adopted search language, provided a rich set of queries for filters, aggregations, and other operations. This JSON-based DSL ultimately became the foundation of our _search API endpoint.
Through the years and the diversification of needs, it became evident that users wanted more than what Query DSL provided. We began to adopt and weave in additional DSLs under our Query DSL for scripting or for events in security investigations and much more. However, as versatile as these additions were, they didn't entirely cover some of the requirements of our users.
Users wanted a query language that could:
- Simplify threat and security investigations while observing and resolving production issues through a single query that delivers a comprehensive and iterative approach
- Streamline data investigations by searching, enriching, aggregating, and visualizing plus more, all from a single interface
- Use advanced search capabilities like lookups with concurrent processing improving speed and efficiency to query vast amounts of data irrespective of source and structure
From pipe dreams to reality — Introducing ES|QL
We listened and are proud to introduce Elasticsearch Query Language (ES|QL), our new innovative piped query language — a single unified method and language to interact with data in Elasticsearch while removing the costly need to transfer it to external systems for specialized processing. Unlike other languages Elastic has adopted over the years like Query DSL, ES|QL is designed and purpose built from the ground up to greatly simplify data investigations and be accessible for beginners while being powerful for experts.
ES|QL example command:
from logstash-*
| stats avg_bytes = avg(bytes) by geo.src
| eval avg_bytes_kb = round(avg_bytes/1024, 2)
| enrich geo-data on geo.src with country, continent
| keep avg_bytes_kb, geo.src, country, continent
| limit 4ES|QL example output:
| avg_bytes_kb | geo.src | country | continent |
| 8.84 | BD | Bangladesh | Asia |
| 6.92 | BR | Brazil | Americas |
| 2.75 | CI | Côte d'Ivoire | Africa |
| 4.55 | CL | Chile | Americas |
Streamlined simplicity: A UI tailored for enhanced and iterative workflows
Connecting the dots of an unfolding attack or navigating through observability data requires you to filter, search, transform, and aggregate across an extraordinary amount of data. ES|QL delivers this functionality from a single query.
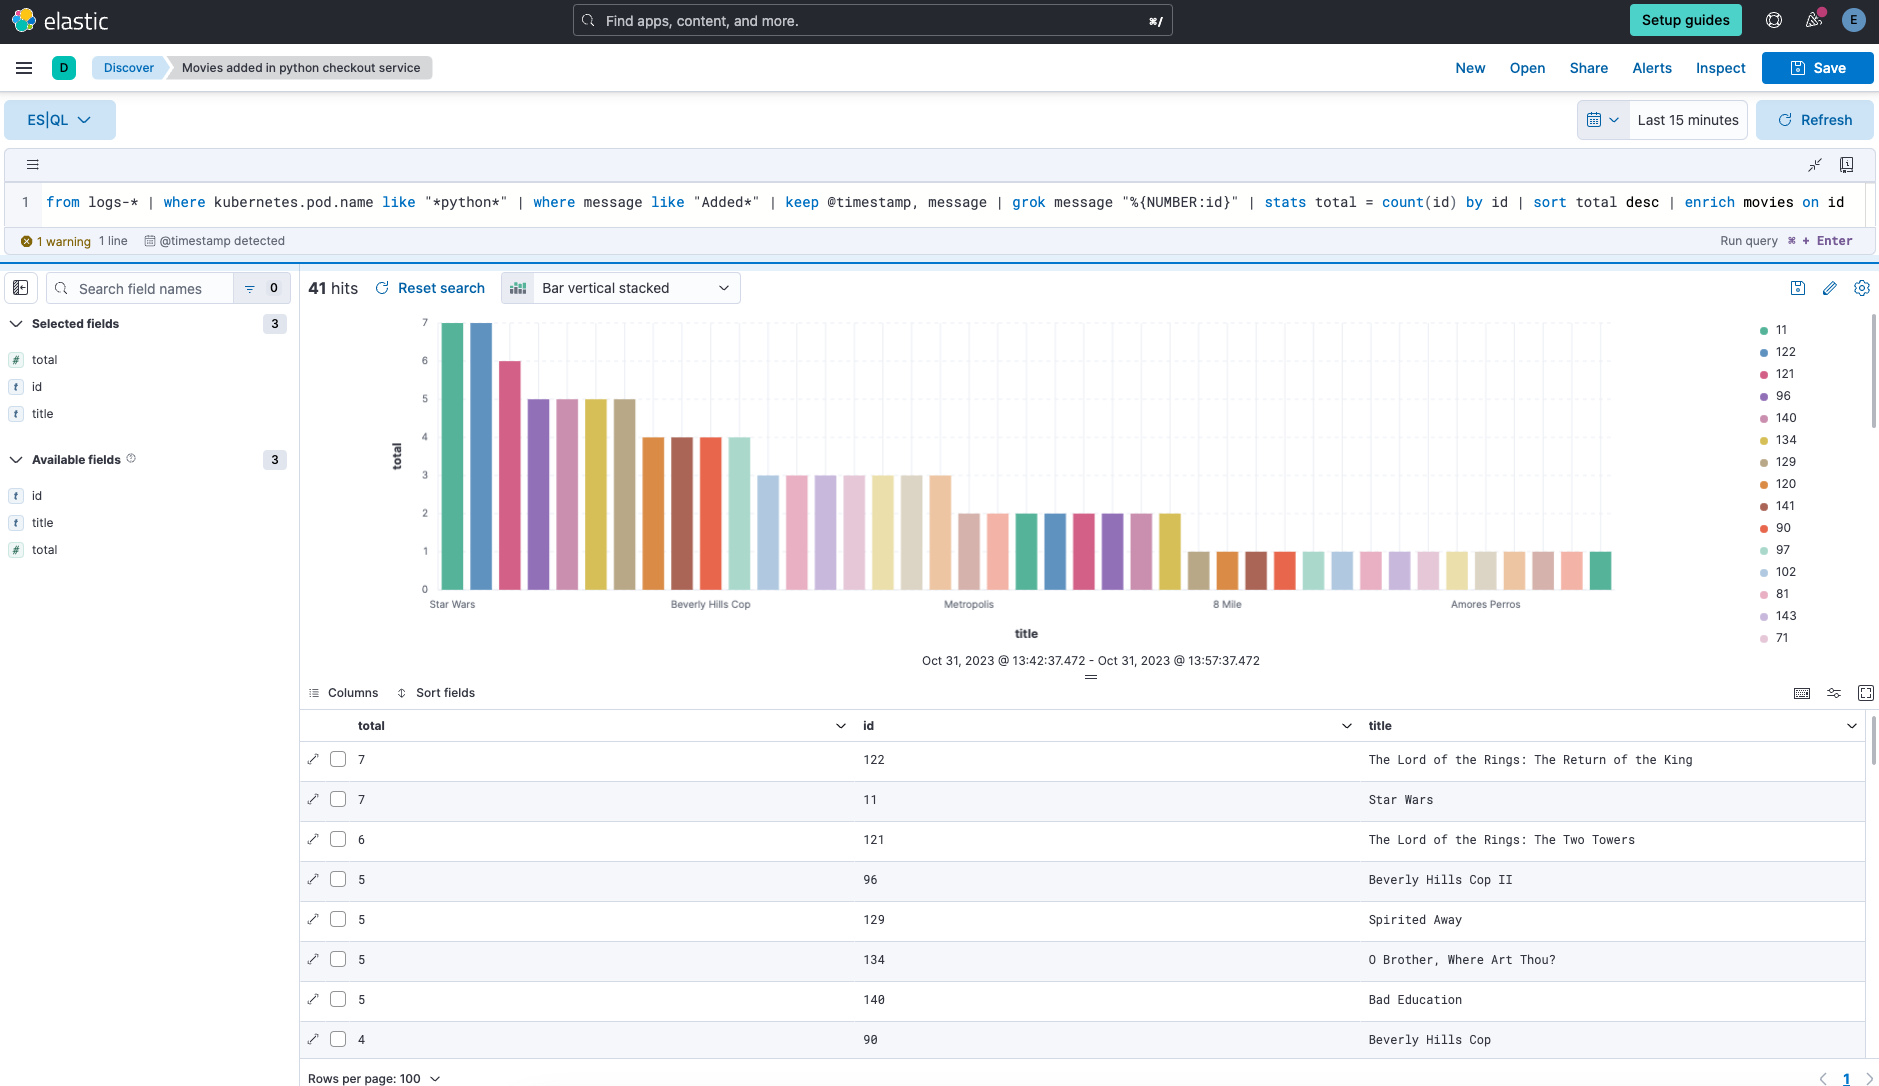
Context switching or trying to find what you are looking for from many screens can slow you down and be frustrating. From a unified display, ES|QL provides autocomplete syntax, integrates product documentation, and visualizes search outcomes, ensuring an uninterrupted and efficient workflow for data inquiries. Whether for security, observability, or search, ES|QL enhances efficiency, speed, and the depth of data exploration.
ES|QL concurrency — Two threads are better than one
Powered by a robust query engine, ES|QL offers advanced search capabilities with concurrent processing, enabling users to seamlessly query across diverse data sources and structure.
There is no translation or transpliations to Query DSL; instead, each query in ES|QL is initially broken down, interpreted for its meaning, validated for accuracy, and then enhanced for best performance. Then a process is laid out for executing the query across various nodes within the cluster. The target nodes handle the query, making on-the-fly adjustments to the execution plan using the framework provided by ES|QL. The result is lightning fast queries that you get out of the box. As an example, view the nightly benchmarks for comparison.
Platform innovation drives Elastic solutions benefits
Elastic’s solutions — Search, Observability, and Security — all benefit from features and innovations that are delivered within Elasticsearch and Kibana®. ES|QL fundamentally changes the experience of using these solutions and provides a simple but powerful data investigation workflow.
ES|QL enhances Elastic Security
ES|QL fundamentally changes how analysts pursue threats and strengthens detection. Built in answer to rich community input, it unleashes the power of piped queries at the speed of Elasticsearch, enhancing the SIEM, endpoint security, and cloud security capabilities of Elastic Security.
- Search quickly and iteratively: Following the breadcrumbs of an emerging threat requires quick action and a language that delivers an iterative workflow.
- Enrich results with context: ES|QL enables analysts to correlate suspicious IP addresses with known threat intelligence databases, providing immediate clarity on potential threats.
- Transform data: ES|QL empowers users to manipulate their data by defining new fields or parsing non-normalized data, ensuring data clarity and relevance.
- Aggregate data: Results can be consolidated and aggregated, paving the way for deeper analysis and insight extraction.
Elastic is the only search platform to pair the efficiency of a schema-on-write architecture with the iterative search experience of a schema-on-read piped query language. With incredibly fast search — and query output in full sight — analysts can draw closer to their target with each successive pipe.
ES|QL also enhances Elastic Security’s powerful detection engine. To reduce alarm fatigue, improve alert relevance, and provide another avenue for behavioral detection, organizations can incorporate aggregated values within detection rules. With inline evaluation, practitioners can iteratively develop and hone ES|QL-based rules. Queries are formatted in plaintext, simplifying collaboration and supporting detection-as-code.
ES|QL impacts Elastic Observability
SREs using Elastic Observability can leverage ES|QL to analyze logs, metrics, traces, and profiling data, enabling them to pinpoint performance bottlenecks and system issues with a single query. SREs gain the following advantages when managing high dimensionality and high cardinality data with ES|QL in Elastic Observability:
- Remove signal noise: With ES|QL alerting, enhance detection precision by focusing on significant trends rather than individual incidents, minimizing false alarms, and delivering actionable notifications. SREs can manage these alerts through the Elastic API and integrate them into DevOps processes.
- Enhanced analysis with insights: ES|QL can process diverse observability data, including application, infrastructure, business data, and more, regardless of the source and structure. ES|QL can easily enrich the data with additional fields and context, allowing the creation of visualizations for dashboards or issue analysis with a single query.
- Reduced mean time to resolution: ES|QL, when combined with Elastic Observability's AIOps and AI Assistant, enhances detection accuracy by identifying trends, isolating incidents, and reducing false positives. This improvement in context facilitates troubleshooting and the quick pinpointing and resolution of issues.
ES|QL in Elastic Observability not only enhances an SRE's ability to manage the customer experience, an organization's revenue, and SLOs more effectively but also facilitates collaboration with developers and DevOps by providing contextualized aggregated data.
ES|QL advances Elastic Search
With ES|QL, you can retrieve, aggregate, calculate, and transform data in a single query. It boasts key features, such as the ability to define fields at the time of query, perform data enrichment lookups, and process queries concurrently. Understand and explore your data with ES|QL in various ways. From utilizing clients for direct API/code integration to visualizing results directly from one screen, ES|QL streamlines your data investigations, ensuring you get the most out of your data sets with ease and simplicity.
ES|QL’s design focus is evident in its capability to reduce code complexity, ultimately leading to cost and time savings. By facilitating the reuse of query results in subsequent searches, ES|QL minimizes computational overhead, eliminating the need for convoluted scripts and redundant queries. ES|QL is not just an API but a simple and powerful way to transform your approach to search.
Embark on your ES|QL journey
The future of data exploration and manipulation is here. Elastic invites security analysts, SREs, and developers to experience this transformative language firsthand and unlock new horizons in their data tasks. Learn more about the possibilities with ES|QL, or start your free trial now in technical preview.
The release and timing of any features or functionality described in this post remain at Elastic's sole discretion. Any features or functionality not currently available may not be delivered on time or at all.
Share
- Share on Twitter
Share on Twitter
- Share on LinkedIn
Share on LinkedIn
- Share on Facebook
Share on Facebook
- Share by Email
Share by Email
- Print this page
Print