As an operations engineer (SRE, IT Operations, DevOps), managing technology and data sprawl is an ongoing challenge. Simply managing the large volumes of high dimensionality and high cardinality data is overwhelming.
As a single platform, Elastic® helps SREs unify and correlate limitless telemetry data, including metrics, logs, traces, and profiling, into a single datastore — Elasticsearch®. By then applying the power of Elastic’s advanced machine learning (ML), AIOps, AI Assistant, and analytics, you can break down silos and turn data into insights. As a full-stack observability solution, everything from infrastructure monitoring to log monitoring and application performance monitoring (APM) can be found in a single, unified experience.
In Elastic 8.11, a technical preview is now available of Elastic’s new piped query language, ES|QL (Elasticsearch Query Language), which transforms, enriches, and simplifies data investigations. Powered by a new query engine, ES|QL delivers advanced search capabilities with concurrent processing, improving speed and efficiency, irrespective of data source and structure. Accelerate resolution by creating aggregations and visualizations from one screen, delivering an iterative, uninterrupted workflow.
Advantages of ES|QL for SREs
SREs using Elastic Observability can leverage ES|QL to analyze logs, metrics, traces, and profiling data, enabling them to pinpoint performance bottlenecks and system issues with a single query. SREs gain the following advantages when managing high dimensionality and high cardinality data with ES|QL in Elastic Observability:
- Improved operational efficiency: By using ES|QL, SREs can create more actionable notifications with aggregated values as thresholds from a single query, which can also be managed through the Elastic API and integrated into DevOps processes.
- Enhanced analysis with insights: ES|QL can process diverse observability data, including application, infrastructure, business data, and more, regardless of the source and structure. ES|QL can easily enrich the data with additional fields and context, allowing the creation of visualizations for dashboards or issue analysis with a single query.
- Reduced mean time to resolution: ES|QL, when combined with Elastic Observability's AIOps and AI Assistant, enhances detection accuracy by identifying trends, isolating incidents, and reducing false positives. This improvement in context facilitates troubleshooting and the quick pinpointing and resolution of issues.
ES|QL in Elastic Observability not only enhances an SRE's ability to manage the customer experience, an organization's revenue, and SLOs more effectively but also facilitates collaboration with developers and DevOps by providing contextualized aggregated data.
In this blog, we will cover some of the key use cases SREs can leverage with ES|QL:
- ES|QL integrated with the Elastic AI Assistant, which uses public LLM and private data, enhances the analysis experience anywhere in Elastic Observability.
- SREs can, in a single ES|QL query, break down, analyze, and visualize observability data from multiple sources and across any time frame.
- Actionable alerts can be easily created from a single ES|QL query, enhancing operations.
I will work through these use cases by showcasing how an SRE can solve a problem in an application instrumented with OpenTelemetry and running on Kubernetes. The OpenTelemetry (OTel) demo is on an Amazon EKS cluster, with Elastic Cloud 8.11 configured.
You can also check out our Elastic Observability ES|QL Demo, which walks through ES|QL functionality for Observability.
ES|QL with AI Assistant
As an SRE, you are monitoring your OTel instrumented application with Elastic Observability, and while in Elastic APM, you notice some issues highlighted in the service map.
Using Elastic AI Assistant, you can easily ask for analysis, and in particular, we check on what the overall latency is across the application services.
My APM data is in traces-apm*. What's the average latency per service over the last hour? Use ESQL, the data is mapped to ECS
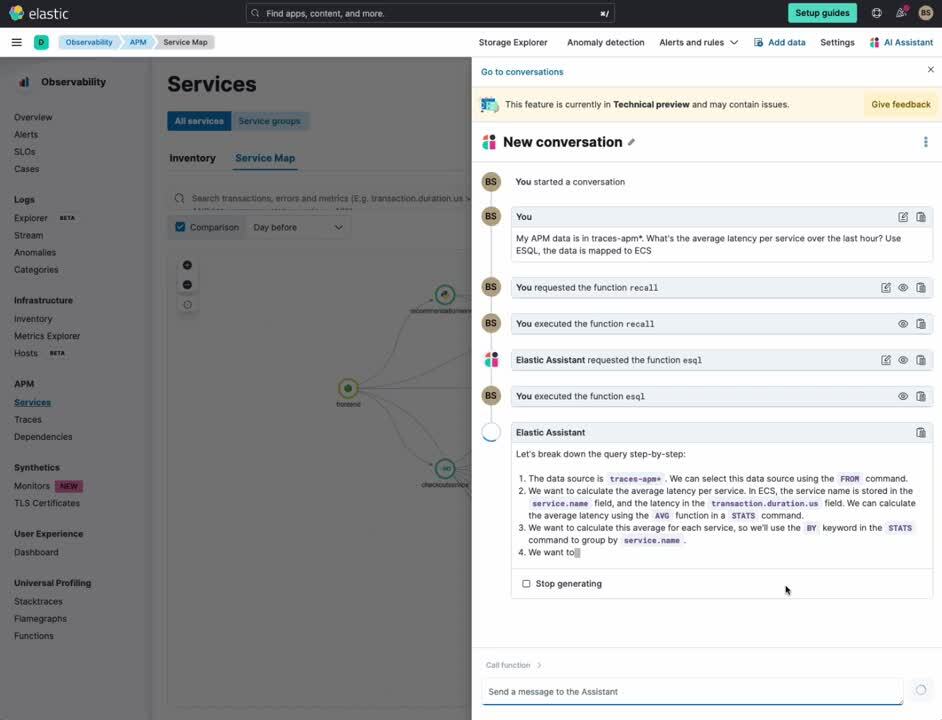
The Elastic AI Assistant generates an ES|QL query, which we run in the AI Assistant to get a list of the average latencies across all the application services. We can easily see the top four are:
- load generator
- front-end proxy
- frontendservice
- checkoutservice
With a simple natural language query in the AI Assistant, it generated a single ES|QL query that helped list out the latencies across the services.
Noticing that there is an issue with several services, we decide to start with the frontend proxy. As we work through the details, we see significant failures, and through Elastic APM failure correlation , it becomes apparent that the frontend proxy is not properly completing its calls to downstream services.
ES|QL insightful and contextual analysis in Discover
Knowing that the application is running on Kubernetes, we investigate if there are issues in Kubernetes. In particular, we want to see if there are any services having issues.
We use the following query in ES|QL in Elastic Discover:
from metrics-* | where kubernetes.container.status.last_terminated_reason != "" and kubernetes.namespace == "default" | stats reason_count=count(kubernetes.container.status.last_terminated_reason) by kubernetes.container.name, kubernetes.container.status.last_terminated_reason | where reason_count > 0
ES|QL helps analyze 1,000s/10,000s of metric events from Kubernetes and highlights two services that are restarting due to OOMKilled.
The Elastic AI Assistant, when asked about OOMKilled, indicates that a container in a pod was killed due to an out-of-memory condition.
We run another ES|QL query to understand the memory usage for emailservice and productcatalogservice.
ES|QL easily found the average memory usage fairly high.
We can now further investigate both of these services’ logs, metrics, and Kubernetes-related data. However, before we continue, we create an alert to track heavy memory usage.
Actionable alerts with ES|QL
Suspecting a specific issue, that might recur, we simply create an alert that brings in the ES|QL query we just ran that will track for any service that exceeds 50% in memory utilization.
We modify the last query to find any service with high memory usage:
FROM metrics*
| WHERE @timestamp >= NOW() - 1 hours
| STATS avg_memory_usage = AVG(kubernetes.pod.memory.usage.limit.pct) BY kubernetes.deployment.name | where avg_memory_usage > .5
With that query, we create a simple alert. Notice how the ES|QL query is brought into the alert. We simply connect this to pager duty. But we can choose from multiple connectors like ServiceNow, Opsgenie, email, etc.
With this alert, we can now easily monitor for any services that exceed 50% memory utilization in their pods.
Make the most of your data with ES|QL
In this post, we demonstrated the power ES|QL brings to analysis, operations, and reducing MTTR. In summary, the three use cases with ES|QL in Elastic Observability are as follows:
- ES|QL integrated with the Elastic AI Assistant, which uses public LLM and private data, enhances the analysis experience anywhere in Elastic Observability.
- SREs can, in a single ES|QL query, break down, analyze, and visualize observability data from multiple sources and across any time frame.
- Actionable alerts can be easily created from a single ES|QL query, enhancing operations.
Elastic invites SREs and developers to experience this transformative language firsthand and unlock new horizons in their data tasks. Try it today at https://ela.st/free-trial now in technical preview.
The release and timing of any features or functionality described in this post remain at Elastic's sole discretion. Any features or functionality not currently available may not be delivered on time or at all.