The power of effective log management in software development and operations


 Share on Twitter
Share on Twitter

 Share on LinkedIn
Share on LinkedIn

 Share on Facebook
Share on Facebook

 Share by Email
Share by Email

 Print this page
Print
The rapid software development process that exists today requires an expanding and complex infrastructure and application components, and the job of operations and development teams is ever growing and multifaceted. Observability, which helps manage and analyze telemetry data, is the key to ensuring the performance and reliability of your applications and infrastructure. In particular, logs are the main default signal developers enable, providing a significant amount of detail for debugging, performance analysis, security, and compliance management. So how do you define a strategy to get the most out of your logs?
In this blog post, we'll explore:
- The logging journey, which reviews the collection, processing and enrichment, and analysis and rationalization of logs
- The difference between managing structured and unstructured data from logs
- Whether traces should replace logs
- Improving operational efficiency for logs, by understanding how to reduce time in transformation, centralized versus decentralized log storage, and how and when to reduce what is stored
By gaining a deeper understanding of these topics, you'll be better equipped to manage logs effectively and ensure the reliability, performance, and security of your applications and infrastructure.
The logging journey
The logging journey involves three basic steps:
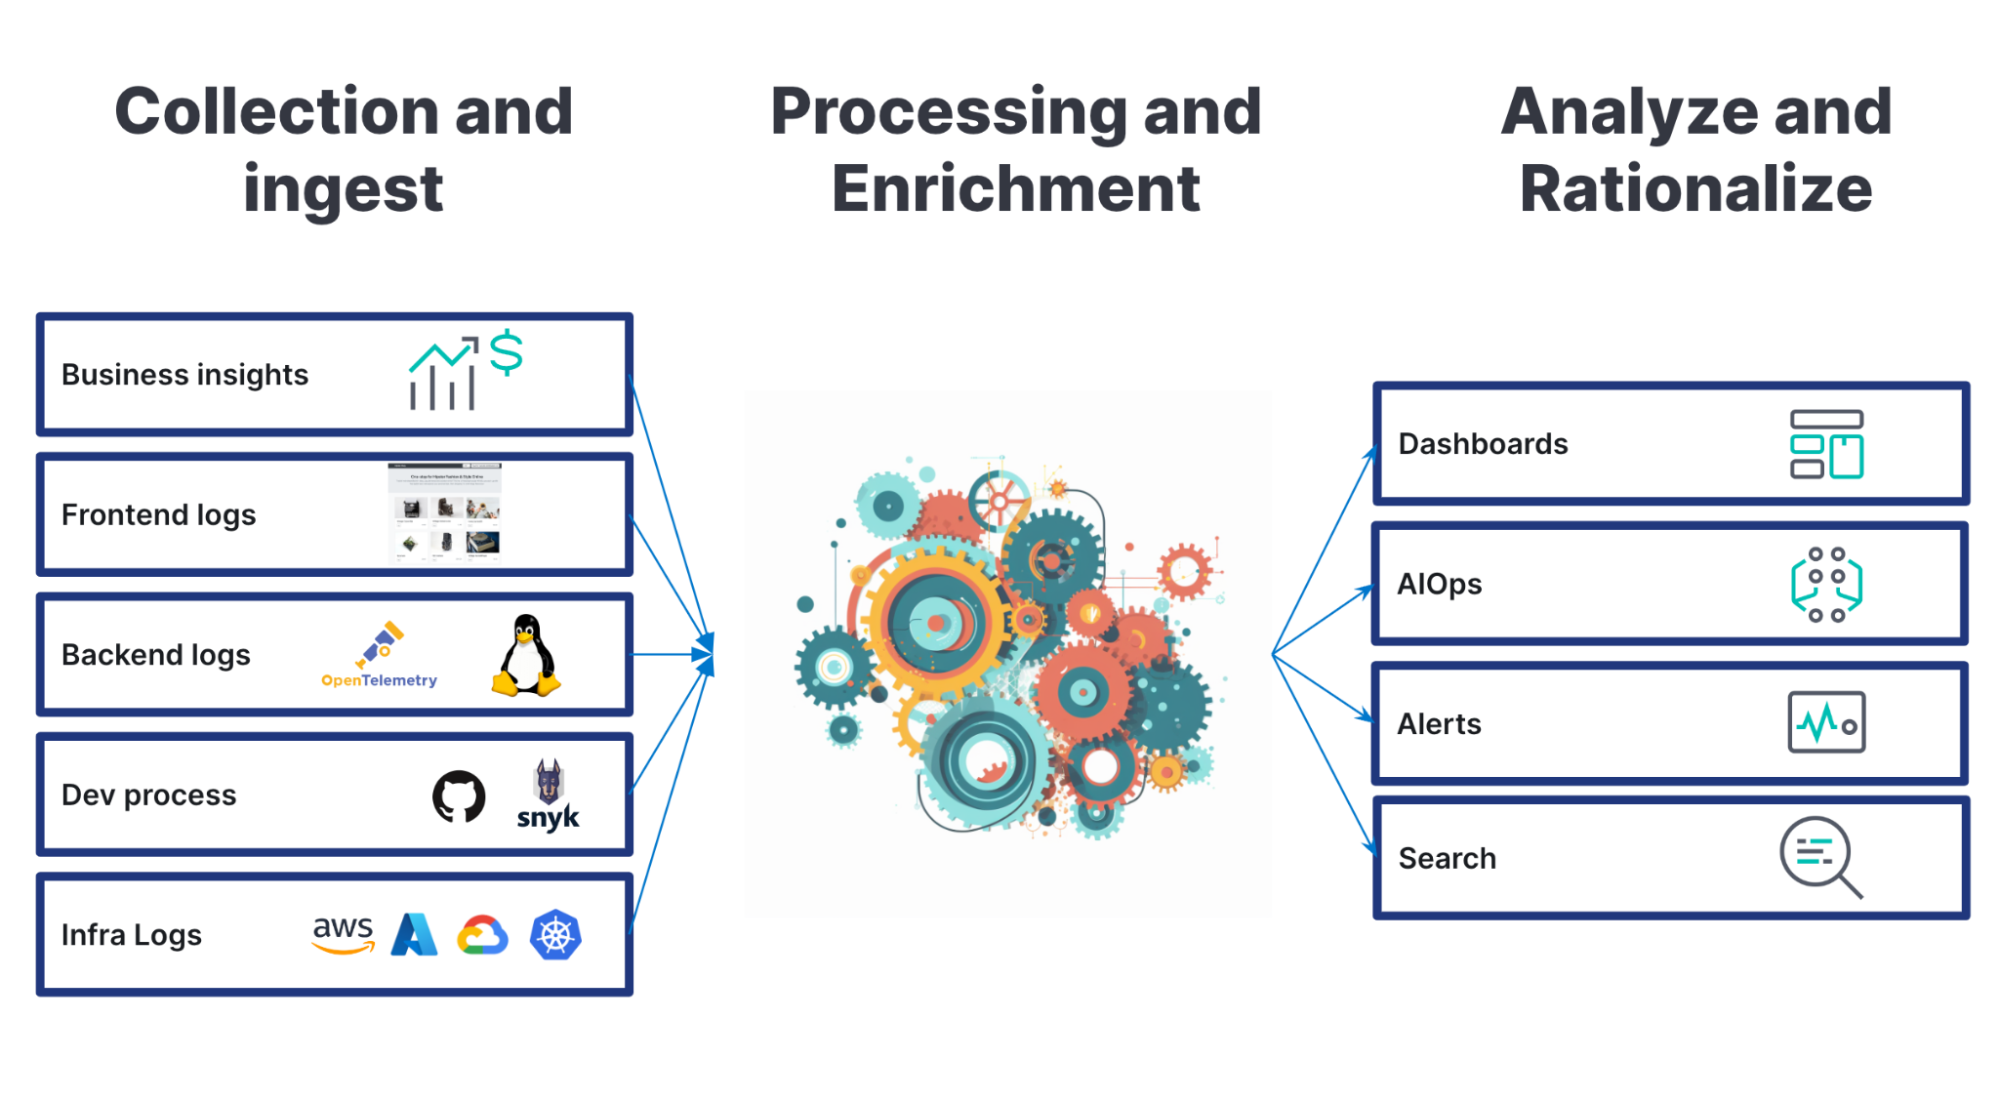
Let’s cover how logs should be collected and ingested, what is proper parsing and processing, and how you can analyze and rationalize the logs. Additionally we will also discuss how to enhance this journey with application performance monitoring (APM), metrics, and security events.
Log collection
The first step in the logging journey is to collect all the logs you have into a central location. This involves identifying all your applications and systems and collecting their logs.
One key aspect in log collection is to have the most amount of normalization across all of your applications and infrastructure. Having a common semantic schema is very important. Elastic contributed Elastic Common Schema (ECS) to OpenTelemetry (OTel), helping accelerate adoption of OTel-based observability and security. This is going to move to a more normalized way to define and ingest logs (including metrics and traces).
Another important aspect to log collection is ensuring you have enough ingestion capacity at a low cost. When making this assessment, you may want to be cautious about solutions that charge multiples for high cardinality data. Some observability solutions will charge heavily for this, which is why understanding scaling capabilities and costs is vital during this step.
Processing and enriching logs
Once you have collected your logs, you can begin to process the log files and bring them into a common schema. This helps standardize your logs and makes it easier to aggregate the most important information. A standardized schema also allows for easier data correlation across sources. In processing logs data into standardized schema, you need to consider:
- Most observability tools will have out-of-the box integrations to convert the data into a specific known schema. If no out-of-the-box integration is available, then parsing out information can be done using regular expressions or similar approaches.
- Managing the processing of logs is usually done in some kind of an ingest pipeline. You can utilize scalable and complex architectures involving streaming data pipelines with Kafka, Azure Service Bus, or Pulsar or even using processing frameworks like Logstash or Kafka Streams. There is no right or wrong, but our recommendation is to be careful with adding too much complexity here. There is a danger that if you add streaming data processing steps in here, you could end up with a multi-month project and a ton of code to maintain.
Elastic provides multiple ways to ingest (i.e. AWS Kensis Data Firehose) and processing (parsing unstructured logs, enriching logs, and even properly categorizing them).
Once data is ingested, there is a potential need to extract and enrich this data, and perhaps also to create metrics from the data in the log files. There are several ways to do this:
- Some observability dashboarding capabilities can perform runtime transformations to extract fields from non-parsed sources on the fly. This is generally called schema-on-read. This is helpful when dealing with legacy systems or custom applications that may not log data in a standardized format. However, runtime parsing can be time-consuming and resource-intensive, especially for large volumes of data.
- On the other hand, schema-on-write offers better performance and more control over the data. The schema is defined upfront, and the data is structured and validated at the time of writing. This allows for faster processing and analysis of the data, which is beneficial for enrichment.
Log analysis
Searching, pattern matching, and dashboarding
A logical and traditional next step is building dashboards and setting up alerting to help you monitor your logs in real time. Dashboards provide a visual representation of your logs, making it easier to identify patterns and anomalies. Alerting can notify you when specific events occur, allowing you to take action quickly. Using the power of full text search, it's easy to create metrics from logs. For example, you can search for the term "error," and the search capabilities will find all matching entries across all sources. The result can then be visualized or alerted on. Additionally you will also search your logs and look for patterns when dashboarding.
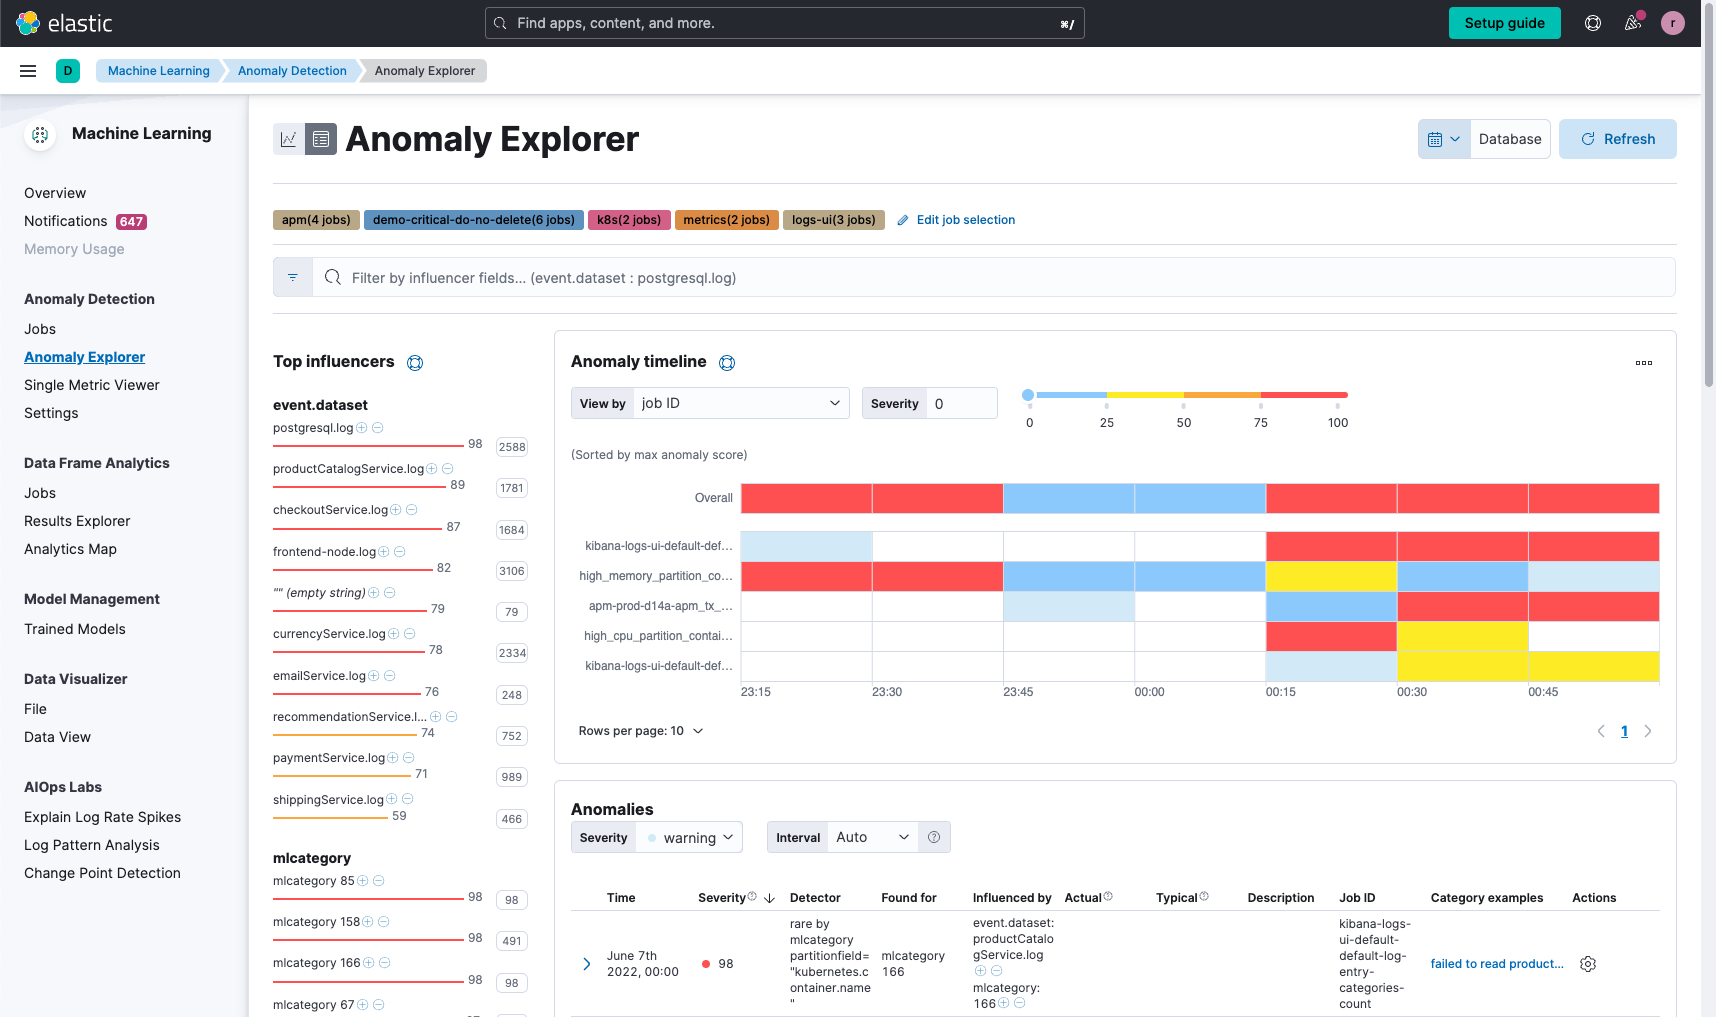
Machine learning can then be used to analyze logs and identify patterns that might not be visible through manual analysis. Machine learning can be used to detect anomalies in logs, such as unusual traffic or errors. Additionally, features like log categorization functionality to automatically keep track of what types of log data are being indexed and detect any changes in that pattern can be useful. This can be used to detect new application behavior or other interesting events that you might have missed otherwise.
Machine learning — finding the unknown-unknowns lurking in your log files
It is recommended that organizations utilize a diverse arsenal of machine learning algorithms and techniques, to help make it more likely that you can effectively uncover unknown-unknowns in log files.
Unsupervised machine learning algorithms, like clustering (x-means, BIRCH), time-series decomposition, bayesian inference, and correlation analysis, should be employed for anomaly detection on real-time data, with rate-controlled alerting based on severity.
By automatically identifying influencers, users can gain valuable context for automated root cause analysis (RCA). Log pattern analysis brings categorization to unstructured logs, while log rate analysis and change point detection help identify the root causes of spikes in log data. These methods combined offer a powerful approach to discovering hidden insights and issues within log files.
In addition to helping with RCA, finding unknown-unknowns and improving troubleshooting organizations should look for forecasting functionality to help them project future demand and calibrate business goals.
Enhancing the journey
Lastly, while collecting logs, you may want to also collect metrics or APM data. Metrics can provide you with insights into your system's performance, such as CPU usage, memory usage, and network traffic, and APM can help you identify issues with your applications, such as slow response times or errors. While not a requirement, especially metric data goes hand in hand with your log data and it’s incredibly easy to set up too. If you are already collecting logs from your systems, collecting metrics in addition will usually not take you longer than a few minutes. As operations, you are always tracking the security of not only your deployment, but also who and what was deployed, so adding and using security events with APM and metrics helps complete the picture.
Structured logs vs. unstructured logs?
A general challenge with the logging journey is managing unstructured and structured logs — in particular, parsing during ingest.
Managing logs with known schemas
Luckily, some tools come with a wide range of built-in integrations for popular sources, such as Apache, Nginx, Docker, and Kubernetes, to name a few. These integrations make it easy to collect logs from different sources without the need to spend time building custom parsing rules or dashboards. This saves time and effort and allows teams to focus on analyzing the logs rather than parsing or visualizing them.
If you don’t have logs from popular sources, such as custom logs, you may need to define your own parsing rules. Many observability logging tools will give you this capability.
Hence, structured logs are generally better than unstructured logs as they provide more value and are easier to work with. Structured logs have a predefined format and fields, making it easier to extract information and perform analysis.
What about unstructured logs?
Full-text search capability in your observability tool can help reduce concerns about the potential limitations of unstructured logs. Full-text search is a powerful tool that can be used to extract meaningful information from unstructured logs by indexing the logs. Full-text search allows users to search for specific keywords or phrases within the logs, even if the logs are not parsed.
One of the main advantages of indexing logs by default is that it helps make them searchable in an efficient manner. Even large volumes of data can be quickly searched through, in order to find specific information that you are looking for, if it has been indexed in advance. This can save time and effort when analyzing logs and can help you identify issues more quickly. By having everything indexed and searchable, you don’t have to write regular expressions, learn a complex query language, or wait a long time for a search to complete.
Should you move your logs into traces?
Logs have long been a cornerstone of application monitoring and debugging. However, while logs are an indispensable part of any log monitoring tool strategy, they are not the only option available.
Traces, for example, are a valuable addition to logs and can provide even deeper insights into specific transactions or request paths. In fact, if implemented correctly, traces are complementary to logging as an additive means of instrumentation for an application (versus infrastructure), especially in the context of cloud-native environments. Traces can offer much more contextual information and especially excel at tracking dependencies in your environment. Compared to log data, any ripple effects are visible much more easily in trace data, as a single interaction is tracked end to end across your services.
Despite the advantages that tracing can offer, it's important to consider the limitations of using tracing. Implementing tracing is only possible for applications that you own, and you will not get traces for infrastructure because it's still limited to applications. Not all developers are fully on board with tracing as a replacement for logging yet. Many developers still default to logging as the primary means of instrumentation, which can make it difficult to fully embrace tracing as a monitoring strategy.
Therefore, it’s important to have a combined logging and tracing strategy, where traces provide coverage for newer instrumented apps, and logging will support legacy applications and systems you don’t own the source code for, as well as understanding the status of systems you don’t own.
Improving operational efficiency for logs
There are three main areas that can reduce operational efficiency when managing logs:
- Significant time transforming logs
- Managing storage and retrieval of log information
- When to delete or what to delete from logs
We will discuss strategies to manage these below.
Reducing time spent in transforming data
With the large volumes of logs with varying sets of schemas, and even unstructured logs, organizations may spend more time on unnecessary data transformations than understanding the issue, analyzing root cause, or optimizing operations.
With data structured according to a common schema, operations teams will be able to focus on recognizing, resolving, and preventing issues, along with lowering mean time to resolution (MTTR). Operations can also reduce costs by not having duplicated data and not having to process data for normalization.
The industry is on a journey to achieve this normalization through the OpenTelemetry Semantic Convention project, which is trying to achieve a common schema for logs, metrics, traces, and security events. Logs in particular are stronger due to the recent contribution of Elastic Common Schema (ECS) to OpenTelemetry, which helps strengthen the common schema journey.
A simple illustrative example is when a client’s IP address is sent from multiple sources that are either monitoring or managing telemetry about the client.
src:10.42.42.42
client_ip:10.42.42.42
apache2.access.remote_ip: 10.42.42.42
context.user.ip:10.42.42.42
src_ip:10.42.42.42Having an IP address represented in multiple ways introduces complexities in analyzing potential problems or even identifying them.
With a common schema, all the incoming data is in a standardized format. Taking the above example, each of the sources would identify the client’s IP address the same way.
source.ip:10.42.42.42This helps reduce the need to spend time transforming data.
Centralized vs. decentralized log storage
Data locality is an important consideration when it comes to managing log data. The costs of ingressing and egressing large amounts of log data can be prohibitively high, especially when dealing with cloud providers.
In the absence of regional redundancy requirements, your organization may not have a compelling reason to send all log data to a central location. Your logging solution should provide a way to allow your organization to keep its log data local to the datacenter where it was generated. This approach helps reduce the ingress and egress costs associated with shipping large amounts of data across the network.
Cross-cluster (or cross deployment) search functionality enables users to search across multiple logging clusters simultaneously. This helps reduce the amount of data that needs to be transferred over the network.
Cross-cluster replication is another useful feature that you may want to consider if your organization has the need to maintain business continuity in the event of a disaster. With cross-cluster replication, organizations can ensure that their data is available even in the event of an outage in one of their data centers by automatically copying it to a second destination. Usually this approach is only used for the most critical data, while taking advantage of the data locality described above for the largest data sources.
Another related topic that is worth considering is vendor lock-in. Some logging solutions lock down data after it has been ingested, making it difficult or impossible to extract the data if the organization wants to switch vendors.
This is not the case with every vendor, and organizations should check to make sure they have full access to all their raw data at any time. This flexibility is critical for organizations that want to be able to switch vendors without being locked into a proprietary logging solution.
Dealing with large amounts of log data — Log everything, junk everything, or cut down on usage?
Dealing with large amounts of log data can be a challenging task, especially as the amount of data generated by systems and applications continues to grow. Additionally, compliance requirements may mandate the logging of certain data, and in some cases, logging may not be under your control for all systems. Reducing the amount of data may be seem impractical, but there are a couple of optimizations that could help:
- Collect everything, but develop a logs deletion policy. Organizations may want to evaluate what data it collects and at what time.Discarding data at the source could lead to concerns later on if you find that you need that data for troubleshooting or analysis. Assess when to delete data. If possible, set up policies to automate the deletion of old data to help reduce the need for manually deleting logs and the risk of accidentally deleting logs that you still need.
A good practice is to discard DEBUG logs or even INFO logs earlier and delete dev and staging environment logs sooner. Depending on the product you use, you have the flexibility to set the retention period for each log source. For example, you can keep staging logs for seven days, dev logs for one day, and production logs for a year. You could even go further and split it by application or another attribute. - A further optimization is to aggregate short windows of identical log lines, which is especially useful for TCP security event logging, for example. Simply aggregate log lines that are identical and produce a count, plus a start and end timestamp instead. This could easily be unwrapped in a way that provides enough fidelity and will save a lot of storage space. It is possible to use preprocessing tools to do this.
- For applications and code you control, you might consider moving some logs into traces, which will help reduce the log volume. But the traces will still constitute extra data.
Bringing it together
In this post, we provided a view of the logging journey and several challenges to consider in this article. In covering the logging journey, which involves three basic steps — collecting and ingesting, parsing and processing, and analyzing and rationalizing — we emphasized the following:
- It is important to ensure that there are no blind spots in your infrastructure during the log collection stage and to focus on making structured logs at the source.
- Extracting data and enriching logs can be achieved through schema-on-read or schema-on-write approaches, and machine learning can be used to analyze logs and identify patterns that might not be visible through manual analysis.
- Organizations should also collect metrics or APM data to enhance their logging journey.
We discussed several key challenges:
- Structured logs can be easier to work with and provide more value, but unstructured logs can be managed through full-text search capabilities.
- Traces can provide deeper insights into specific transactions and dependencies, potentially replacing logging as the primary means of instrumentation, but a combined logging and tracing strategy is important due to limitations and developer adoption.
- Organizations can help improve operational efficiency for logs by focusing on reducing time spent transforming data, choosing between centralized or decentralized log storage, and dealing with large amounts of log data through implementing a logs deletion policy and aggregating short windows of identical log lines.
Additional resources
Learn more about the logging journey steps and how to manage some of the challenges discussed above in the following links:
Originally published April 28, 2023; updated September 19, 2023.
Share
- Share on Twitter
Share on Twitter
- Share on LinkedIn
Share on LinkedIn
- Share on Facebook
Share on Facebook
- Share by Email
Share by Email
- Print this page
Print