Log monitoring and unstructured log data, moving beyond tail -f

 Share on Twitter
Share on Twitter

 Share on LinkedIn
Share on LinkedIn

 Share on Facebook
Share on Facebook

 Share by Email
Share by Email

 Print this page
Print
Log files and system logs have been a treasure trove of information for administrators and developers for decades. But with more moving parts and ever more options on where to run modern cloud applications, keeping an eye on logs and troubleshooting problems have become increasingly difficult.
While it’s often possible to ssh into a server and run commands like tail -f, this approach doesn’t scale for most developers and administrators. Even if you’re good on the command line, you might be able to find what you’re looking for in a log file using awk and grep and could even calculate some simple statistics around how often certain errors occur. But what if the applications are running across hundreds of servers or Kubernetes pods? Or even worse, what if the applications are split across multiple cloud providers, with some running in serverless frameworks that may not even offer the option to simply tail a file?
Proper log management can solve problems like these, easily and cost effectively. By collecting and storing logs on an enterprise platform like Elastic, analyzing them becomes an easy and simple task.
In this series of blog posts, we’ll walk you through some best practices when it comes to log monitoring, log analytics, and visualizations for Elastic Observability. Let’s start with the basics: collecting log data as well as dealing with unstructured data.
If you would like to follow along and try this example yourself, download the dummy log file that we’re using in this post!
Ingesting unstructured log data for Elastic Observability
“””
2021-02-02T22:04:44.093Z INFO Returning 3 ads
2021-02-02T22:05.32 213Z INFO Returning 1 ads
2021-02-02T22:07:41.913Z INFO Returning 2 ads
“””Unstructured log data is the type of telemetry data most commonly logged by applications. All it means is that there’s no clear machine readable structure to the log lines emitted by the application, which brings some challenges. That being said, even unstructured data is good data and it will be very useful for troubleshooting and investigations.
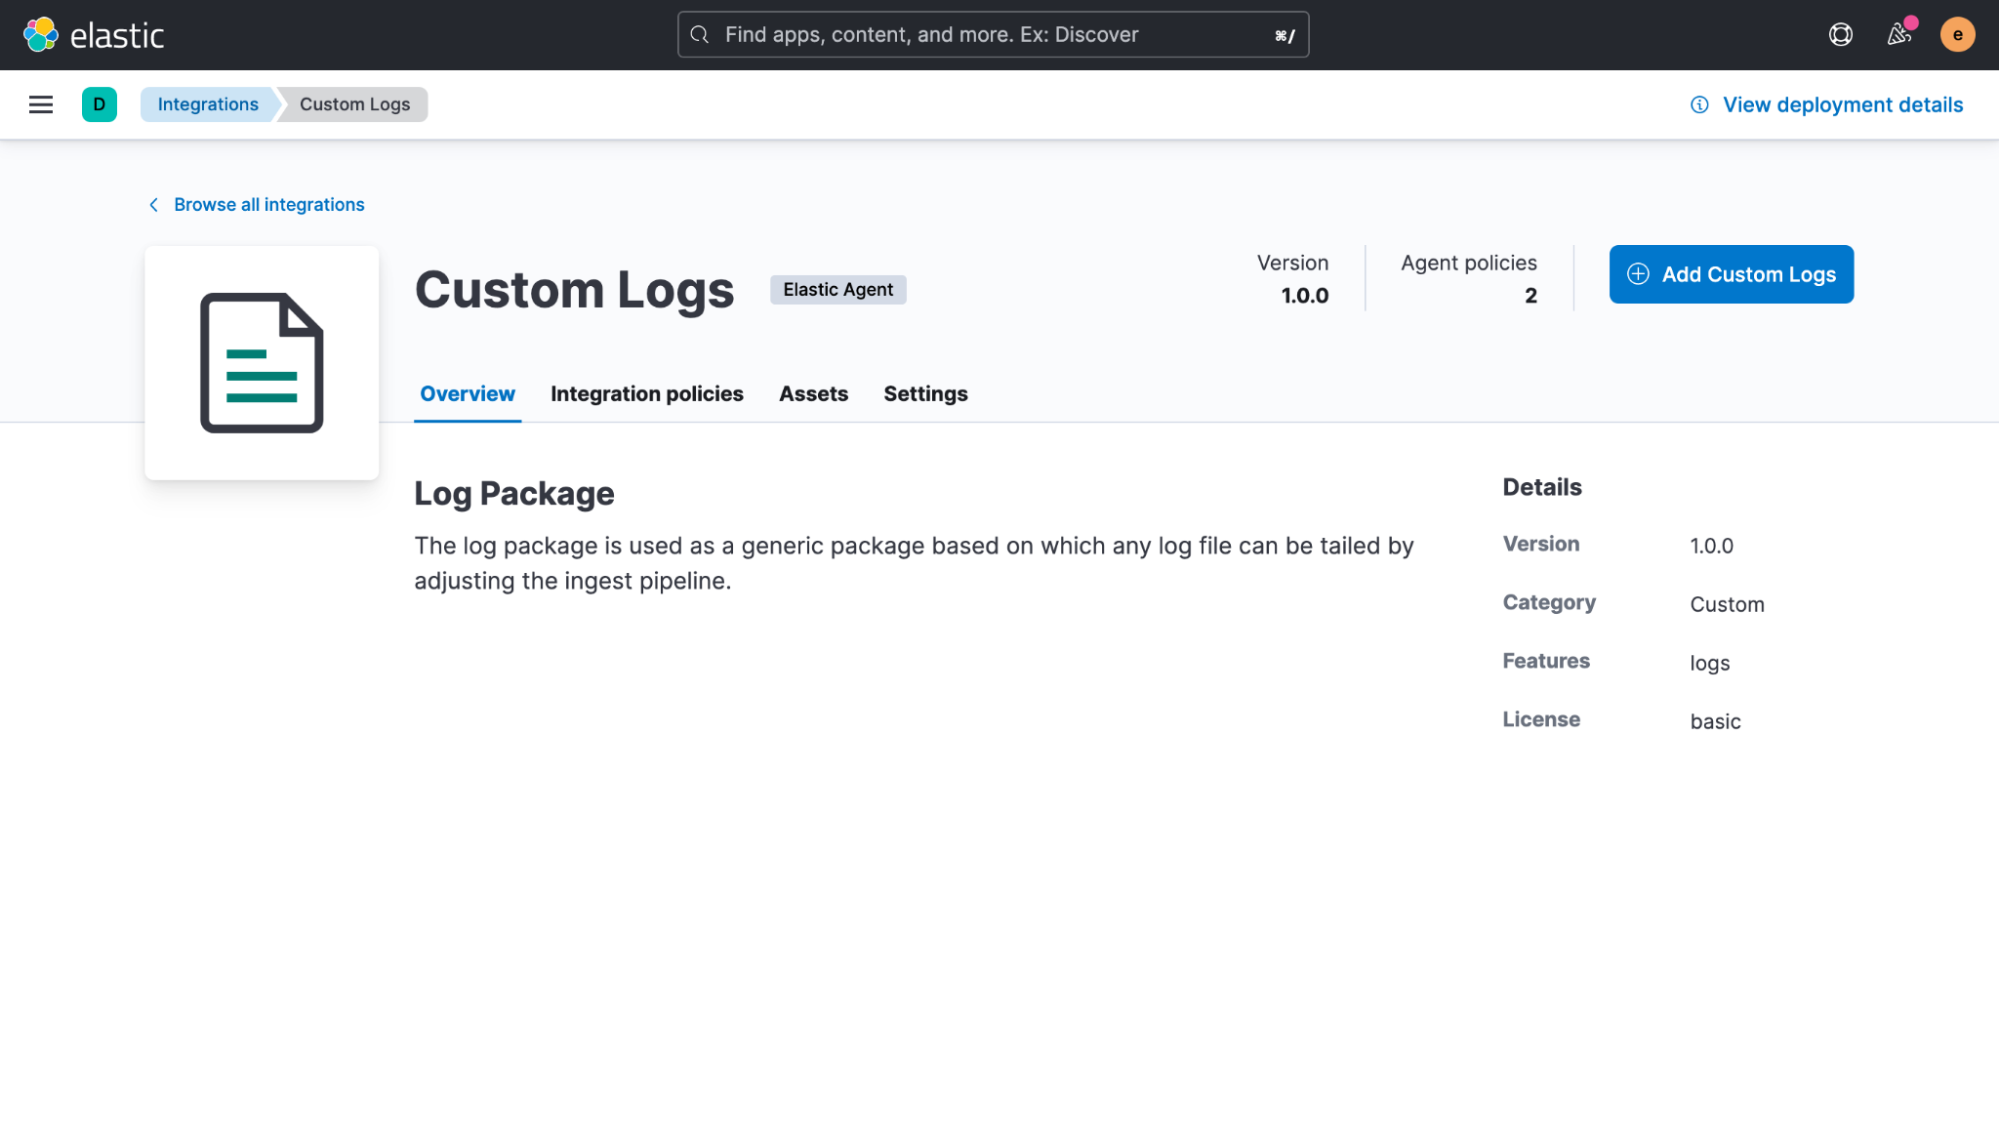
Let’s walk through a quick example of collecting a custom log file from one of your servers.
We will be using the Elastic Agent to read a simple log file from a server. We will just use the “Custom Logs” integration of it, but if you have other data sources that you want to onboard, take a look at the hundreds of other Elastic integrations we have available!
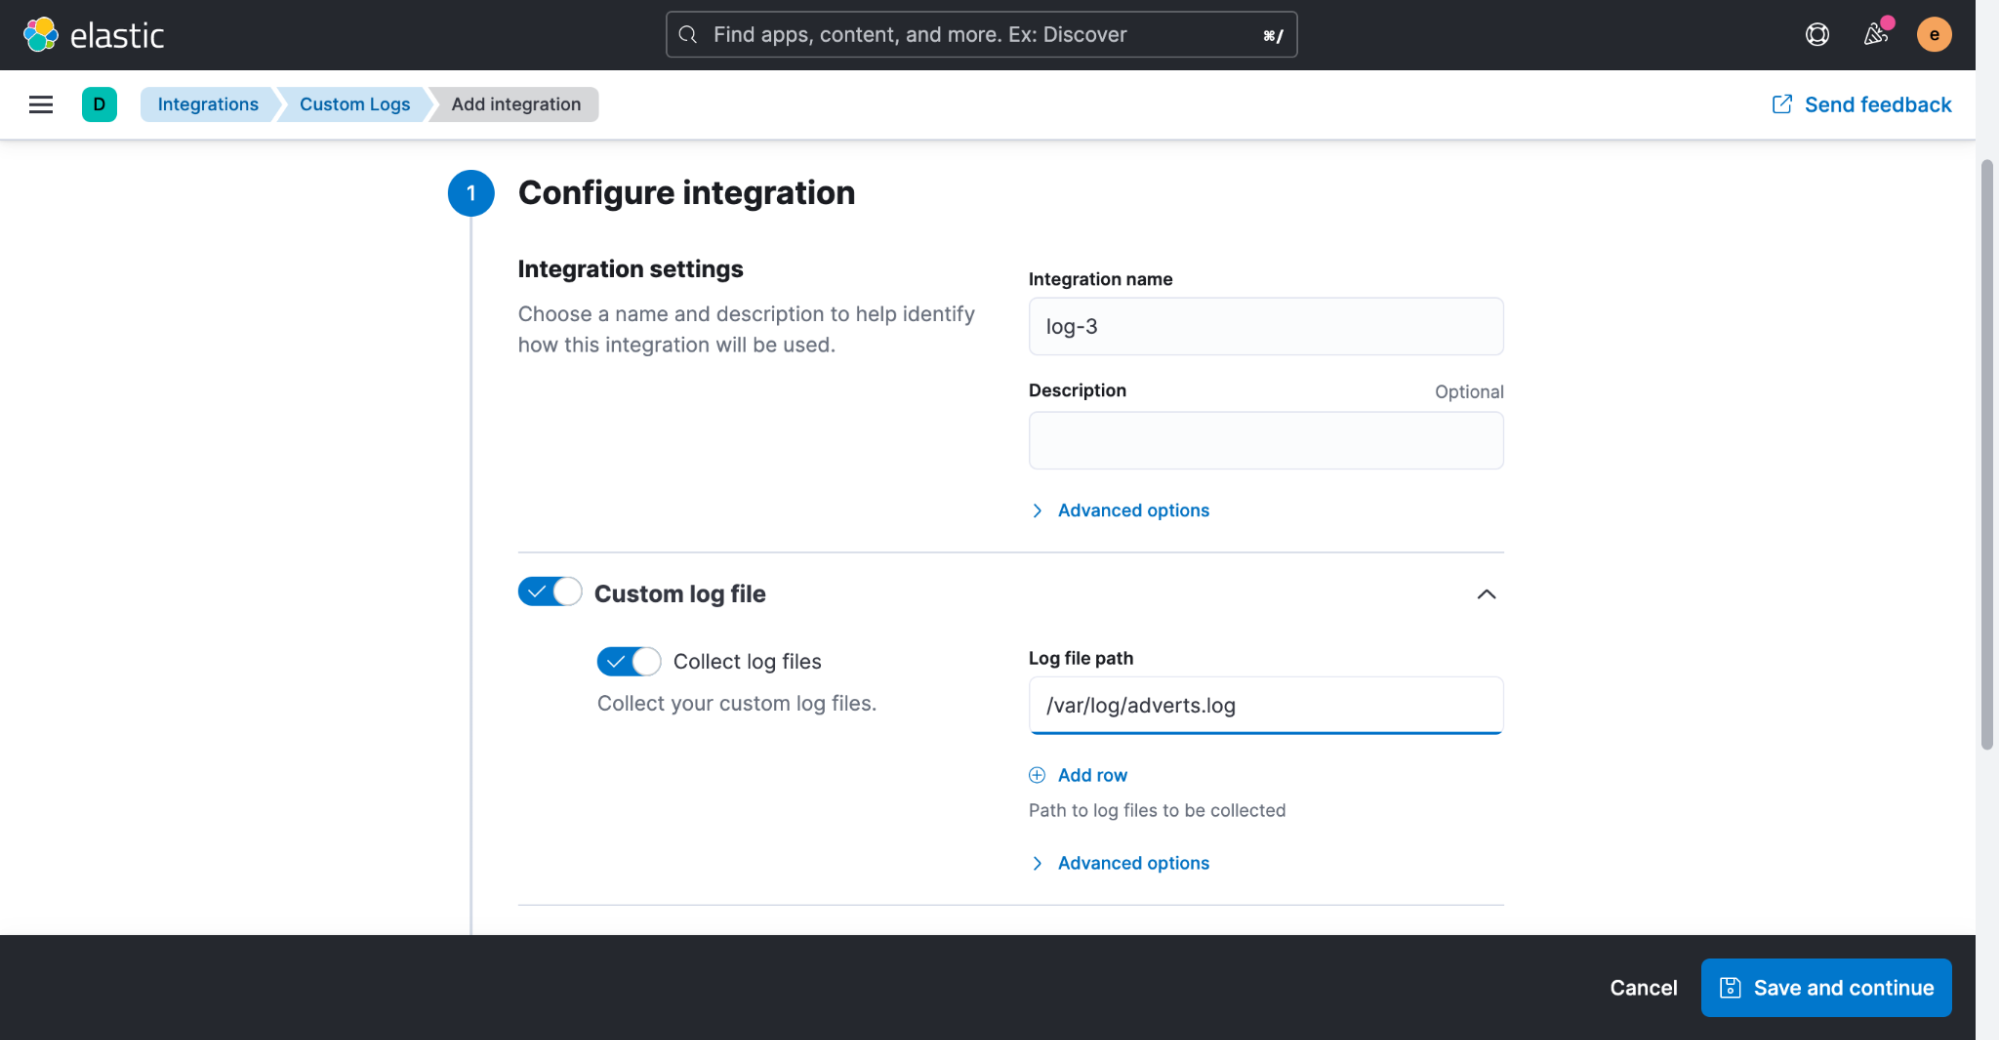
The only setting that we will need to adjust for now is the path of our log file. In this example, it’s “/var/log/adverts.log.”
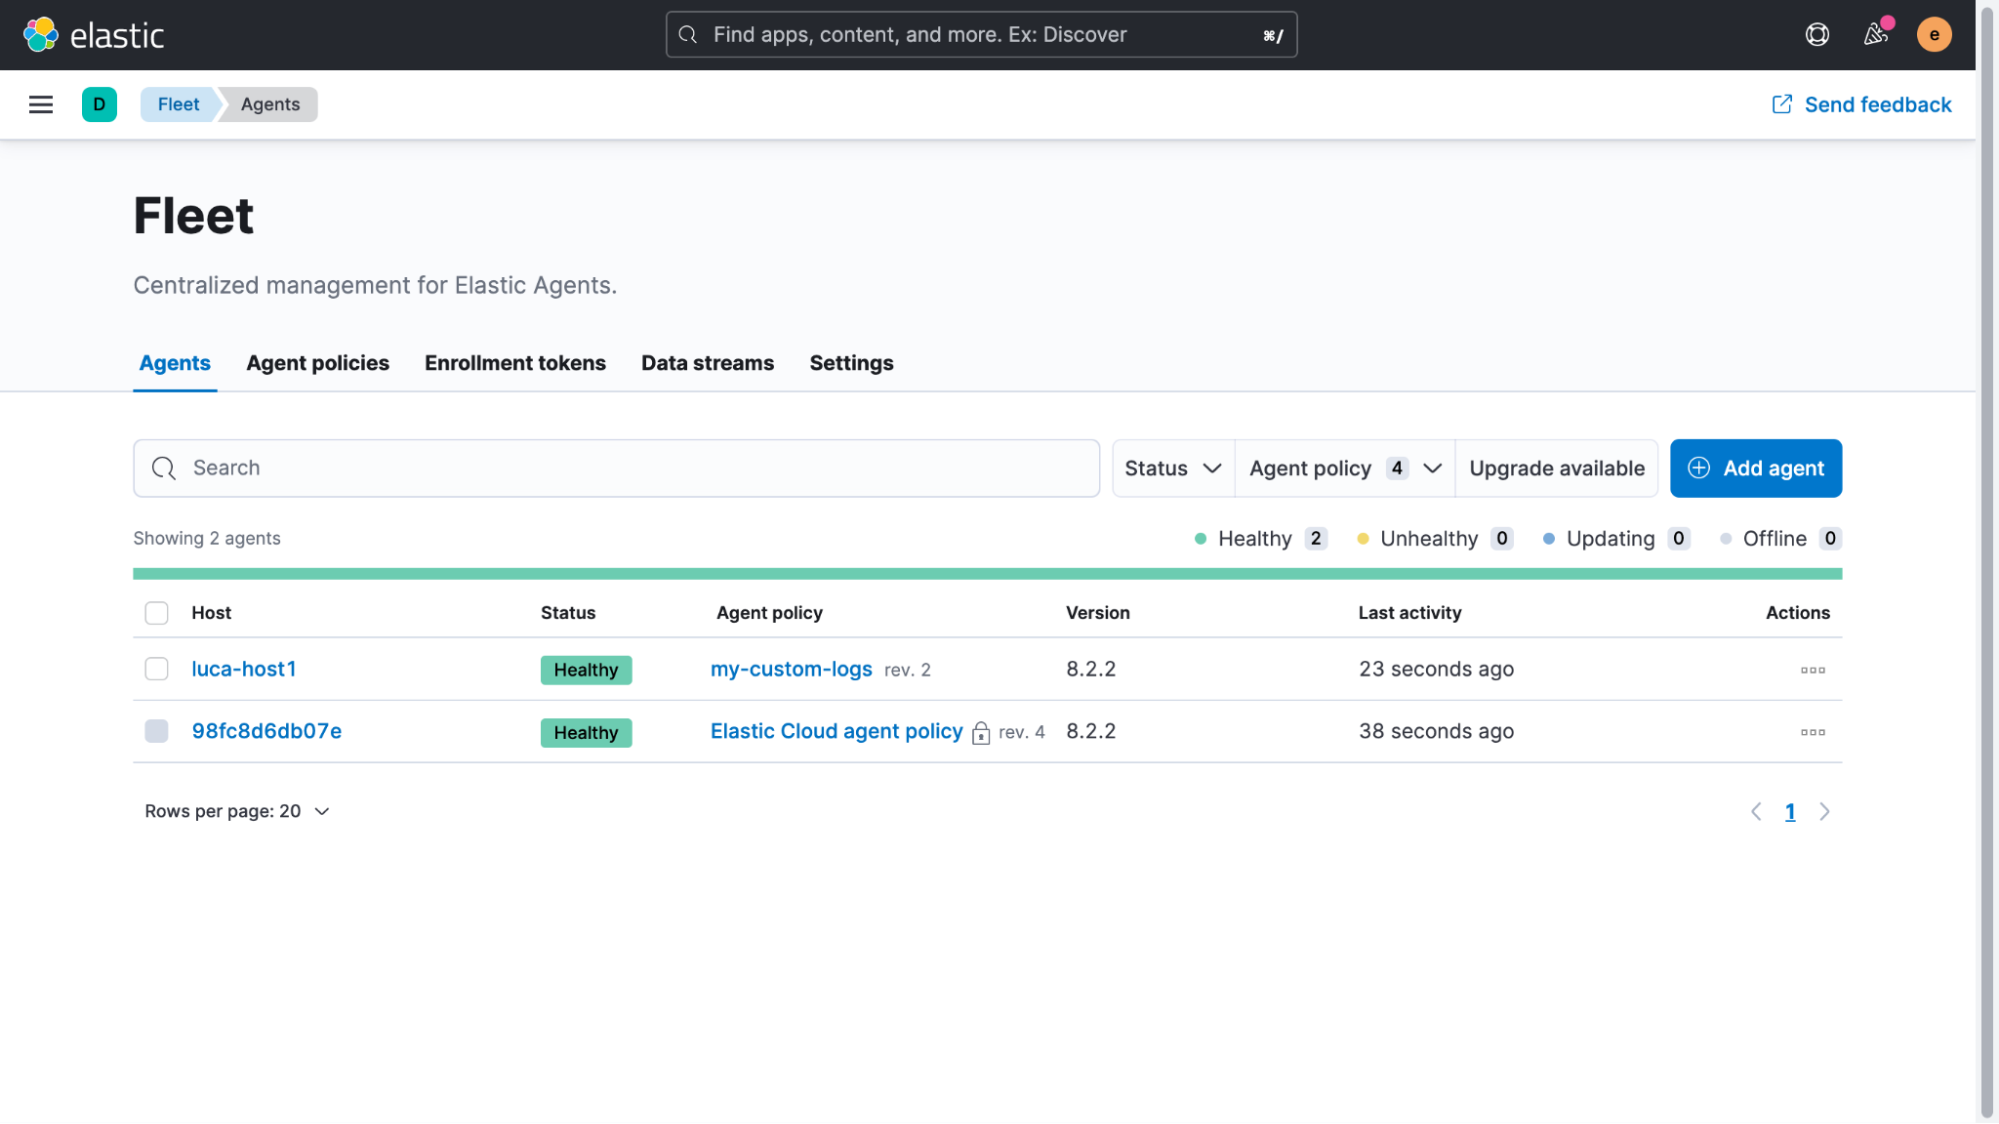
Once the integration has been added, we’re asked if we’d like to deploy Elastic Agent to one of our hosts now.
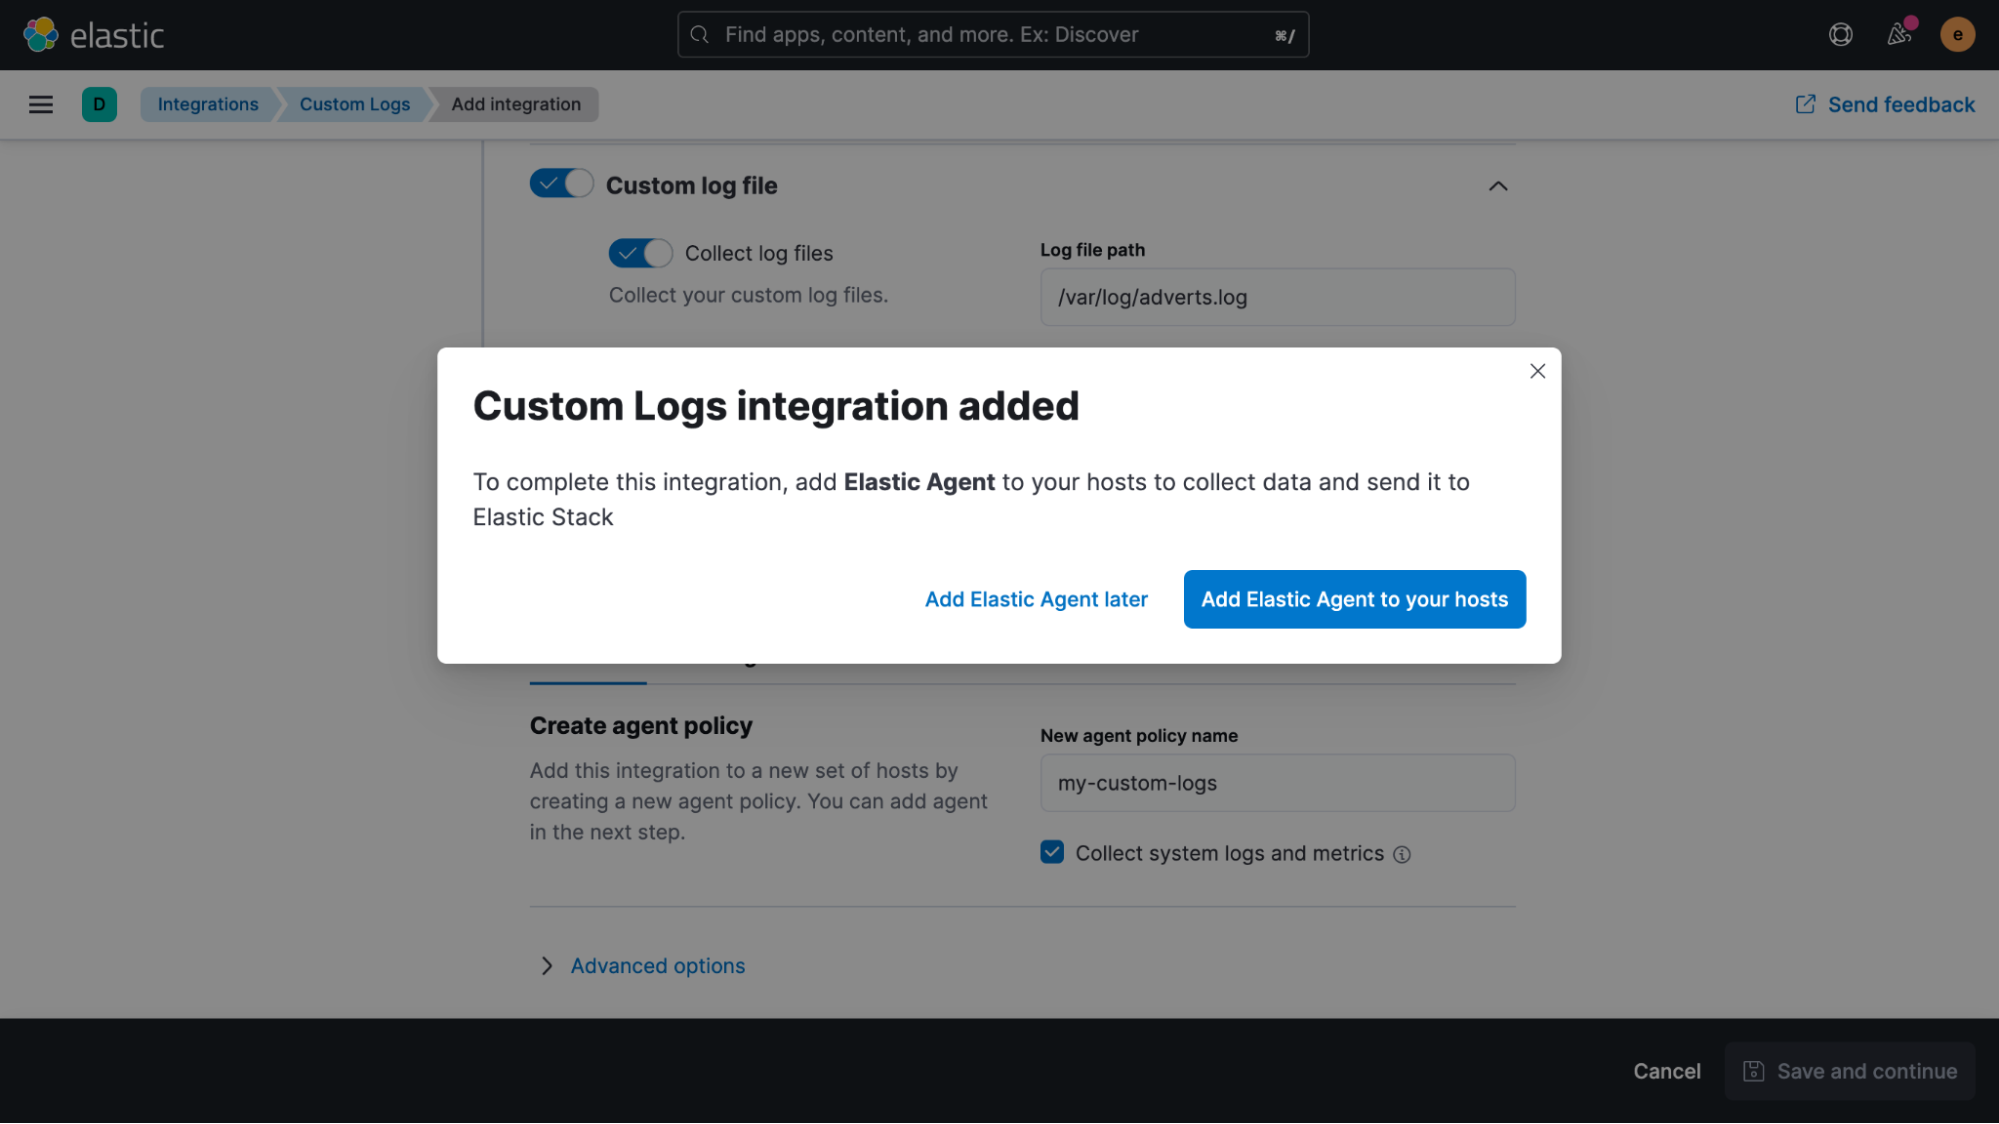
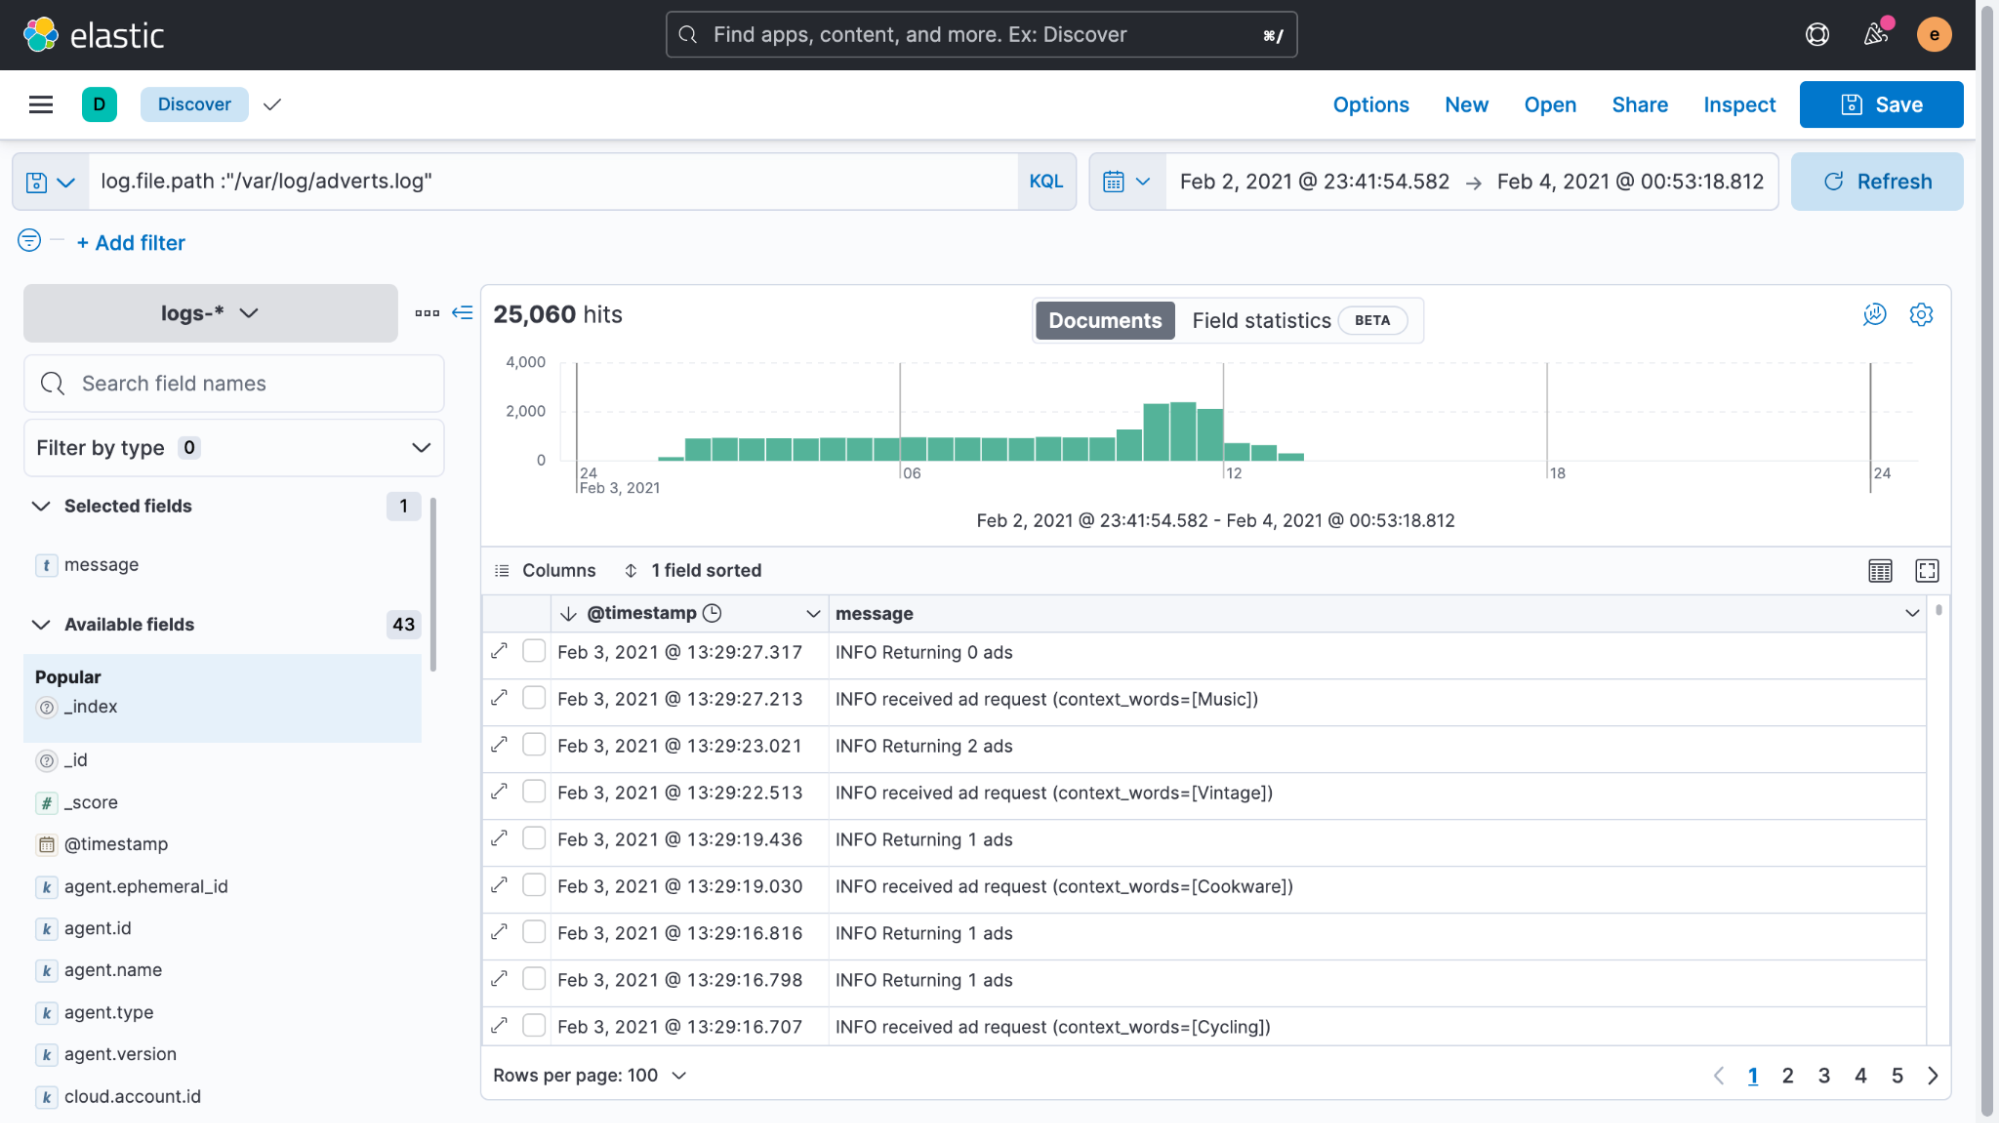
Clicking the blue button and following the instructions, it only takes a few seconds until the agent is successfully enrolled. Once data is flowing into Elasticsearch, we can take a look at it in the Discover UI.
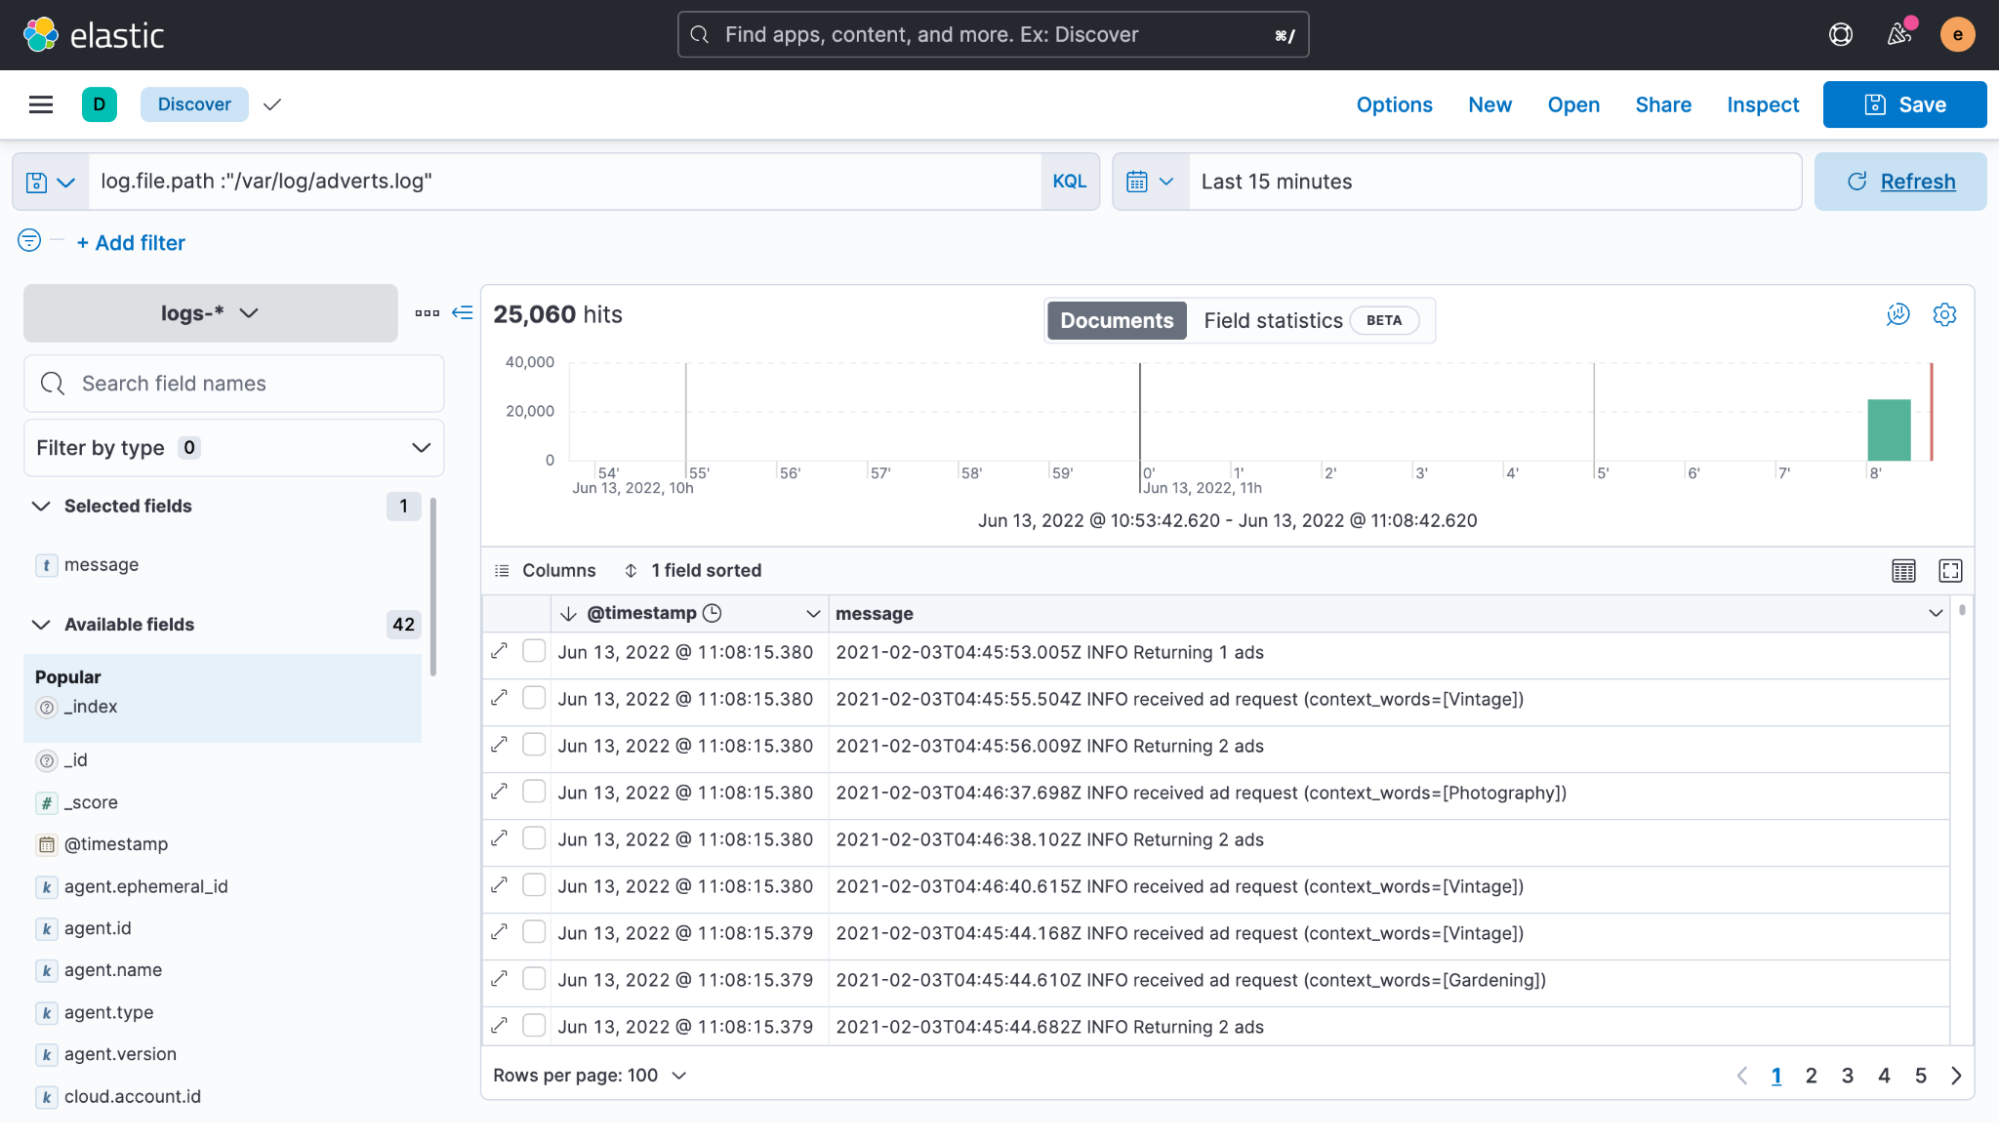
The good news is that we managed to easily get our log file data indexed. Unfortunately, it’s all shown as if it’s recent data, even though the timestamps in the logs say something entirely different.
Whenever Elastic Agent or Filebeat reads unstructured data, it automatically adds a timestamp field to it with the current time. In most cases this works well, as log data is almost immediately collected after an entry has been written to a file. However, if there’s a delay or if older files are being processed, then having timestamps like these can be misleading. We talked a lot about timestamps in this Considerations for timestamps in centralized logging blog if you’d like to learn more.
For now, let's try to get this problem fixed first.
As a general recommendation, the only step that you should take when collecting unstructured data like this is to extract the timestamp when the log was written.
The easiest way to accomplish this is to use an ingest pipeline. But before we get started, we will copy a single line of our logs and head over to the “Management > DevTools > Grok Debugger” section of Kibana. In this UI, we can easily create and test an expression that matches our custom log format. Right now we’re only interested in correcting the timestamp, but you might be able to tell how this technique can be useful in other ways.
To match a log, use the following sample data and grok pattern to simulate and test if the structured data is confirmed good.
Sample Data:
2021-02-03T04:45:53.005Z INFO Returning 1 ads


Grok Pattern:
%{TIMESTAMP_ISO8601:timestamp} %{GREEDYDATA:message}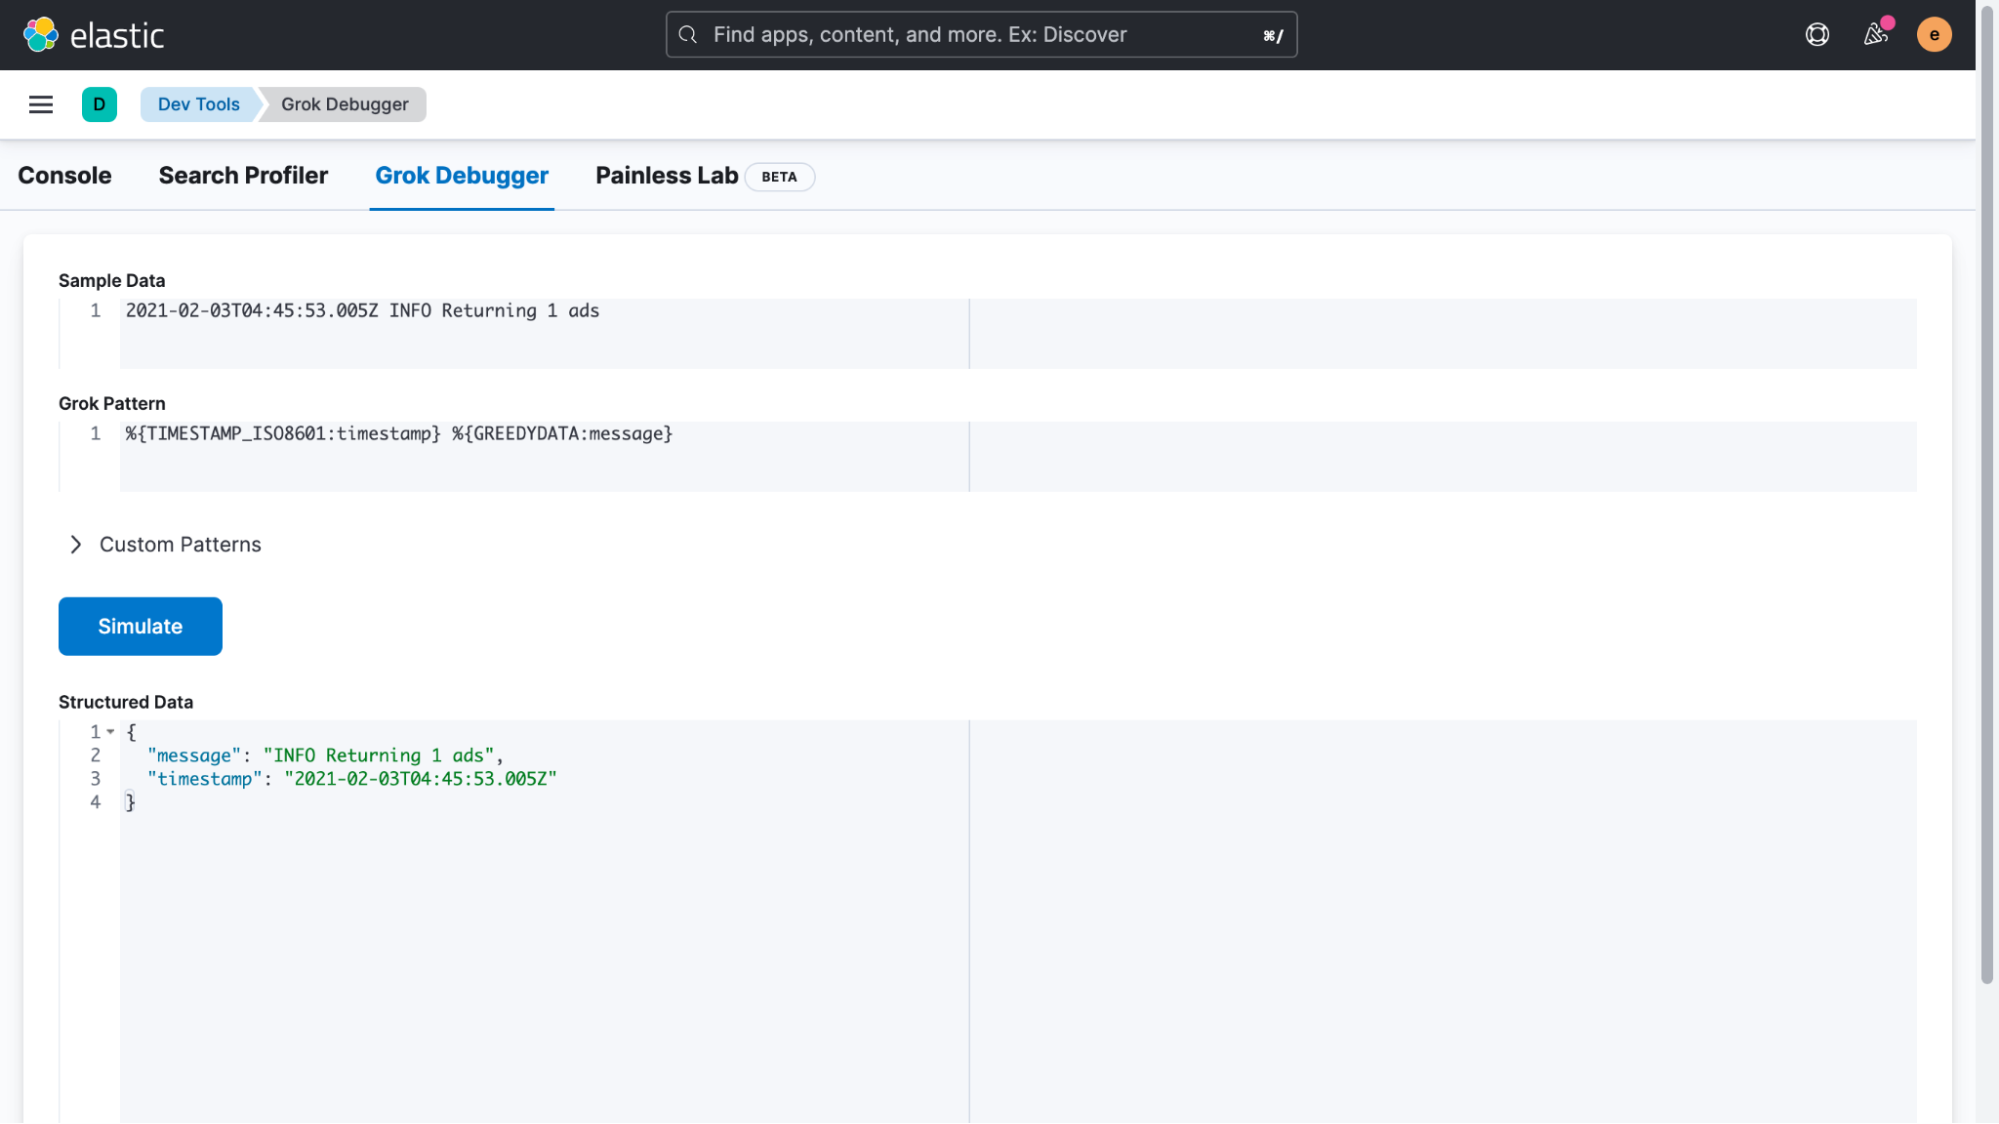
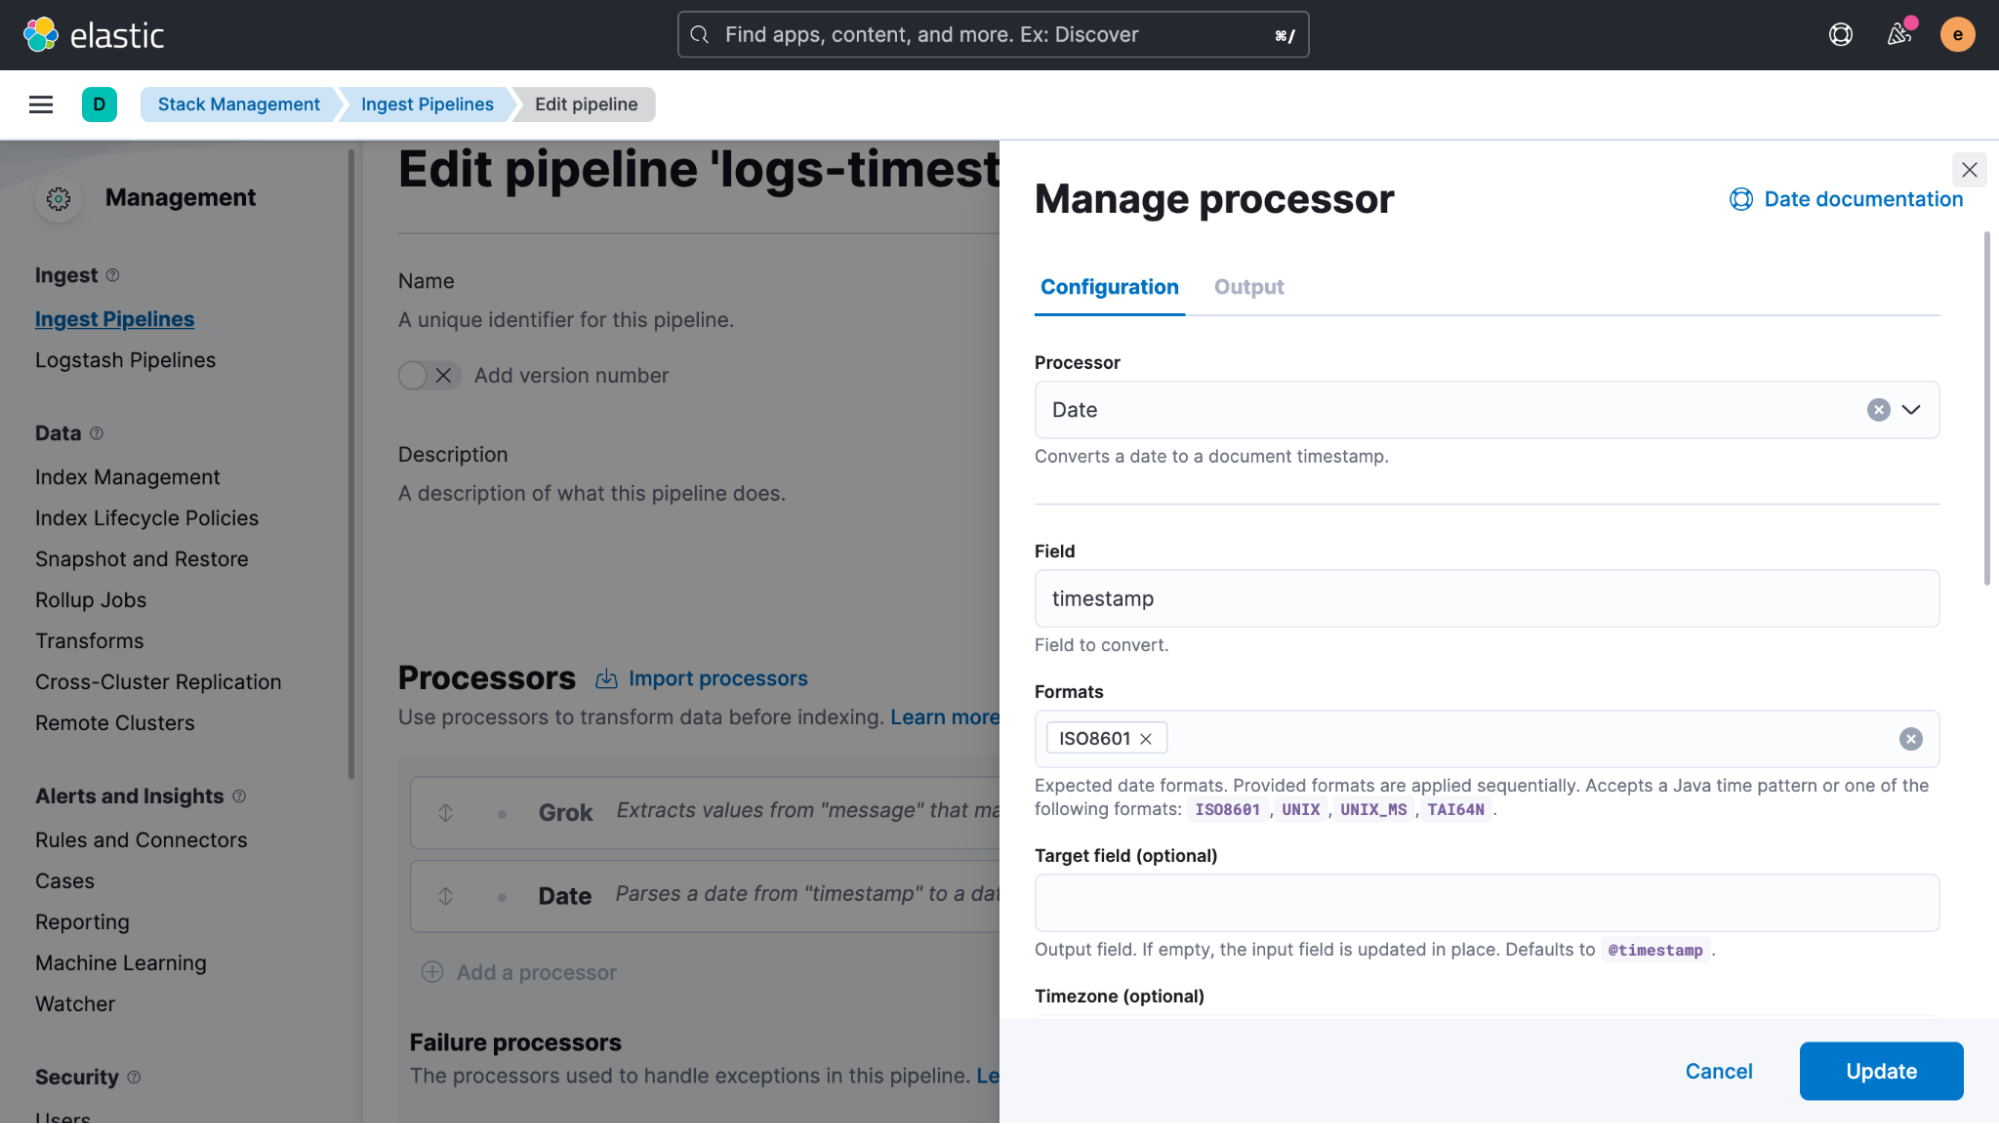
Once the structured data returned is confirmed as good, copy the Grok pattern and head over to the “Management > Stack Management > Ingest Pipelines” UI, where we create a new pipeline and add a Grok processor and a date processor. In our example, we will call this pipeline ‘logs-timestamp.'
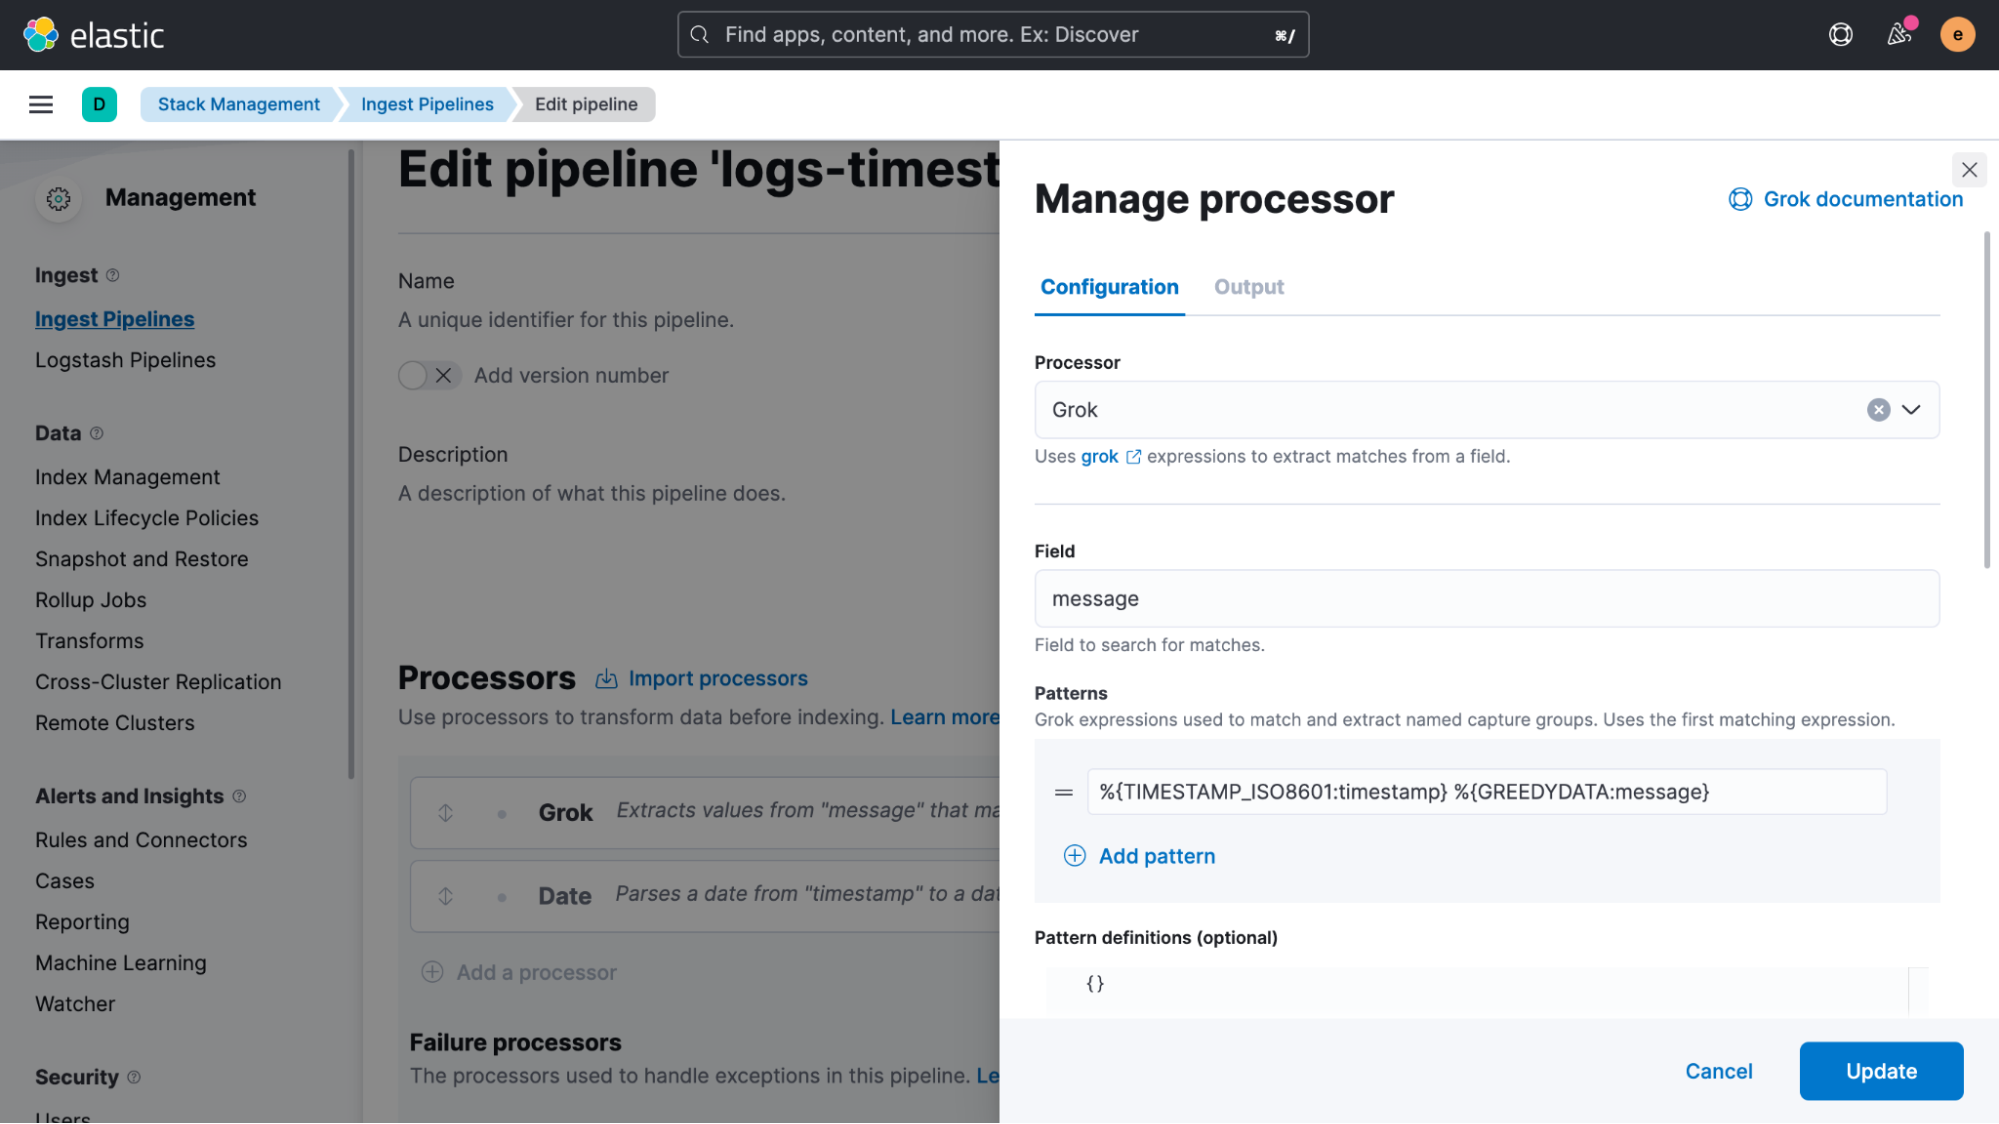
Scroll down in the Grok processor definition and enable “Ignore failure” as well as “Ignore missing.” This is a very important step to avoid blocking the pipeline if failures happen.
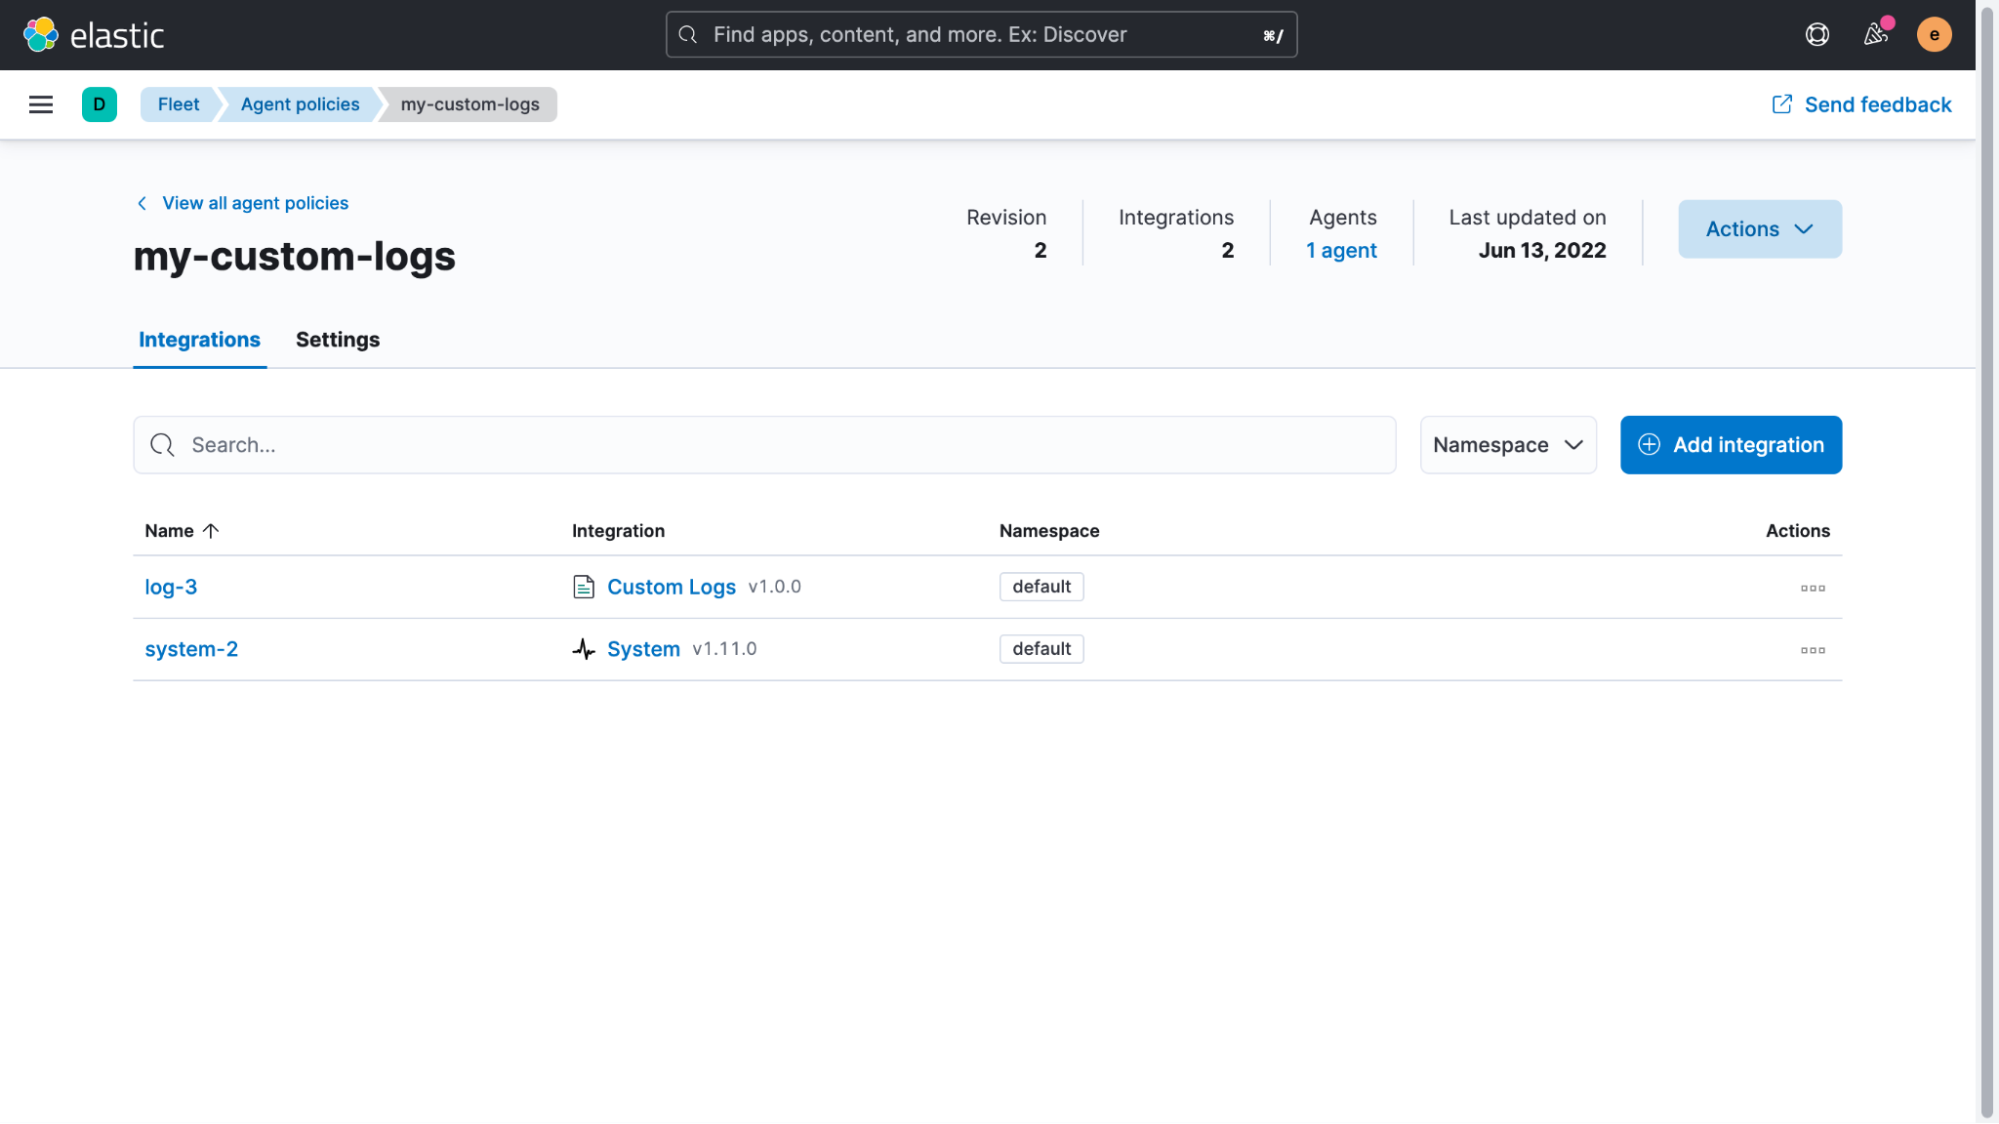
We’re almost done. We have only two steps left to ensure that live data is properly handled as well as fixing the old data that was already indexed. Starting with the live data first, we will go to “Management > Fleet” and select the Agent Policy that we created earlier. In the policy view, we then click on the name of the custom logs integration in order to edit it.
Expanding the “Custom log file” section and then the “Advanced options,” we can add “pipeline: logs-timestamp” as a custom configuration.
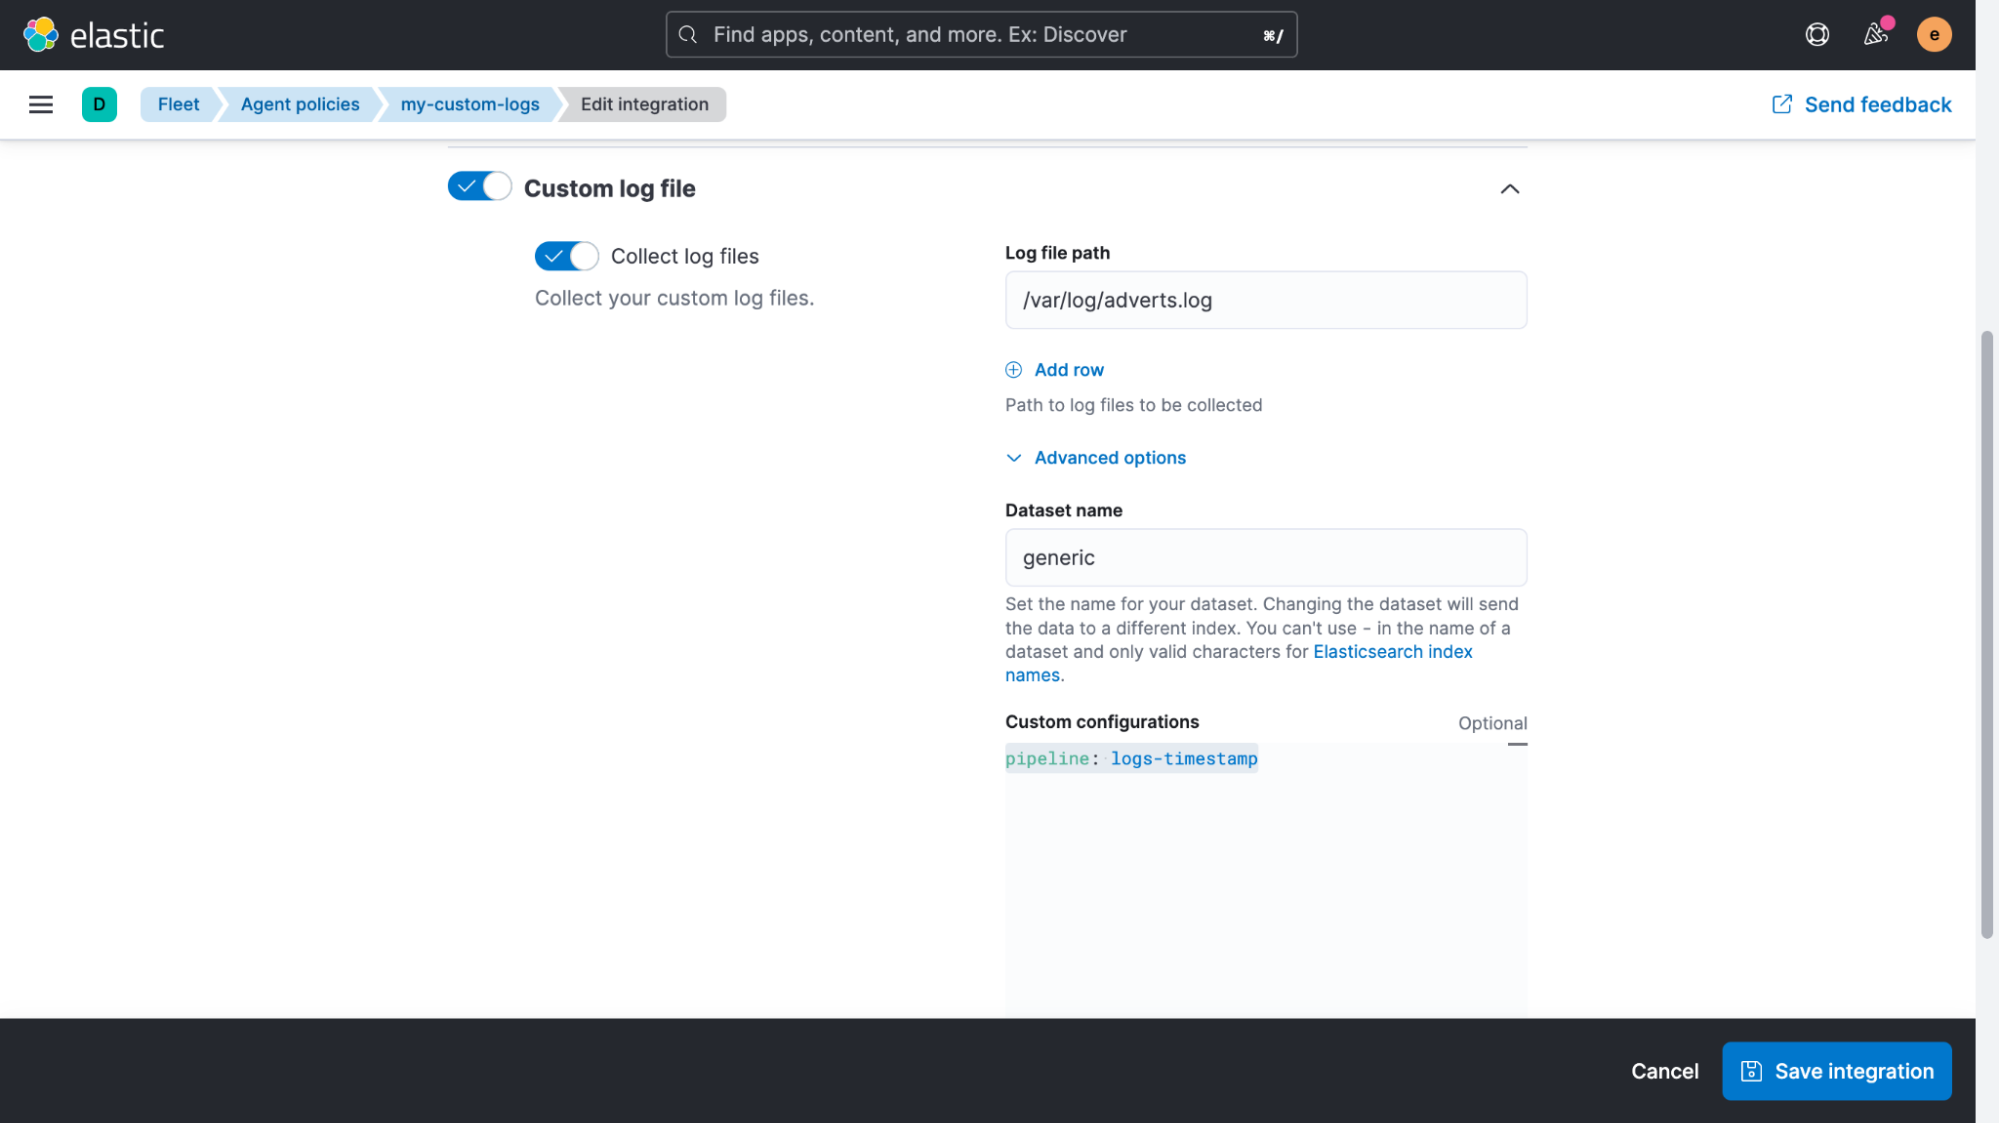
After saving this configuration, all live data will pass through the pipeline and the timestamp will be extracted.
Now we just need to fix the already indexed data. All that is needed here is a single request that we execute in “Management > DevTools > Console.”
POST logs-generic-default/_update_by_query?pipeline=logs-timestamp
{
  "query": {
    "term": {
      "log.file.path": {
        "value": "/var/log/adverts.log"
      }
    }
  }
}This will search for all logs from the path we added and update them by sending them through the pipeline. If we now go back to the Discover UI again to look at the logs, we see that the timestamps have been parsed and updated correctly.
As we mentioned before, this is the single most important step for indexing custom logs. Technically these fixes are optional, but doing so allows you to get the most value from your unstructured logs. The log messages themselves are still unstructured and could contain anything — logs of text, numbers, expectations, errors, you name it.
If you expand and review one of your log events in Discover, you may notice that things aren’t as unstructured as you might have thought.
To give an example, the host used in the example was running in GCP. Without any additional configuration, we now get a wide range of metadata for cloud provider specific fields, in addition to metadata on the host level. This cloud provider metadata is really powerful when doing log analyses later.
This metadata allows you to filter or group log data by a set of hosts or a specific instance. The cost and overhead for this important metadata is also low. Even though lots of fields can be added in addition to the timestamp and message we started with, these extra data fields can be compressed incredibly efficiently, since they always contain the same information for a particular source.
What can we do with unstructured log data like this?
Search it! Elasticsearch is really powerful and fast when it comes to searching through terabytes of data. Since it indexes the content of every document by default, searching through it all becomes fast and easy.
One common approach for troubleshooting applications or servers when using Kibana is to simply open up the Discover UI and start searching. Start by excluding all of the logs you’re not interested in, either by removing them based on a field value or by using a full test search using Kibana Query Language (KQL). You can find out more about the Kibana Query Language here, but let’s look at some examples:
Exact term matching (OR query)
http.response.status_code:400 401 404

Phrase Matching
http.response.body.content.text:"quick brown fox"

OR query on different fields
response:200 or extension:php

Exclude terms
not INFO

Wildcard matching
kubernetes.pod.name:advert*In this blog, we’ve seen how you can quickly onboard an additional data source, even if it’s custom log data. This enrichment will allow you to get more value from your logs and ultimately help you to either troubleshoot your applications more quickly or to generate value for your business by being able to track KPIs.
In the next post of this logging series, we’ll start using the data and cover some additional concepts to do additional parsing, using both ingest pipelines but also review a more ad-hoc approach with runtime fields. In future blogs, we will focus on building dashboards and discuss strategies around data retention and information lifecycle management (ILM).
Additional logging resources:
- Getting started with logging on Elastic (quickstart)
- Ingesting common known logs via integrations (compute node example)
- List of integrations
- Ingesting custom application logs into Elastic
- Enriching logs in Elastic
- Analyzing Logs with Anomaly Detection (ML) and AIOps
Common use case examples with logs:
Share
- Share on Twitter
Share on Twitter
- Share on LinkedIn
Share on LinkedIn
- Share on Facebook
Share on Facebook
- Share by Email
Share by Email
- Print this page
Print