Elastic Observability: Driving mean time to resolution to zero


 Share on Twitter
Share on Twitter

 Share on LinkedIn
Share on LinkedIn

 Share on Facebook
Share on Facebook

 Share by Email
Share by Email

 Print this page
Print
At ElasticON Global 2021, Tanya Bragin, VP Product, Observability, and the Elastic Observability team showed how ongoing innovations continue to deliver actionable insights and faster root cause detection, reducing mean time to resolution (MTTR).
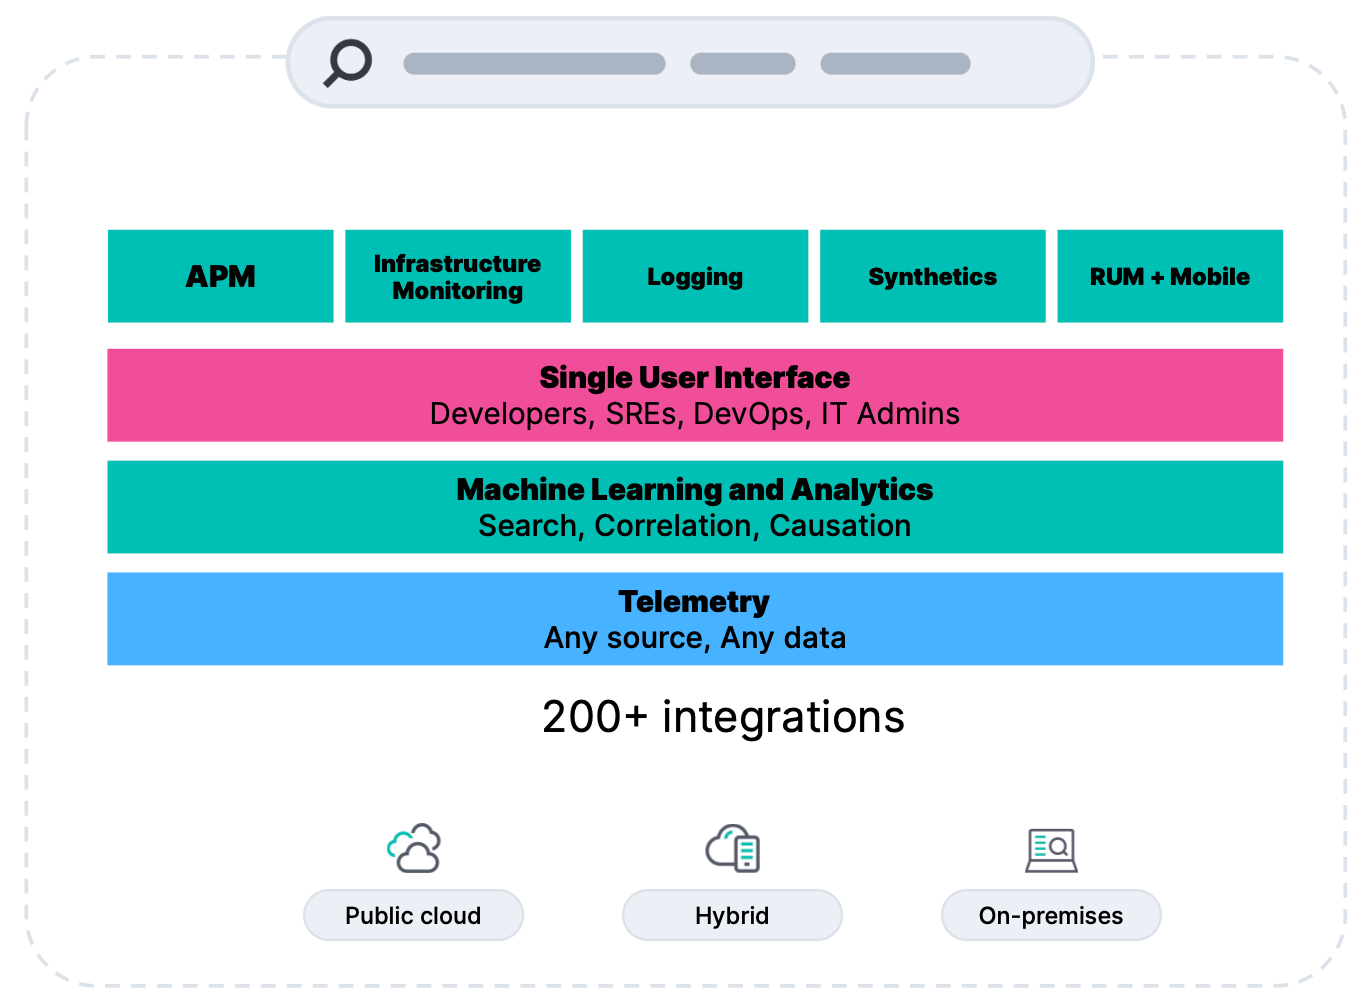
The adoption of cloud, microservices, and ephemeral infrastructure is driving increased complexity, requiring an observability solution to provide end-to-end visibility. Elastic Observability, as recognized by Gartner, GigaOm, and EMA, continues to build a comprehensive solution by delivering functionality related to:
- Unified agent for ingesting all telemetry data with centralized management
- Integration with cloud native technologies (e.g., Kubernetes)
- Native integrations with major cloud providers including Amazon Web Services, Microsoft Azure, and Google Cloud Platform
- Automated root cause analysis in application performance monitoring (APM) leveraging machine learning
- Enhanced APM troubleshooting workflows integrating logs, third-party dependencies, and backend services
- Intuitive service maps for contextual troubleshooting
- Support for OpenTelemetry (OTel)
- Synthetics and real user monitoring (RUM) enhancements
Making data relevant, contextual, and actionable
Operations and development teams are often confronted with siloed tools for metrics, logs, and traces. Even with a single tool, the data is often in silos with no context or is missing relevant metadata (dimensionality), which increases mean time to detection (MTTD) and resolution (MTTR). Elastic Observability seamlessly scales to large amounts of data with high dimensionality and cardinality with little to no performance or cost surprises.
Frictionless onboarding via Elastic Agent and centralized management allows for simplified collection of all telemetry data, including cloud-native technologies such as Kubernetes. We’ve also added integrations with Microsoft Azure and Google Cloud Platform to natively ingest telemetry data, with additional integrations coming.
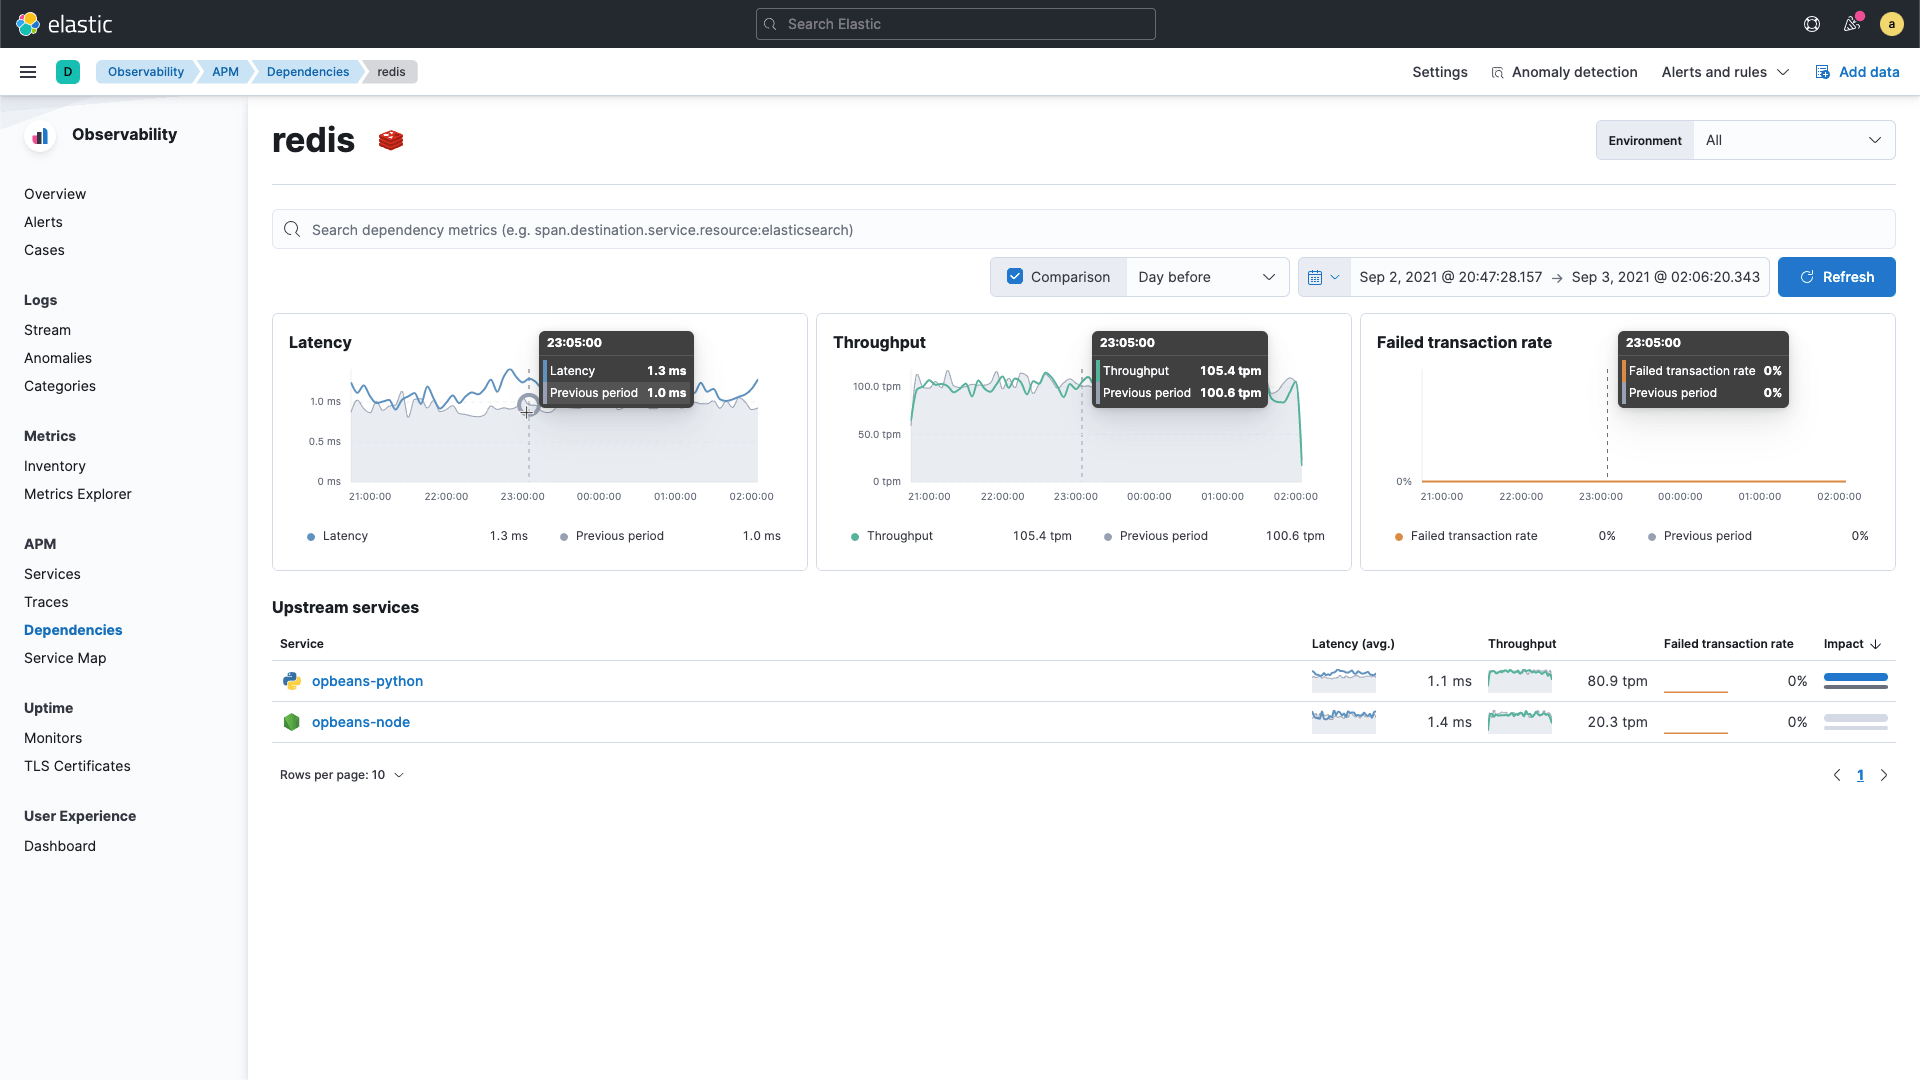
Context is required for efficient and quick troubleshooting of incidents. Elastic APM service maps visualize application topology and accelerate troubleshooting by giving you the ability to see the status of services, anomalies detected, and logs in the context of transactions. They also allow you to compare service performance over any historical baseline, making it easy to detect misbehaving services. Our recent support for performance views into third-party service dependencies eliminates blind spots from your environment. We are further expanding our APM capabilities with support for Mobile iOS agent, in technical preview.
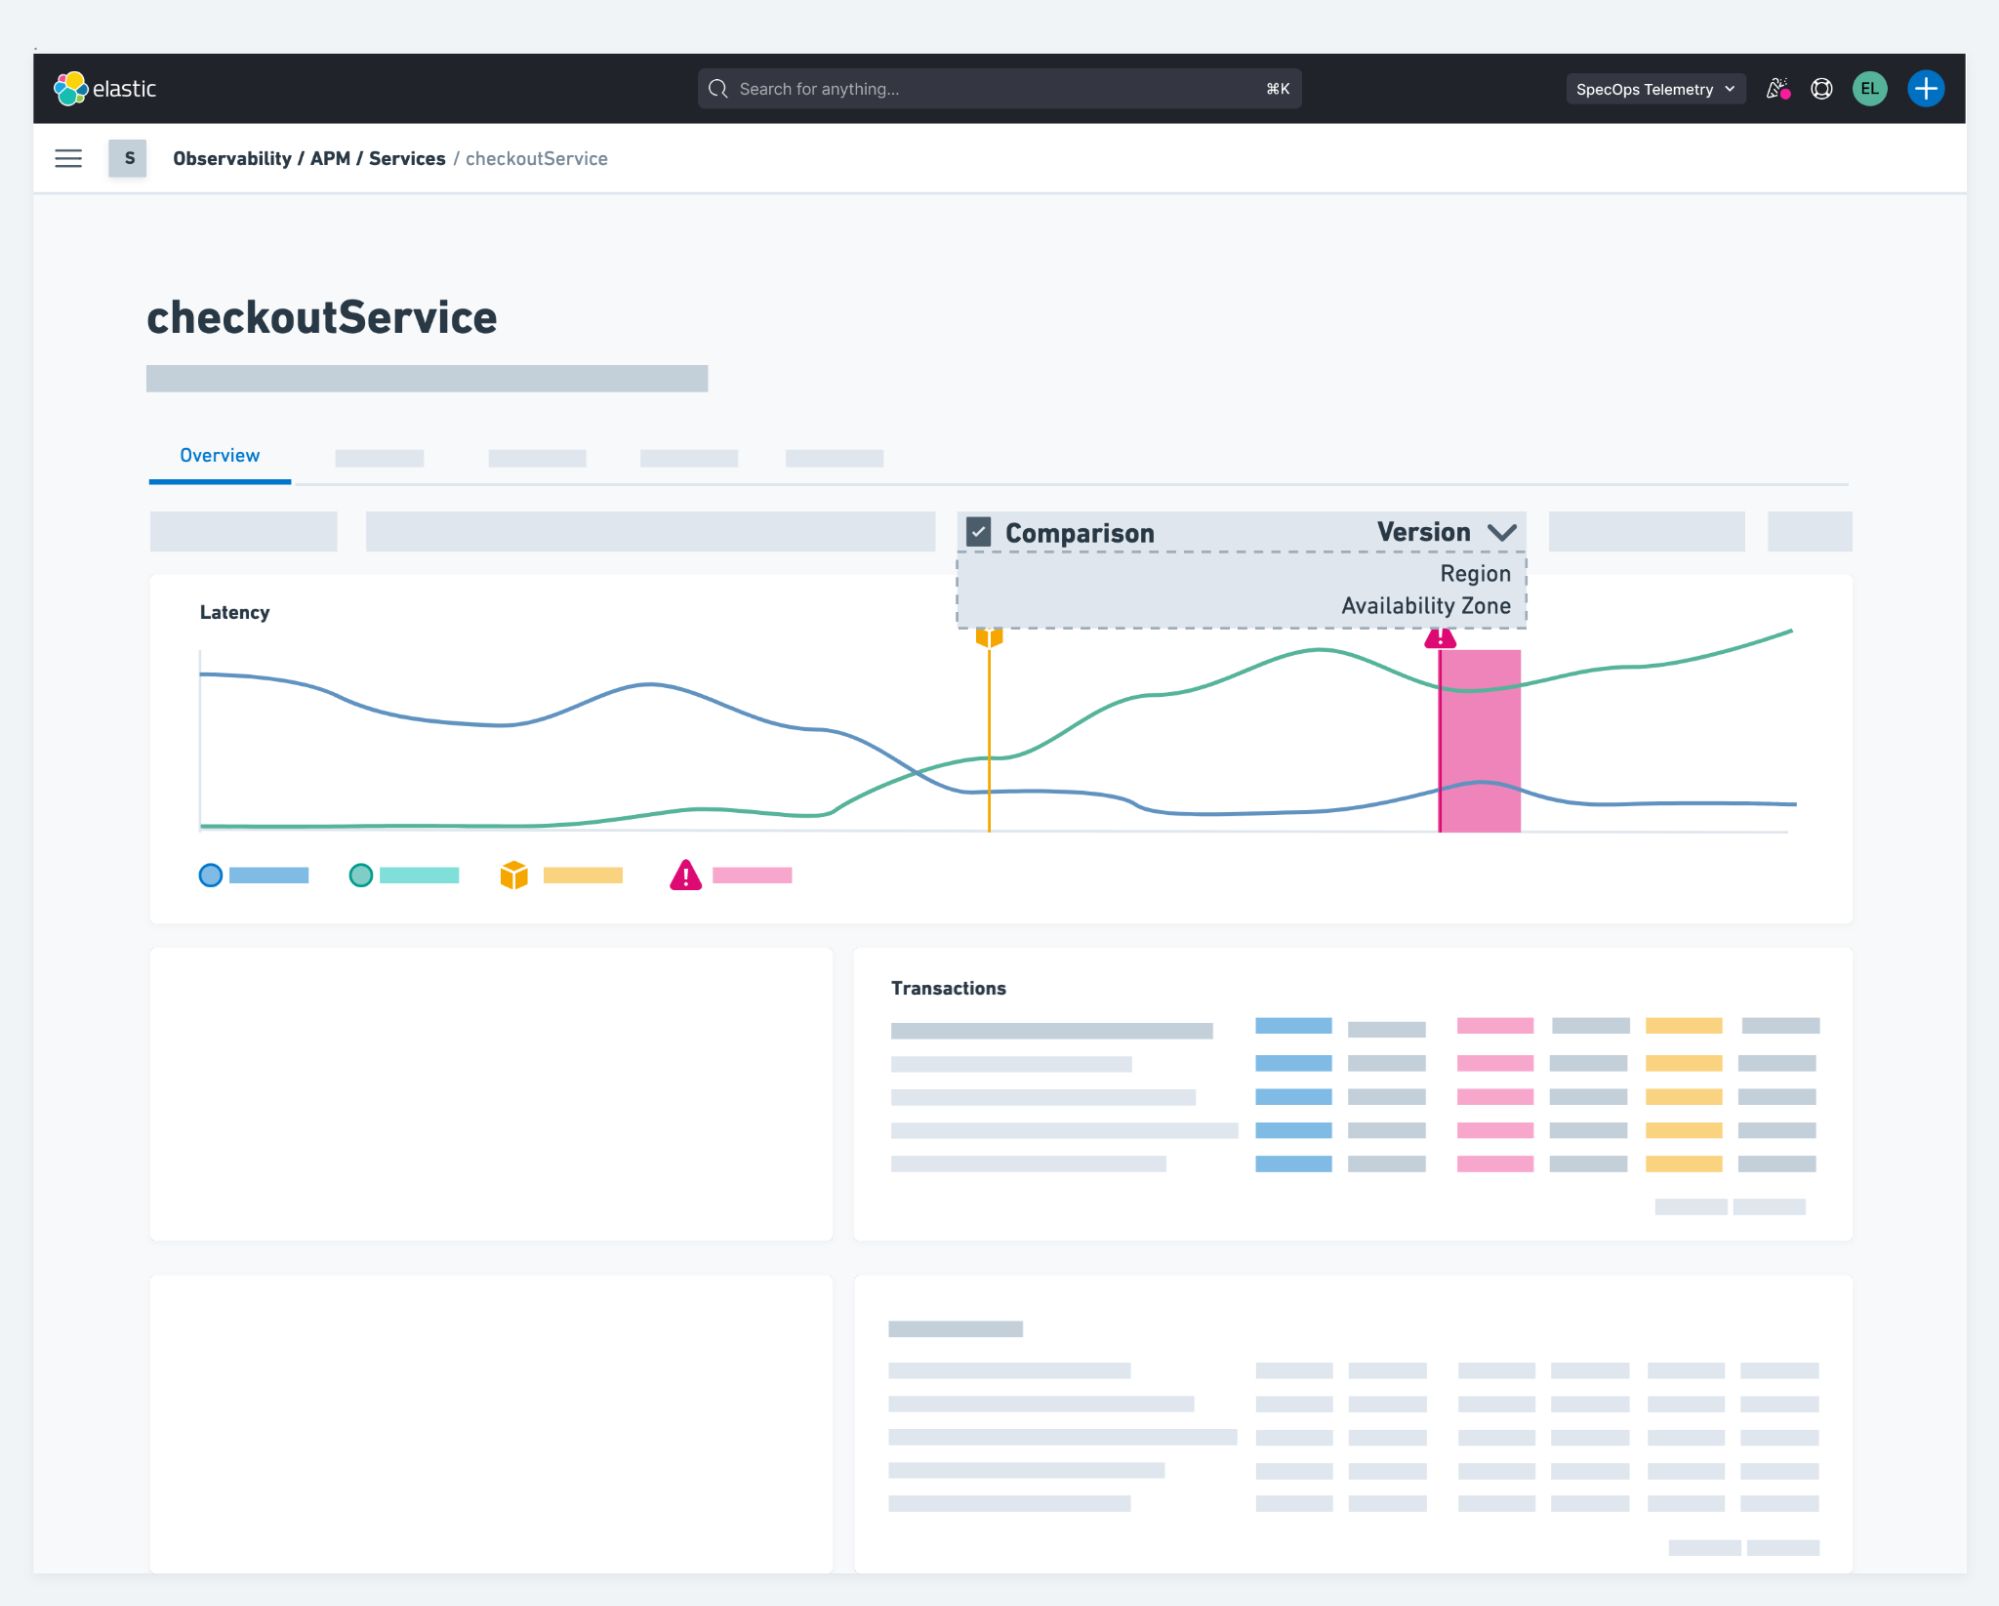
Our next step on the journey to connect the dots is to deliver context between your application and infrastructure. Often, application performance is degraded due to performance issues in the infrastructure. We will be delivering the ability to view infrastructure performance in context to the application performance and related logs, delivering unified observability. We’ve also had requests for the ability to compare service performance across versions, cloud regions, availability zones, and other metadata. This future capability would help compare performance between A/B or canary deployments and allow for quick troubleshooting of deployment issues.
Ad hoc analytics and machine learning
With the distributed nature of modern applications and petabytes of telemetry data generated daily, no team or individual has a complete picture of all the dependencies. To effectively resolve complex problems, teams need machine learning to deliver actionable insights while also having the ability to ask questions of their data.
The Elastic platform delivers rich out-of-the-box machine learning along with the ability to build your own custom machine learning jobs. Our APM correlations capability leverages machine learning under the hood to analyze deviations in application performance to identify misbehaving services. This eliminates the need to search and analyze data, resulting in reduced downtime and increased developer productivity.
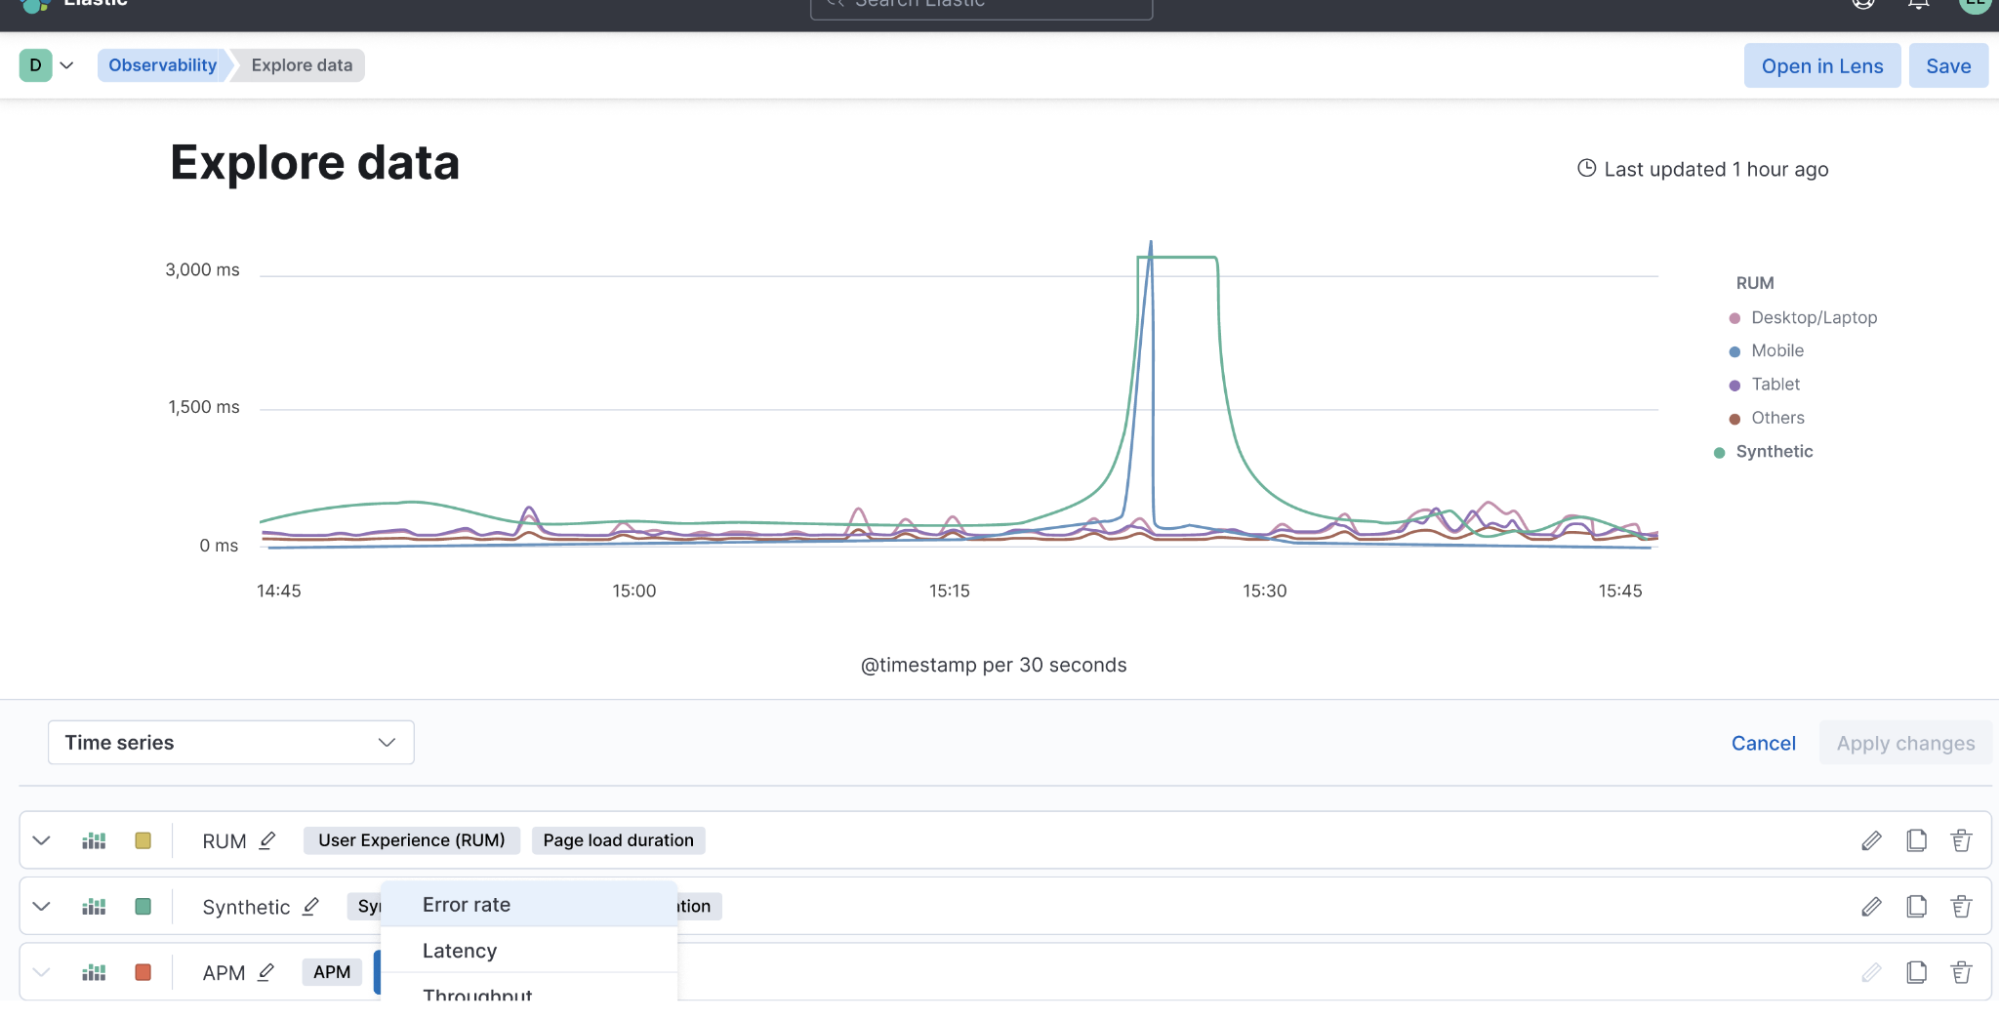
We realize that systems are complex and IT Ops, SRE, and DevOps teams need to analyze and investigate data to understand the unknowns. Coming to general availability (GA) soon is a new intuitive UI with the ability to ask questions and curate data exploration for different cohorts. This capability allows you to start overlaying, filtering, and exploring data from various sources as well as different data types. Interactive and curated ad hoc data exploration view allows you to dive into your data, understand the unknowns, and minimize the time needed for investigating the root cause.
Open is in our DNA
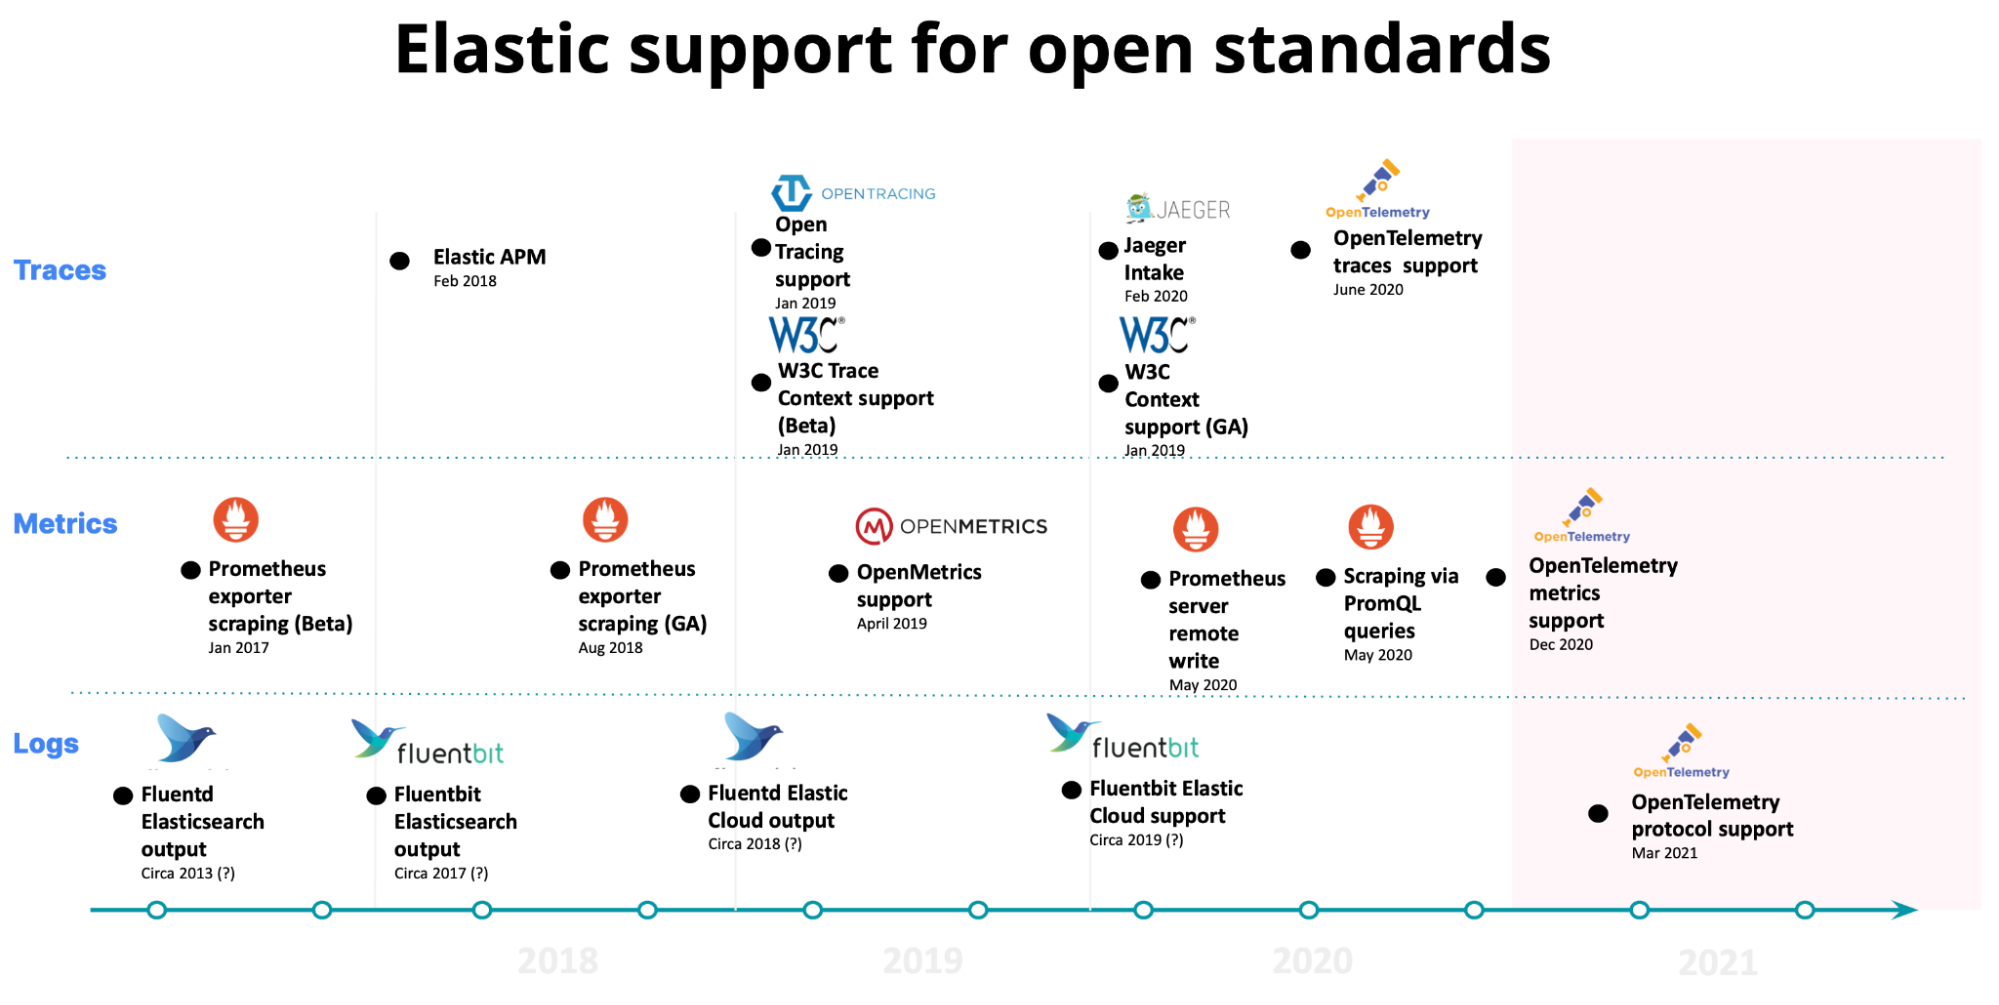
The foundation of Elastic Observability is open and provides you full control and flexibility of your performance monitoring data. Our continued support for open source projects has helped shape and define our product roadmap. From OpenTracing and OpenMetrics to Jaeger, Prometheus, and now OpenTelemetry, we’ve been an early adopter of open standards and protocols.
Prometheus is the de facto standard for metrics and provides customers a choice of an open standard for storing metrics. Elastic Observability integrates with Prometheus to give you a choice for storing and analyzing metrics. OpenTelemetry (OTel) is a CNCF project that is developing common and open standards for metrics, logs, and traces. Elastic delivers native support for OpenTelemetry via an OTel protocol (OTLP) endpoint or streamed via Kafka to the Elastic platform. Elastic Observability continues to invest in and support open source, we believe that customers should have choice and control over their operations.
Our work continues with your help
We continue to listen closely to our customers to deliver a comprehensive and unified observability platform. Beginning with the most robust enterprise search platform available, we’re innovating to support complex IT environments. With active participation from our community, Elastic Observability continues to deliver visibility into your cloud-native and hybrid environments with an open and extensible platform.
To learn more about the Elastic Observability vision, watch the keynote and other Observability sessions from ElasticON Global on demand, or check out the Elastic Observability page on the Elastic website.
The release and timing of any features or functionality described in this post remain at Elastic's sole discretion. Any features or functionality not currently available may not be delivered on time or at all.
Share
- Share on Twitter
Share on Twitter
- Share on LinkedIn
Share on LinkedIn
- Share on Facebook
Share on Facebook
- Share by Email
Share by Email
- Print this page
Print