Elastic Uptime Monitoring 7.5.0 released
We are pleased to announce the release of Elastic Uptime Monitoring 7.5.0 — available on the Elasticsearch Service, or as part of the default distribution of Elastic Stack. This release brings hint-based monitoring of Kubernetes service status, search auto-complete support, pagination of monitor status results, certificate expiration notification, and support for non-privileged ICMP checks.
Monitoring status of Kubernetes services
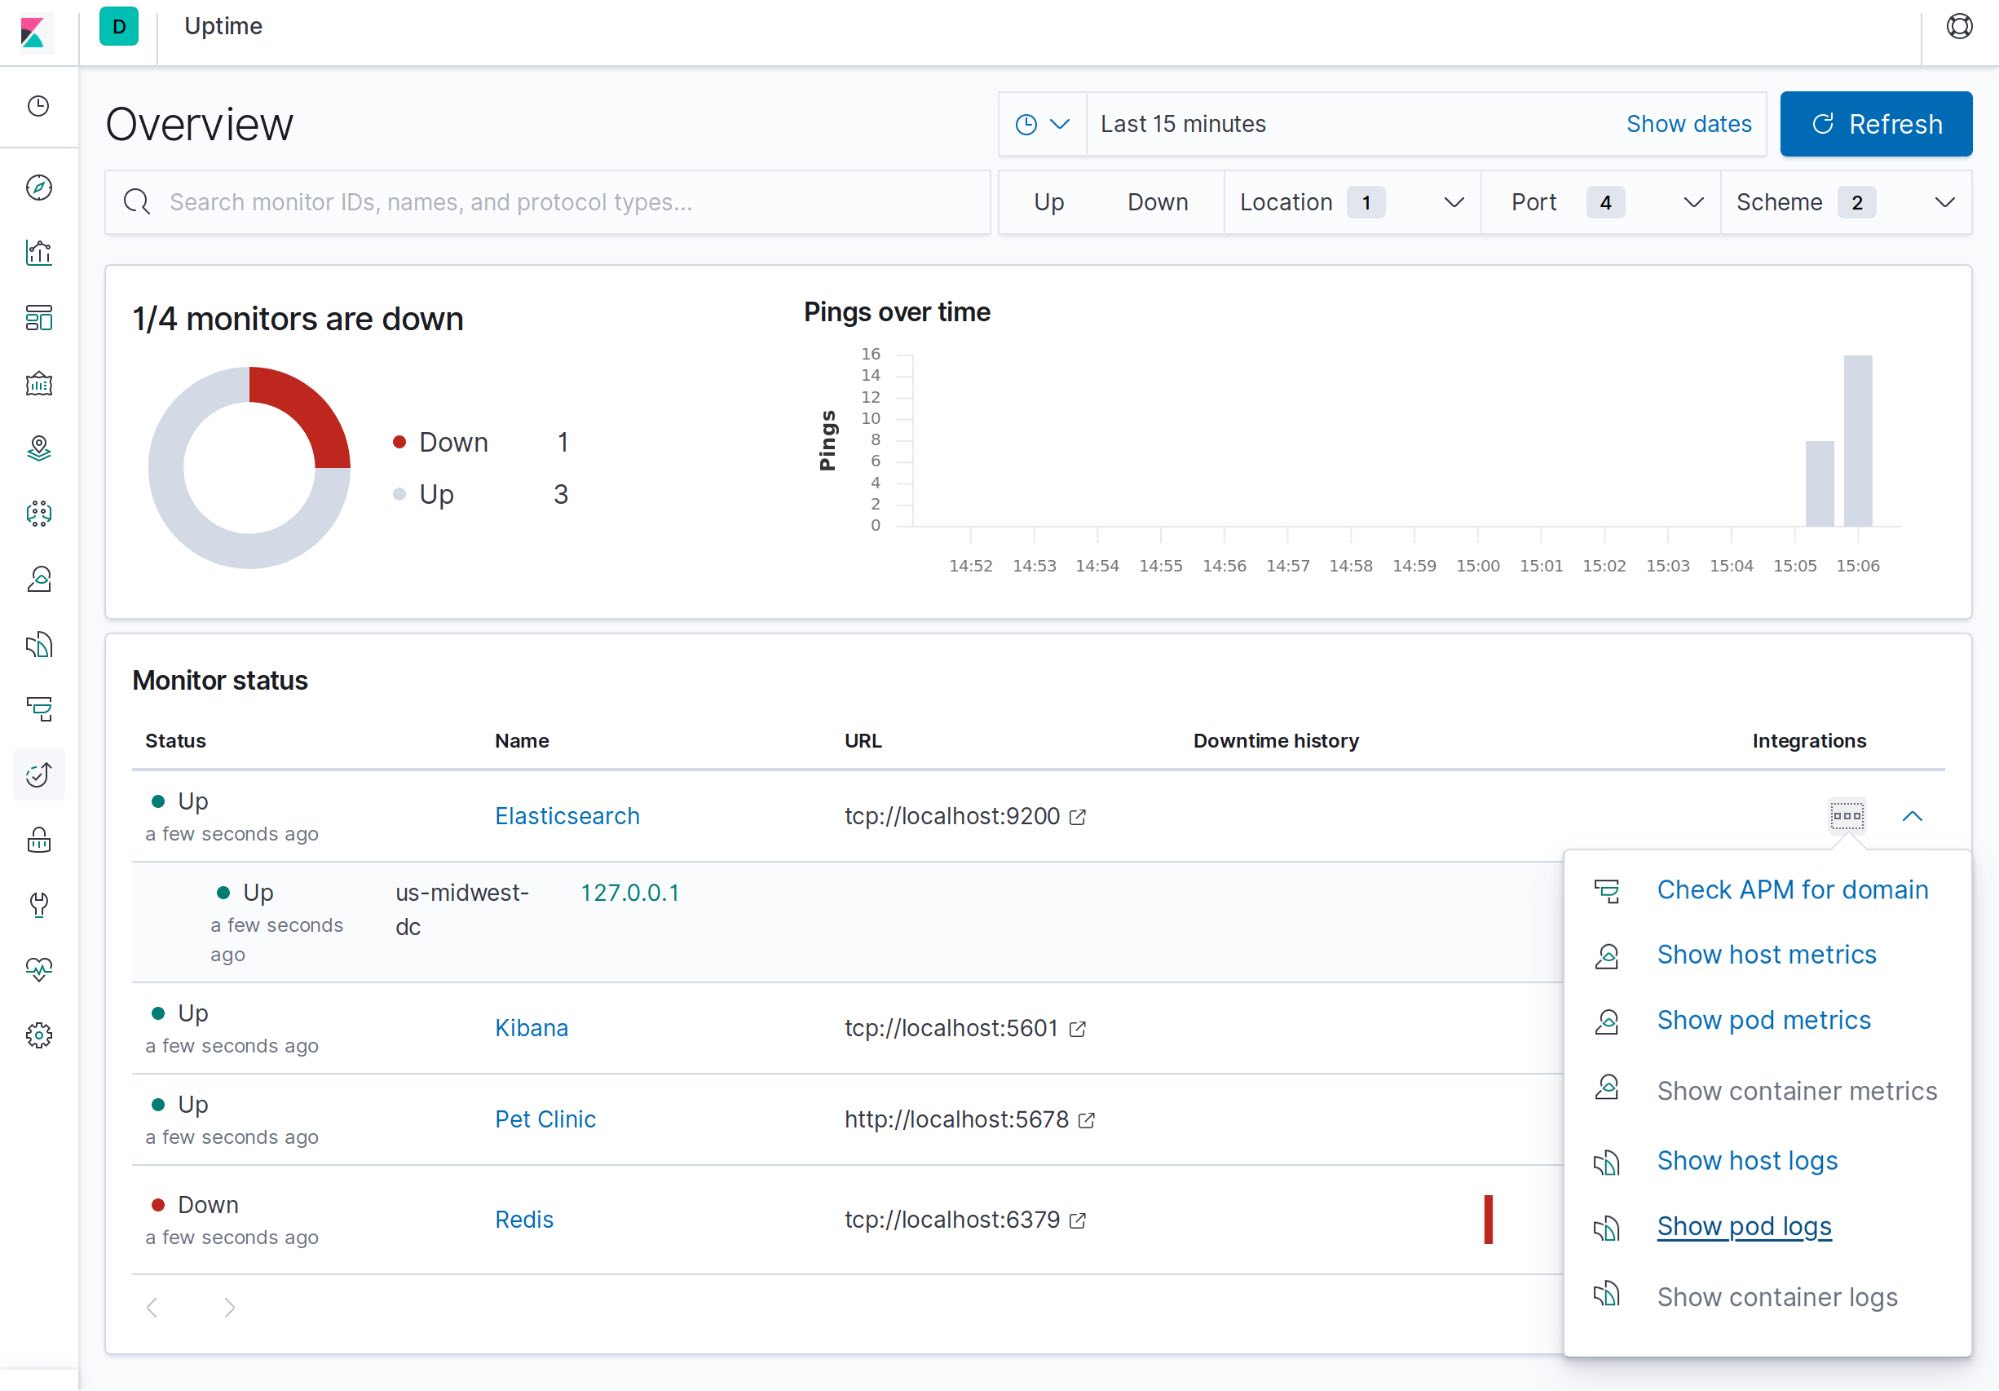
Kubernetes monitoring is particularly challenging due to the dynamic nature of infrastructure and services running on it. To ensure all these services are available and responding requires flexible configuration options. Prior releases of Heartbeat already supported Kubernetes and Docker auto-discovery. In 7.5, we are enhancing Uptime to include hint-based auto-discovery, which is a particularly great fit for monitoring the health of Kubernetes services.
Hints are metadata you attach to an image or pod using labels in Docker or Kubernetes. Before this release, users had to write rules that define how pods and containers would be monitored. For instance, they could specify that any pod with ‘redis’ in the name would have a TCP check on port 6379. Now users can add special labels to pods and containers to configure them for monitoring via Heartbeat directly from Docker and Kubernetes. As soon as the pod or container starts, Heartbeat will check if it contains any hints and launch the proper config for it.
This is useful because perhaps only admins can edit heartbeat.yml for an organization, but other teams might be responsible for their deployments. They can simply add metadata to their containers and pods and Heartbeat will use that metadata as a sort of additional configuration. It is also simpler and less error-prone to use hints rather than editing heartbeat.yml in some situations, depending on how you choose to manage your configurations.
Search auto-complete support
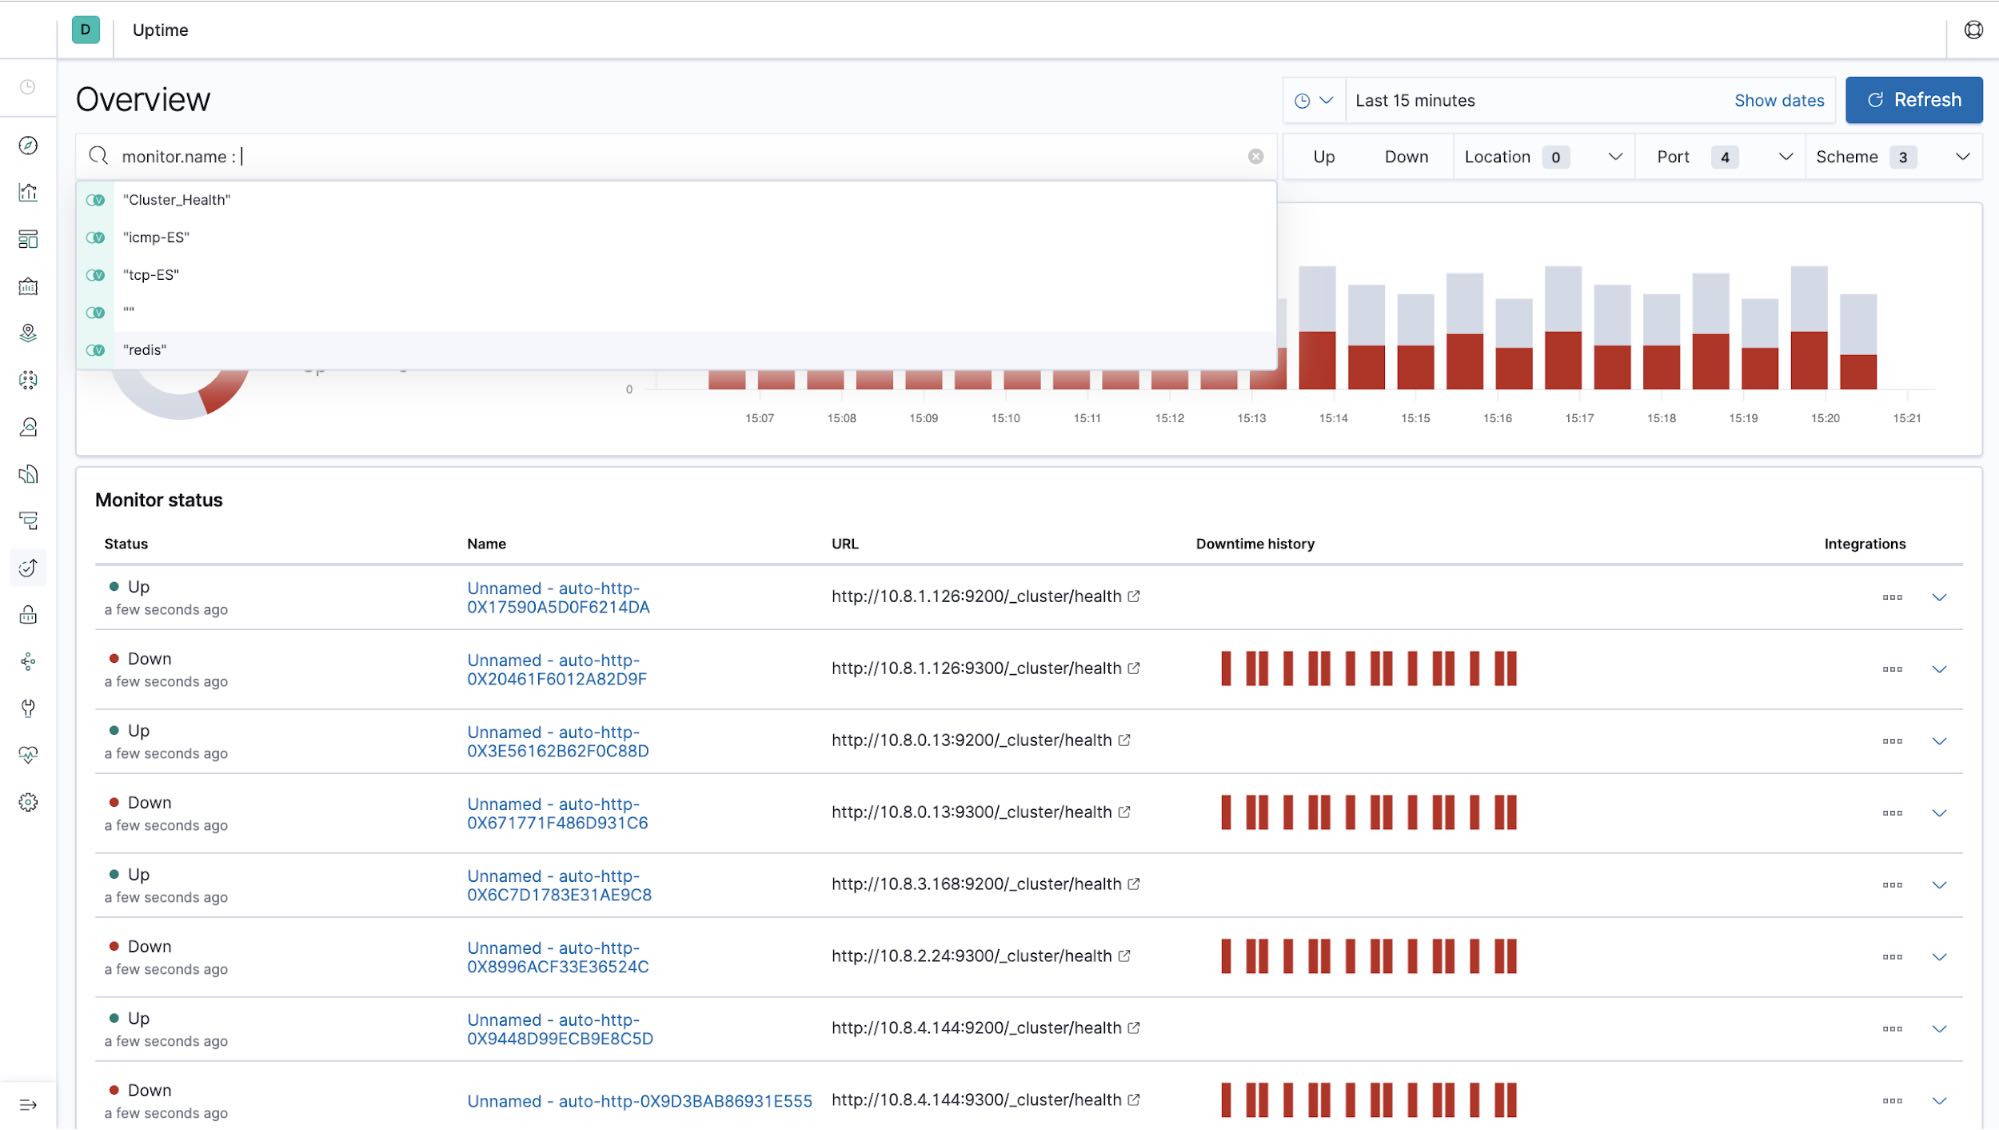
Search is a really powerful part of the experience in the Kibana UI, and data in the Uptime app is no exception. When looking at status checks from many monitors, it’s often handy to filter by specific monitor names, tags, and other attributes. With auto-complete support powered by Kibana Query Language (KQL), you now don’t have to guess what the search syntax looks like. Just start typing and we’ll suggest results that make sense.
Pagination in Uptime Overview page
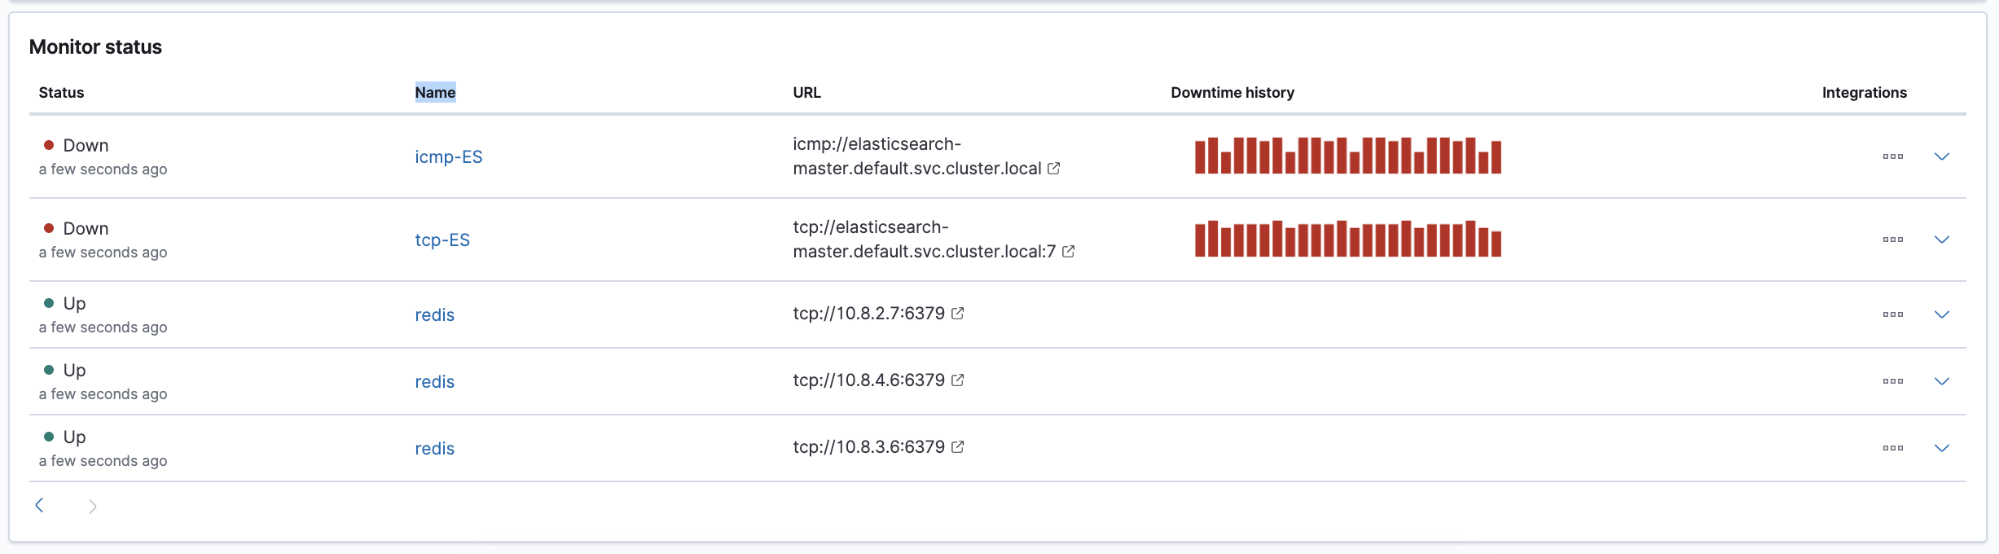
The Uptime solution is often used to monitor thousands of entities. In such high-volume usage, pagination of monitor status results is important to keep the UI performant and usable. In 7.5, we added pagination to the main Overview table in the Uptime app. We also refactored key internal queries to more accurately merge data from multiple Heartbeat geo-locations using a multistage in-memory join in Kibana.
SSL certificate expiration message in UI
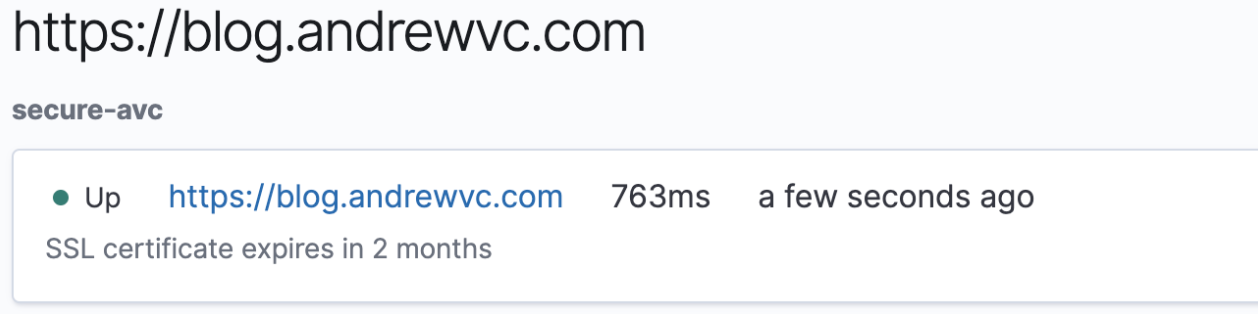
Certificate expiration is a common culprit of many application failures, so keeping certificates current is important. With the 7.5 release, the Uptime app now notifies you when certificates for monitored services are about to expire.
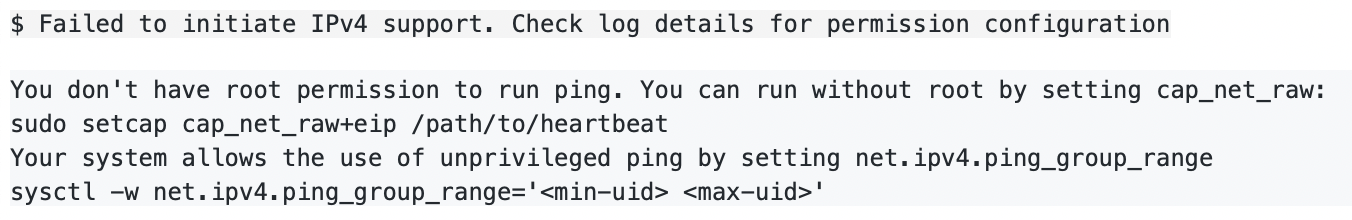
Support for non-privileged ICMP checks
Many operating systems support the ability to send an ICMP check (ping) without root privileges. With the 7.5 release, we add the ability to do so using Heartbeat. This change allows more environments with stricter rules for running agents to use Heartbeat (and the Uptime solution) for ICMP checks.
Want to see it in action?
You can access the latest version of the Elastic Uptime application on the Elasticsearch Service on Elastic Cloud, or you can download it as part of the default distribution of the Elastic Stack. Download Heartbeat, follow the instructions on how to set it up, and start monitoring your applications and services today.
Related blogs: