Elastic Logs 7.5.0 released
We are pleased to announce the release of Elastic Logs 7.5.0 — available on the Elasticsearch Service, or as part of the default distribution of Elastic Stack. This release brings log rate anomaly detection and support for automatically ingesting new types of AWS and Azure log events.
Log rate anomaly detection
Machine learning and anomaly detection can help operators pick out important trends that they would otherwise miss in a sea of data. The rate at which logs from different sources come into the system is important. A change in that rate could signal a number of important events: a new application or log source was just onboarded, logging activity suddenly went up due to a promotion (or an attack!), log shipping suddenly stopped, perhaps due to an agent or ingest pipeline malfunction, and so on.
In 7.5 we introduce a curated UI for dataset-based log rate anomaly detection, which enables operators to get instant answers to all these questions with a single click.
This functionality requires a Platinum license. If you are a Basic user, try out this functionality by starting a Platinum trial under Management > License Management.
AWS Elastic Load Balancer logs
In this release, we added support ingesting Elastic Load Balancer (ELB) access logs from S3. It supports the three kinds of load balancers offered by AWS: Classic Load Balancer, Application Load Balancer, and Network Load Balancer.
This module supports a number of key metrics from these events that can help troubleshoot load balancer– related issues, such as latency through this component:
- Request processing time: The total time in seconds since the connection or request is received until it is sent to a registered backend.
- Backend Processing Time: The total time in seconds since the connection is sent to the backend until the backend starts responding.
- Response Processing Time: The total time in seconds since the response is received from the backend until it is sent to the client.
- Connection Time: The total time of the connection in milliseconds, since it is opened until it is closed.
- TLS Handshake Time: The total time for the TLS handshake to complete in milliseconds once the connection has been established.
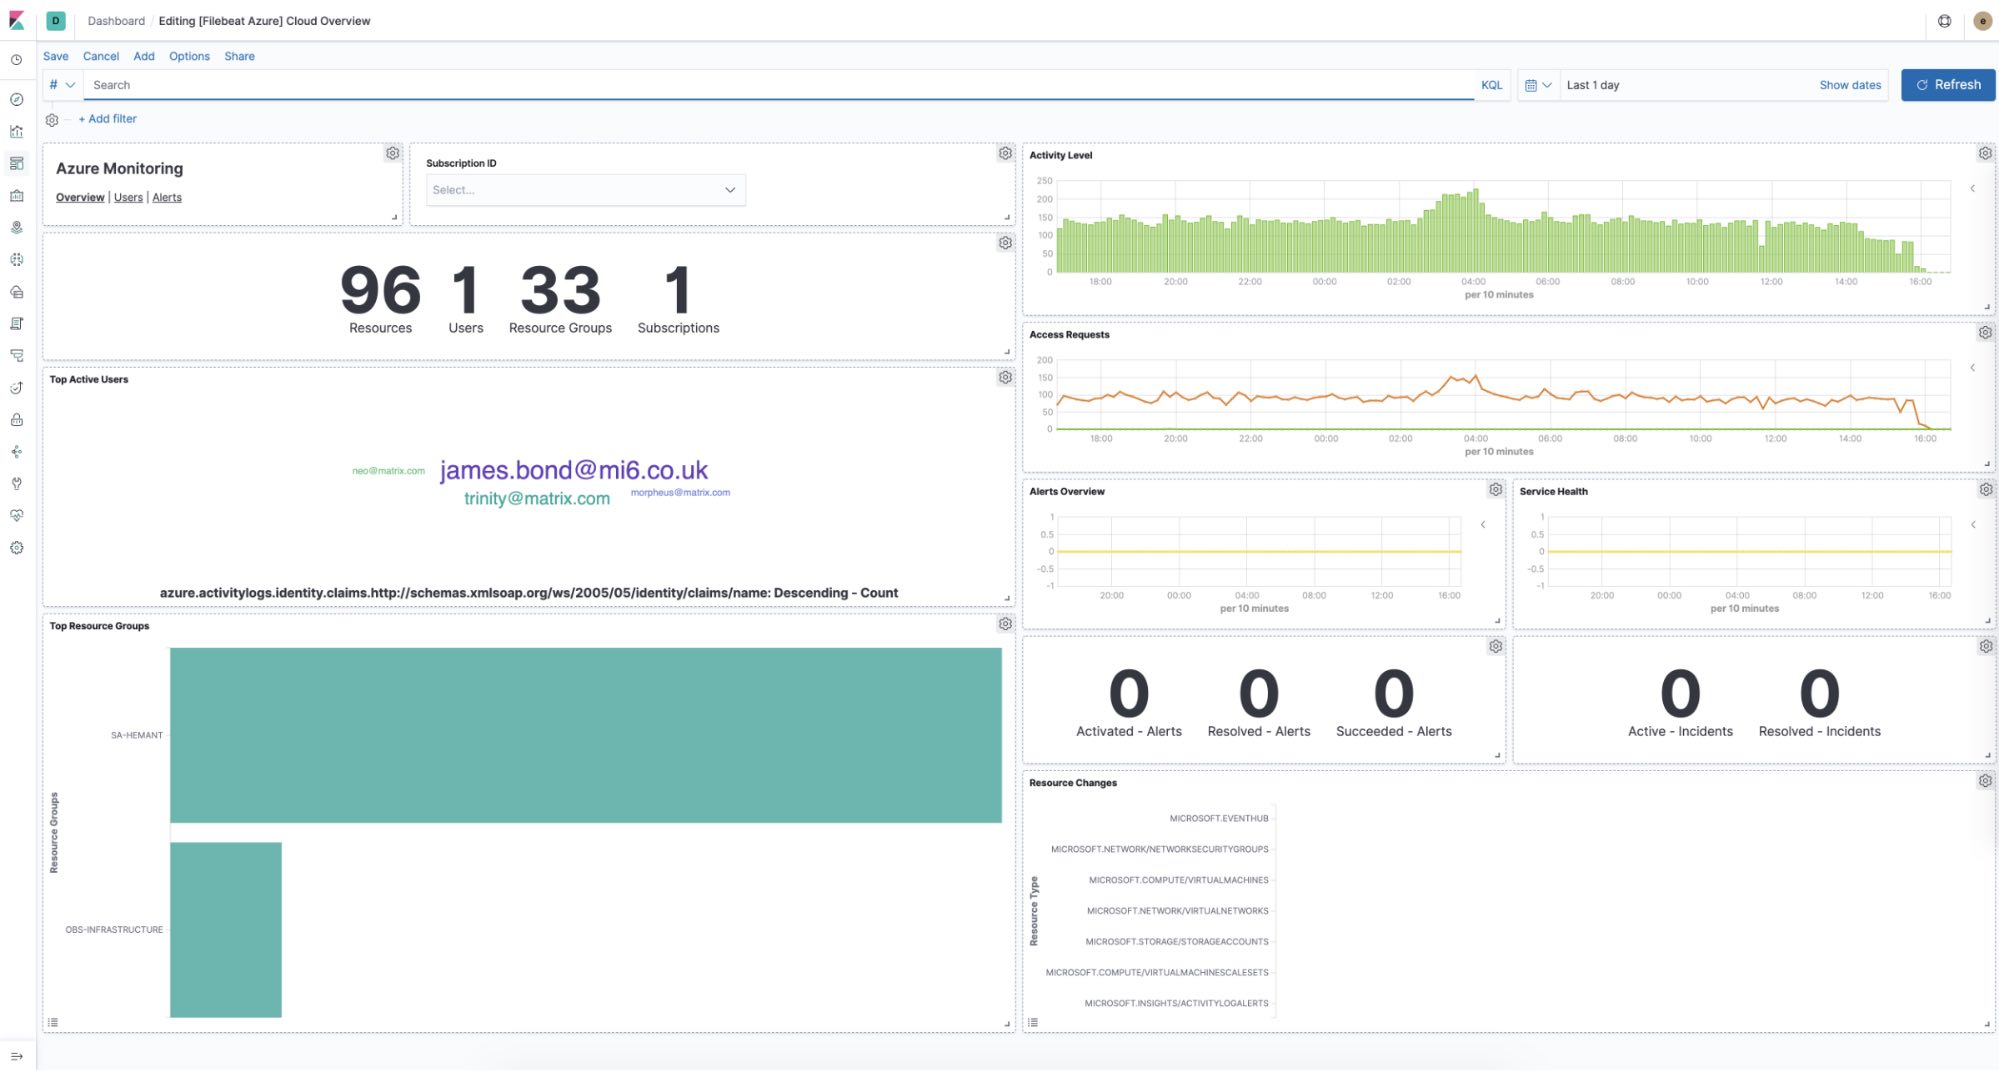
Azure Event Hub logs
We also introduce a new module to collect and process Azure Event Hub logs. This module acquires logs from Azure Event Hub and passes all events for analysis.
The module also supports mapping structured event fields for the following log types:
- Activity Logs: Control-plane events on Azure Resource Manager resources. Activity logs provide insight into the operations that were performed on resources in your subscription.
- Active Directory Sign-in Logs: The sign-ins report provides information about the usage of managed applications and user sign-in activities.
- Active Directory Audit Logs: The audit logs provide traceability through logs for all changes done by various features within Azure Active Directory. Examples of audit log events include changes made to any resources within Azure Active Directory like adding or removing users, applications, groups, roles, and policies.
Note that this module is currently in beta, so we do not recommend using it in production. Please submit your feedback to our forum.
See it in action!
You access the latest version of the Elastic Logs application on the Elasticsearch Service on Elastic Cloud by creating a new cluster, or upgrading an existing cluster the day of release, or you can download it as part of the default distribution of the Elastic Stack.
Related blogs: