Elastic Stack 7.3.0 released
We are thrilled to announce that version 7.3 of the Elastic Stack has arrived, and it’s another good one.
In this blog, we’ll touch on some of the release highlights. Be sure to check out the dedicated blogs for each product to dive into all the details of what’s new. If you just can’t wait, version 7.3 is available right now on our Elasticsearch Service — the only hosted Elasticsearch offering to include these new features. Or you can download the Elastic Stack.
Now, on to the reason you’re here — here’s what’s new.
Materialized view? Entity-centric index? Introducing data frames
Say hello to data frames, a new feature that lets you pivot your Elasticsearch data on the fly to create live entity-centric indexes. It’s an exciting feature that opens the door to a new world of analysis, including new machine learning analysis — like outlier detection (which was added as an experimental feature in 7.3), clustering, classification, and more.
As with most powerful concepts, this feature is best described with an example. Imagine you want to look for suspicious IP addresses in your web server logs. You might want to look at how many requests were made, the response codes, and the total data transferred for each IP address. Data frames allows you to create a new entity-centric index with a document per unique IP address that tracks each metric of interest — in this case, total requests, count per response status, and sum of bytes transferred. The icing on top is that data frames supports continuous processing, which means that this transformed entity-centric index is automatically updated as new documents are added to the input index.
With data frames, we have built a powerful engine to transform your data for new kinds of analysis. These live pivots are just the first set of transformations enabled by data frames, and we are excited to introduce more transformations in the future that extend the data frames concept to even more use cases.
Elastic SIEM adds anomaly detection — because rules are not enough
We introduced our SIEM solution in version 7.2, and we’ve been busy since then.
Rules alone rarely catch bad actors. So, we enhanced threat detection and threat hunting workflows in Elastic SIEM for 7.3 by integrating our machine learning capabilities right into the SIEM app. Users can now easily enable and run a set of machine learning anomaly detection jobs designed to detect specific cyber attack behaviors, right from the SIEM app. The detected anomalies are conveniently displayed on the Hosts and Network views in the SIEM app.
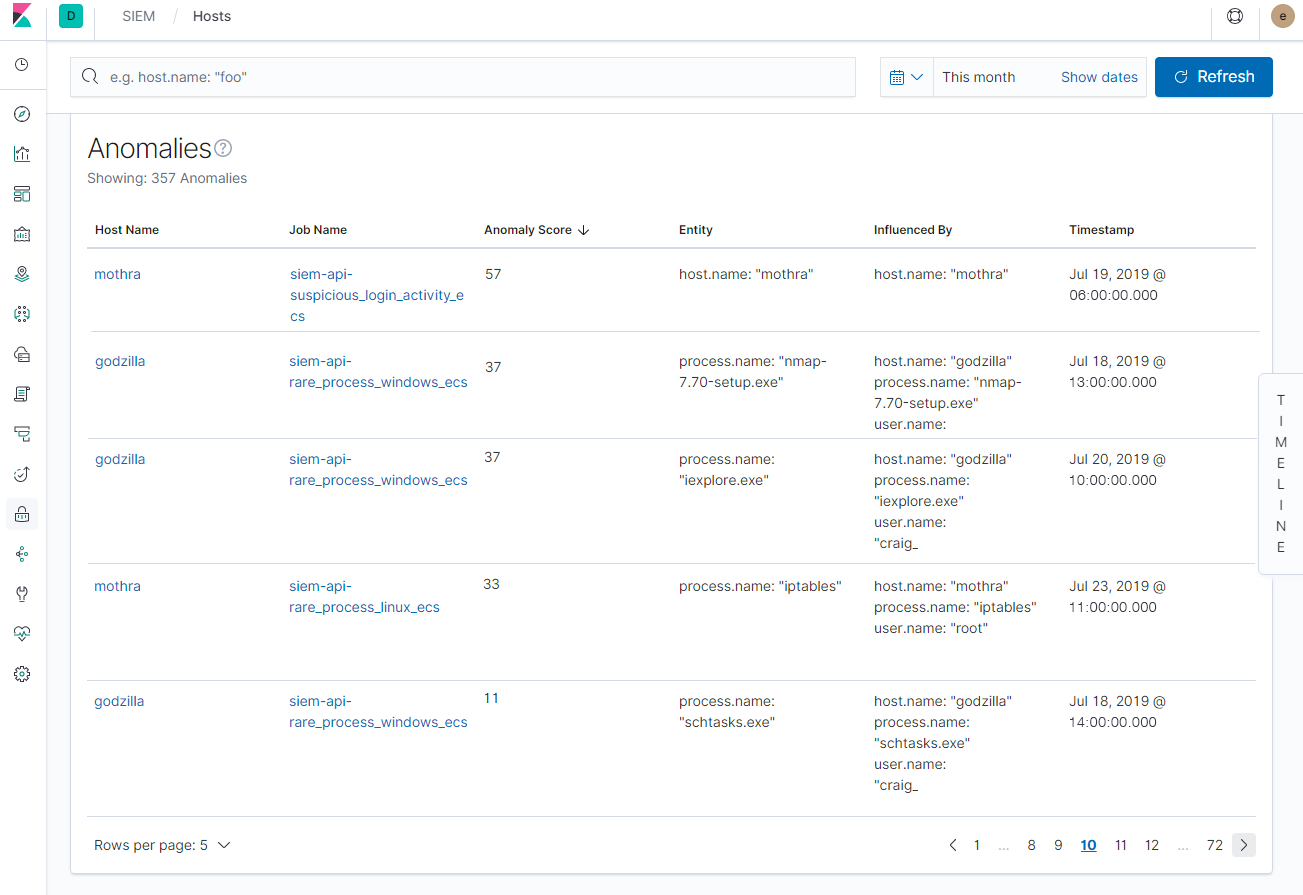
Users looking to go beyond the prebuilt jobs can easily add custom anomaly detection jobs using the Machine Learning app.
With this integration, it’s now easier than ever to leverage machine learning to help detect attack behaviors. See all the details in the Elastic SIEM release blog
“The Elastic Stack helps us with everything from monitoring for cyber threats to examining crime data,” said Steve Caruso, Director of Information Technology for the Will County, IL Sheriff’s Office. "Version 7.3 gives us even more to love. We're excited to get our hands on machine learning from directly within the SIEM app. We are also looking forward to trying out new features in the Maps app. Enhancements like these are valuable to our crime analysis initiatives for all of Law Enforcement within Will County.”
Elastic Maps is generally available
Location has always been a critical part of search — whether investigating the source of attacks on your network, diagnosing slow application response times occurring in a specific region, tracking your delivery trucks in real time, or just trying to find the best burrito nearby. This is why we’ve been working since the beginning (0.9.1!) to build faster, more powerful, and more efficient geospatial capabilities in the Elastic Stack.
We introduced Elastic Maps as a beta feature in 6.7 to provide a more intuitive and interactive way to explore and understand geospatial data in Kibana, and laying a solid foundation for the future. And in 7.3, we’re happy to announce that Maps is now production ready.
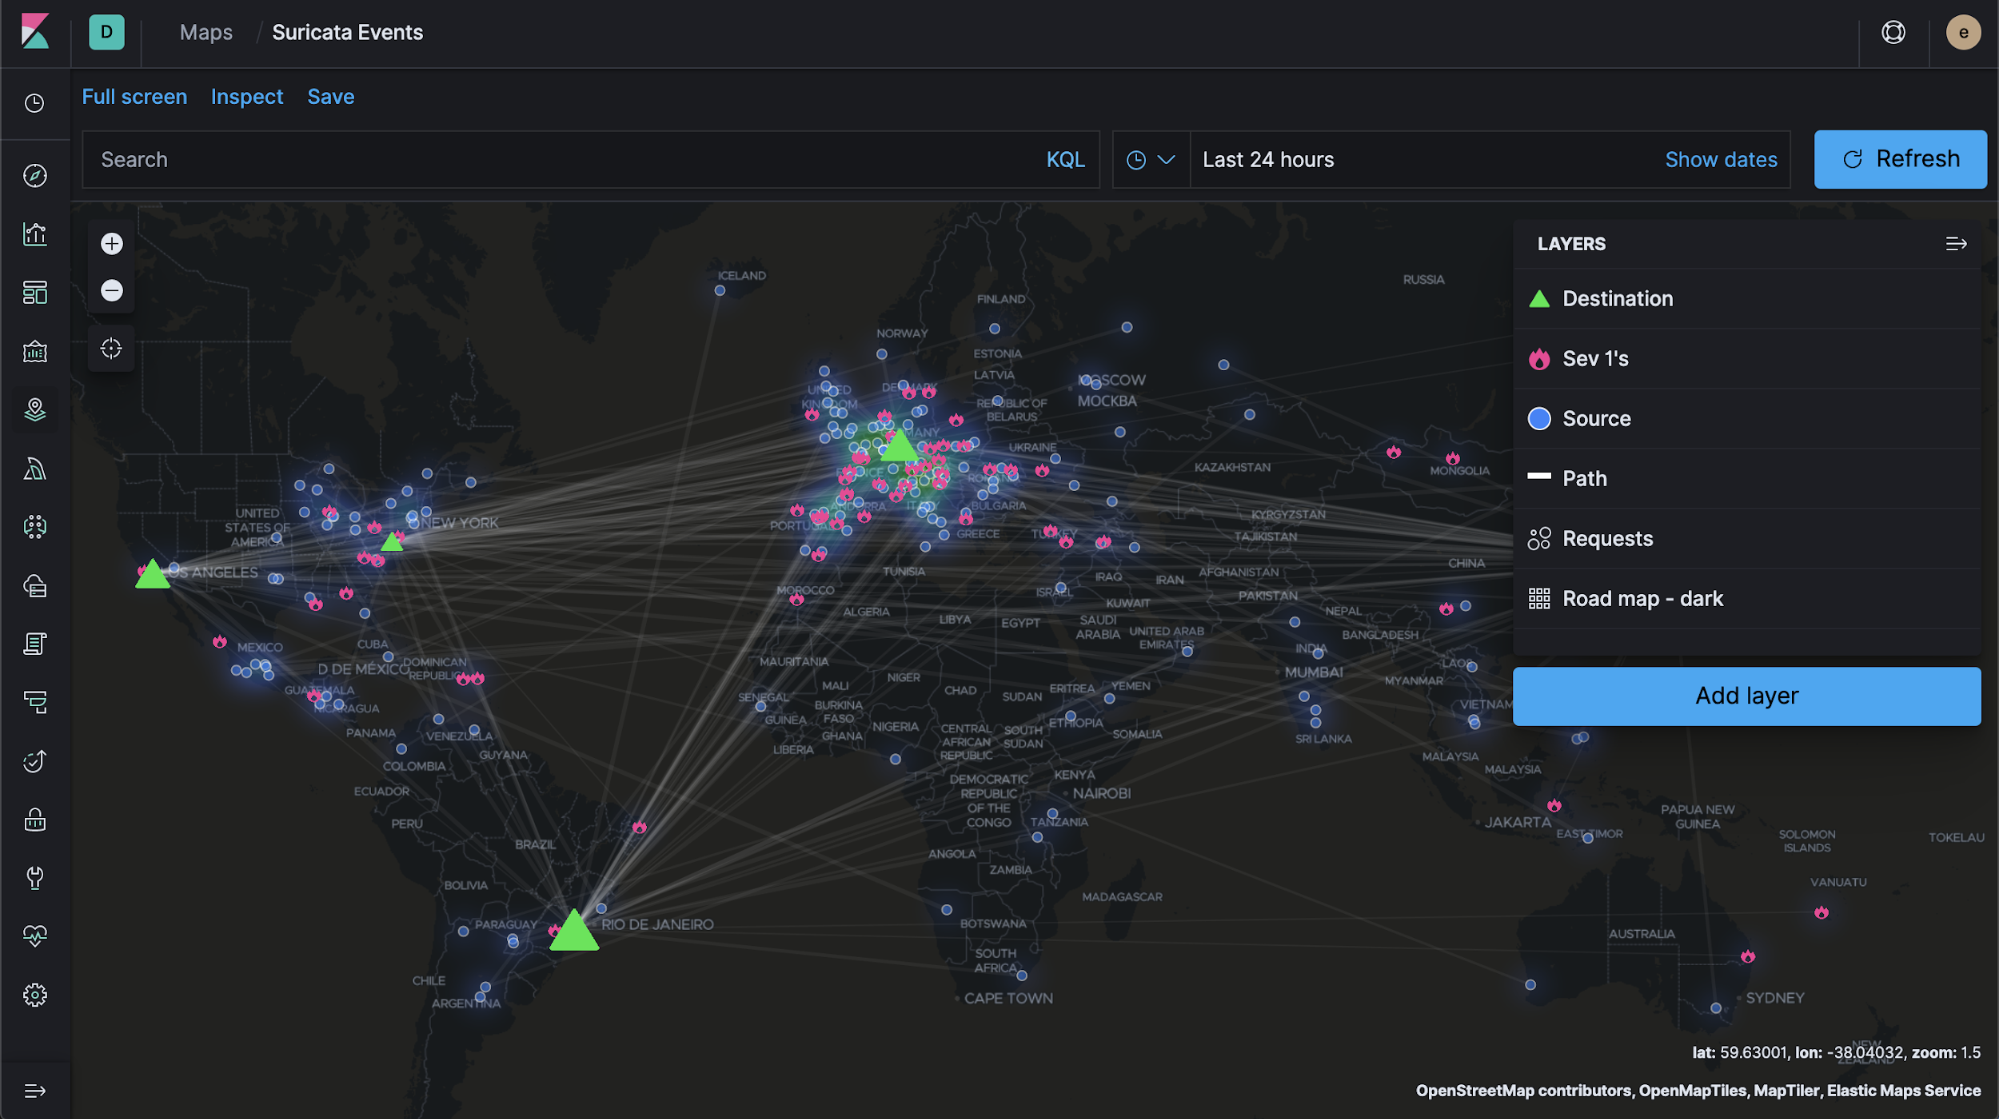
Elastic Maps also adds several new features, the most exciting of which is the ability to upload features, shapes, and layers into maps from GeoJSON files. Other improvements like the ability to plot custom icons and visualizing last known location enhance the overall user experience.
Read the Maps blog for all the details. We’re incredibly proud of how far we’ve come with Elastic Maps, and are excited for our users to experience the new features in 7.3 and exciting features planned in future releases.
Yes, there’s more!
So much more. Check out the individual product blogs for the details on everything we added in 7.3:
- Elasticsearch introduces voting-only master nodes, adds the long-requested rare-terms aggregation, a new Snapshot / Restore Management UI, dynamically updatable synonyms, and so much more. Read all about it in the Elasticsearch release blog.
- Kibana brings support for Kerberos, autocomplete and KQL support to filter aggregations, and Canvas workpad templates to make building beautiful displays easier — but that’s not all.
- Beats adds support for a bunch of new data sources, including relational databases like Oracle and Amazon RDS, metrics for Kubernetes kube-proxy, kube-scheduler and kube-controller-manager, Network Flow support for GCP VPC Flow Logs, and improved support for Amazon Kinesis Data Streams and Amazon Cloudwatch with Functionbeat. Learn more in our Beats release blog.
- Logstash now includes JMS support by default.
- The Elastic APM .NET Agent is now generally available. Plus, Elastic APM adds a new way to view services with aggregate service breakdown charts, agent sample rate configuration right from Kibana, and a whole lot more.
- Elastic Uptime has improved the look and feel of multi-location monitors with monitor summaries and details.
- Elastic Logs adds keyword highlighting, along with the ability to jump to APM traces based on
trace.id. - Metrics Explorer in the Elastic Infrastructure app, which allows you to quickly perform aggregation visualizations against time-series metrics, is now ready for use in production systems. Elastic Infrastructure also adds improved monitoring of additional core Kubernetes services and a new RDS metricset in the AWS module. Learn more in the Elastic Infrastructure release blog.
Enjoy!