Elastic APM PHP Agent 1.0 released
We are proud to announce the 1.0 release of the Elastic APM PHP Agent! If you are interested in this work, please try the agent and let us know how it works for you and what features you miss! The best way to give feedback and ask questions is in our discussion forum, or if you find an issue or you would like to submit a pull request, jump to our GitHub repository. The agent is Apache-licensed, and we are more than happy to receive contributions from the community!
Elastic APM is an application performance monitoring solution from Elastic. Alongside the PHP agent, there are official agents available for Java, Node.js, Python, Ruby, JavaScript/RUM, Go and .NET. Elastic APM helps you gain insight into the performance of your application, track errors, and gauge the end-user experience in the browser.
If you would like to know more details, please take a look at the official documentation.
Supported frameworks
We started the agent’s design by asking our potential user base about which frameworks and libraries they use for their PHP applications.
Based on that feedback, the 1.0 release has auto-instrumentation features for the following frameworks and libraries:
- Web frameworks
- Framework-less PHP application (application using PHP's built in web support)
- Laravel
- Data access technologies
- PHP Data Objects (PDO)
- HTTP clients
- curl extension
- Guzzle library
We plan to continue adding support for more frameworks and libraries — you can monitor the progress in the Supported technologies section of the official documentation.
Additionally, the APM PHP Agent offers a Public Agent API that enables you to manually instrument your application for other frameworks, or to augment automatically captured events with custom data (for example, labels).
This agent ships as a combination of a PHP extension (implemented in C) and a PHP part. The agent supports PHP versions 7.2-7.4.
At the moment, the only supported operating system is Linux.
Download and install the agent
The agent ships as a Linux package that can be downloaded from the agent's GitHub releases. There are a number of prebuilt packages for popular Linux distributions. If you can’t find your distribution, you can install the agent by building it from the source.
The next step is to install the downloaded package. You can find the command for each of the prebuilt packages at the Set up the Agent section of the official documentation. For example, on a Debian based distro (Ubuntu, etc.) the command is:
After the installation is complete all you need to do is to restart the server that runs your PHP application and you should see the monitoring data in Kibana.
Please note that by default, the APM PHP Agent assumes that the APM Server is running on localhost port 8200. If it is not the case you can configure the APM Server URL using server_url configuration option. The APM PHP Agent can be configured either via php.ini or environment variables. You can find more details at the Configuration section of the official documentation.
Example of the monitoring data
After following the steps in the Download and install the agent section you should see the monitoring data in Kibana.
Your application should appear in the APM / Services list:

You can change the automatically discovered service name by using service_name configuration option.
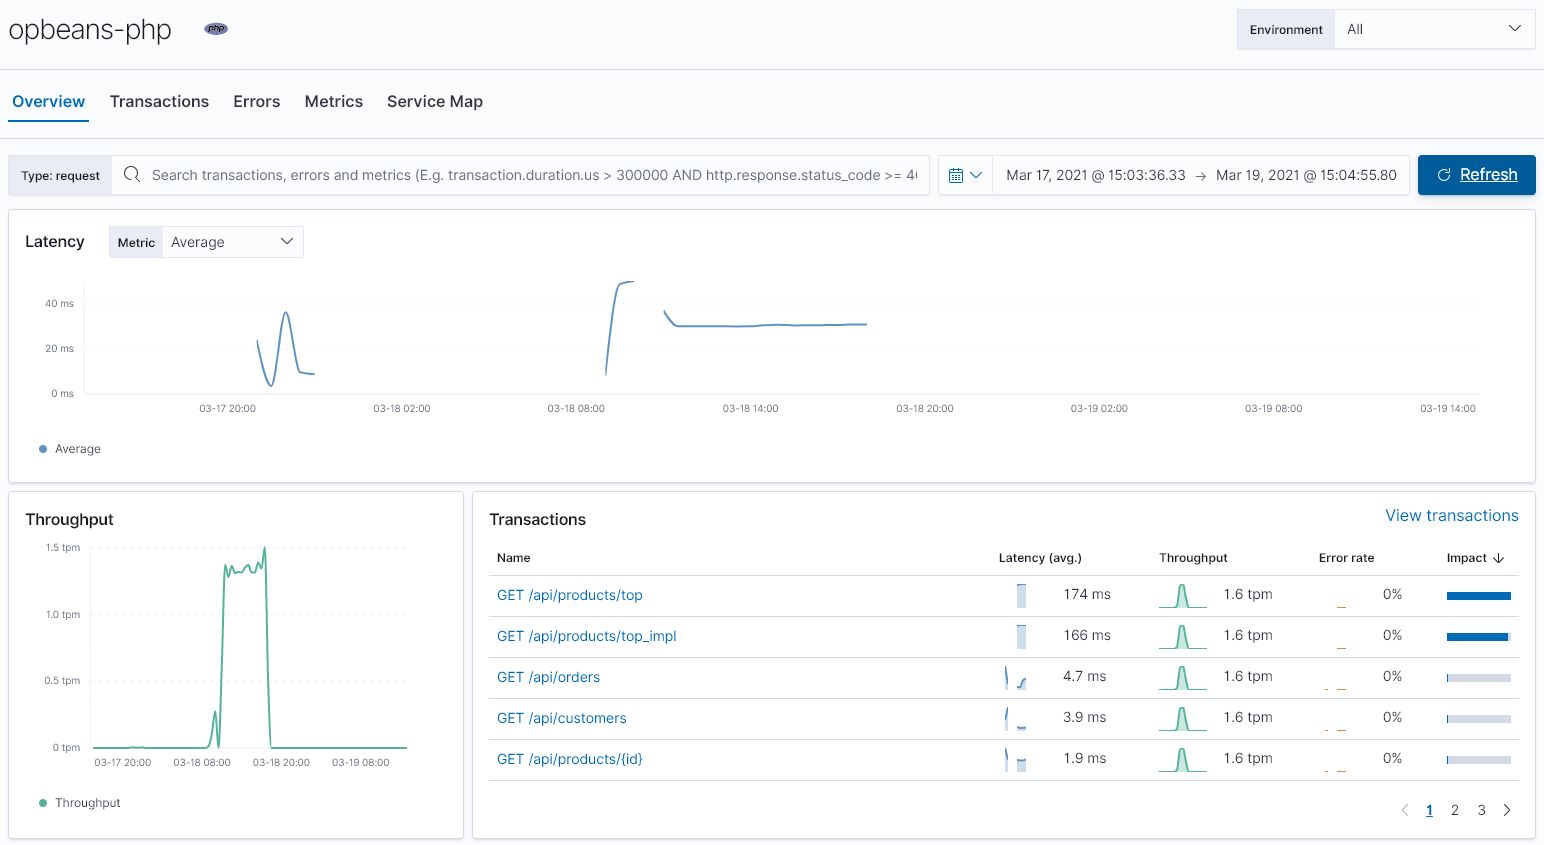
The next step might be to check the overview of your application health:

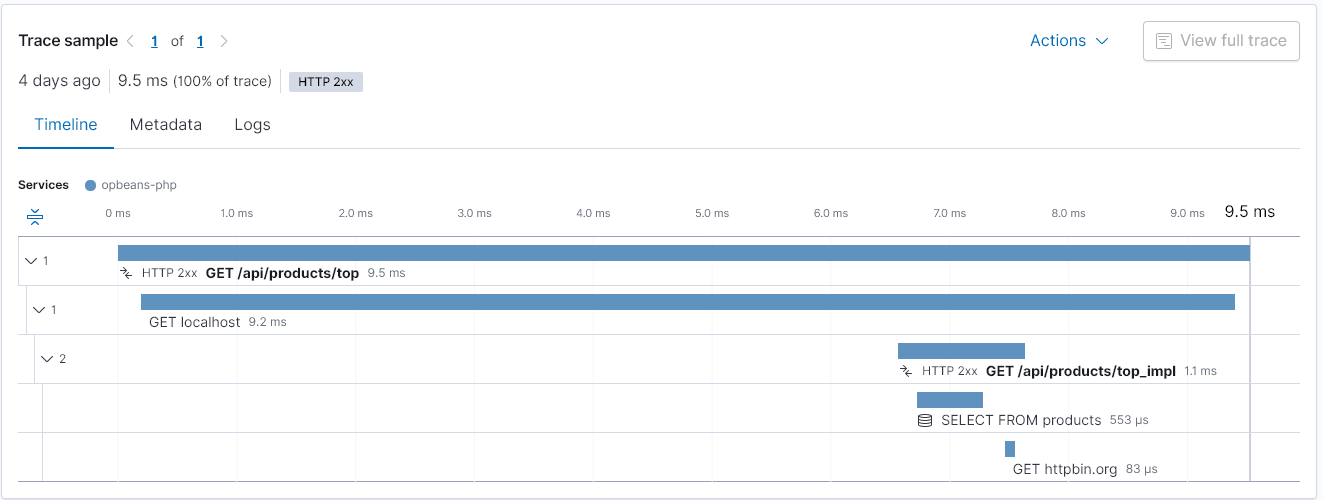
You can drill down to see a trace of a particular transaction:

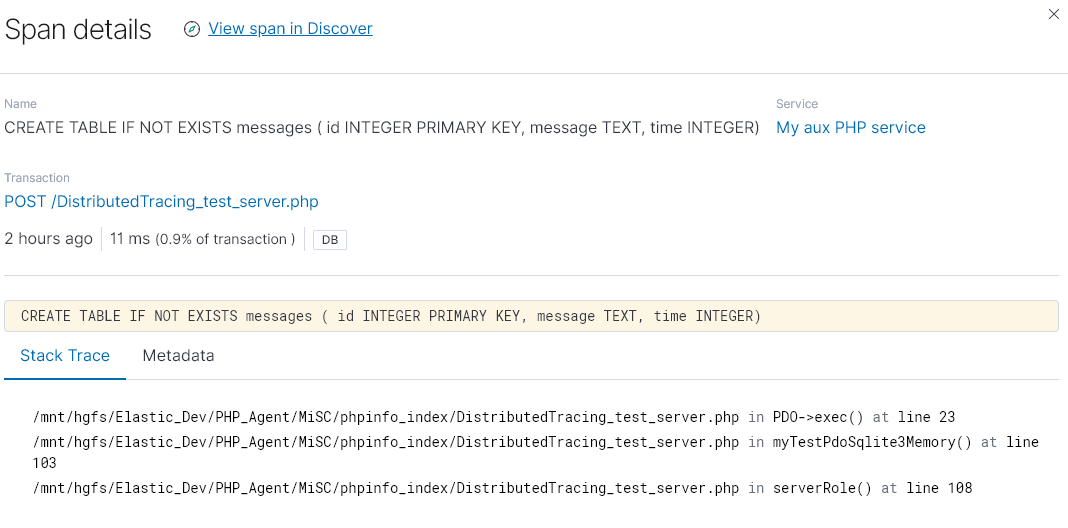
Furthermore, it is possible to drill down into the details of a span:

What’s next?
Of course we are just at the beginning of this journey with PHP within Elastic APM. We have lots of exciting things we are currently working on. Some examples are populating the “Time spent by span type” chart, support for APM Agent central configuration, and many other things.
We would be thrilled to get feedback in our discussion forum or our GitHub repository.
Additionally, we are always open for contributions, so feel free to check out the source code over at GitHub and open a pull request.