Detection engineering — Maximizing analyst efficiency using Cardinality Threshold rules on your alerts


 Share on Twitter
Share on Twitter

 Share on LinkedIn
Share on LinkedIn

 Share on Facebook
Share on Facebook

 Share by Email
Share by Email

 Print this page
Print
As the Threat Detection and Response (TDR) team on Elastic’s internal Infosec team, one of our responsibilities is building, tuning, and maintaining the security detections used to find and stop attacks against Elastic systems. This includes the Elastic Cloud environment, which currently spans 50+ cloud regions and four different cloud providers ingesting more than 1.5 petabytes of data per day.
We also work very closely with our Incident Response team and the analysts triaging alerts so we can feel their pain when detections don’t work as intended. Within Elastic, we call ourselves Customer Zero and we always use the newest versions of our products. We meet every week with the development teams that are building Elastic products to provide real-world feedback, bug reports, and feature requests to make our products better for customers and ourselves.
The problem with noisy rules
Finding the true positives within the flood of alerts is one of the biggest challenges for any security operations center (SOC). Every SOC has finite resources for dealing with alerts. Most SOCs have expected response times for investigating an alert based on its severity.
For example, a critical severity alert could use PagerDuty to notify an analyst and require an investigation within minutes, while a low severity alert could be included in a daily report and require review within the next working day. The cost of investigating a false positive can increase dramatically with the severity of the alert. If your analysts are investigating a false positive, that’s time spent not investigating a true positive.
One of the best ways to reduce false positives is to update the rule logic or exception list to filter out the known false positive events. The challenge with filtering events is that you have to balance the goal of filtering out noise while still keeping the detection effective.
Sometimes, depending on the environment, it’s impossible to completely filter out the false positives without reducing the usefulness of the detection rule. If you overly filter or disable your detection rules, you risk missing a real attack. However, if you leave them on and the alerts are noisy, the analysts will get overwhelmed and overworked. When this happens, they will suffer from alert fatigue. Alert fatigue can lead to analyst burnout, resulting in a higher turnover of personnel and increased risk of not detecting or responding to an attack in time.
Threat actors understand this and often use custom binaries or built-in commands to avoid detection and blend in with the noise. This technique is often referred to as “Living off the Land.” Elastic Security comes with many built-in detection rules to detect these types of actions. The problem is that installed software, updates, admin scripts, and occasional user activity can often run the same commands as an attacker, setting off these alerts.
If you enable every prebuilt detection from Elastic or any other SIEM on a production network without filtering, you will immediately see the level of noise that SOC analysts have to deal with. You can reduce this noise by constantly tuning and adding exceptions to your detections, but it is impossible to get to zero false positives in a production environment without impacting visibility.
[Related article: Why almost half of organizations want to replace their SIEM]
The difference between true and false positives
Something the Elastic Infosec Detections team noticed was that, when the false positive alerts are caused by legitimate software or user activity, security analysts will often see a single alert being triggered multiple times on a host without any related alerts. When new software is installed in your network, you may see a single noisy detection rule creating the same alert hundreds of times on multiple hosts without any additional alerts being triggered on those hosts. When this happens, it’s likely that you aren’t under attack, you just need to add a new exception to that rule to filter out the changes.
In contrast, when you see a real threat or malware activity, it will often trigger several different alerts on a single host or associated with a single user account as the attacker moves through the phases of the MITRE ATT&CK matrix corresponding to the attack lifecycle. If the attackers are trying to actively avoid detection, the alerts will often be low severity alerts that analysts don’t normally respond to immediately because they are noisy and resemble normal activity in the network.
As the attacker proceeds from initial access to privilege escalation, establishes persistence, impersonates users, scans internal networks for potential targets, moves laterally, and attempts to steal data from the network, they will set off many high, medium, and low severity alerts along the way.
You can see this behavior in the campaign and malware analysis posts published in Elastic Security Labs. These reports include the detection rules that are triggered by the threat actors at the end of each report, and there are almost always multiple different alerts. For example, in the recent Blister malware campaign, the attacks potentially triggered five different prebuilt detections. Four of the five detections are medium or low severity and could be overlooked by analysts. However, when several different alerts go off on a single host, you will want to escalate the response to a high or critical severity. If you want to test this out yourself, you can see this by creating a Malware Sandbox with Elastic Cloud and detonating malware on your test environment with the prebuilt rules enabled.
A solution to having a faster response to this type of activity without overwhelming analysts is to use threshold rules within Elastic SIEM to create new alerts when there are multiple different types of alert per entity. To maximize analyst efficiency, we set the noisy rules to a low severity level and create a new high severity alert that the security analysts can prioritize once we have multiple different alerts on a single “entity.” An entity can be a host, a user, an IP address, etc.
The low severity alerts are reviewed in bulk within the SIEM, but we do not send Slack push notifications to the analysts each time a low severity alert triggers. The medium, high, and critical severity alerts use the Actions feature to push notifications directly to the analysts via Slack. This lets us keep noisy rules enabled and useful without overburdening the analysts with constant push notifications and alarms. If we have a rule that is noisy but challenging to tune, we can keep it enabled but set to low severity.
Real-world example: Detecting TLS break and inspect activity
If a threat actor wants to collect the encrypted network traffic from a host, they will need to take multiple actions. The first step is to get between the process making the connection and the destination server. This can be done by using an implanted device (such as an infected router), or by configuring a proxy on the workstation. The next step is to install a root certificate on the host so the applications will trust the malicious proxy and not generate warnings and errors from untrusted certificates.
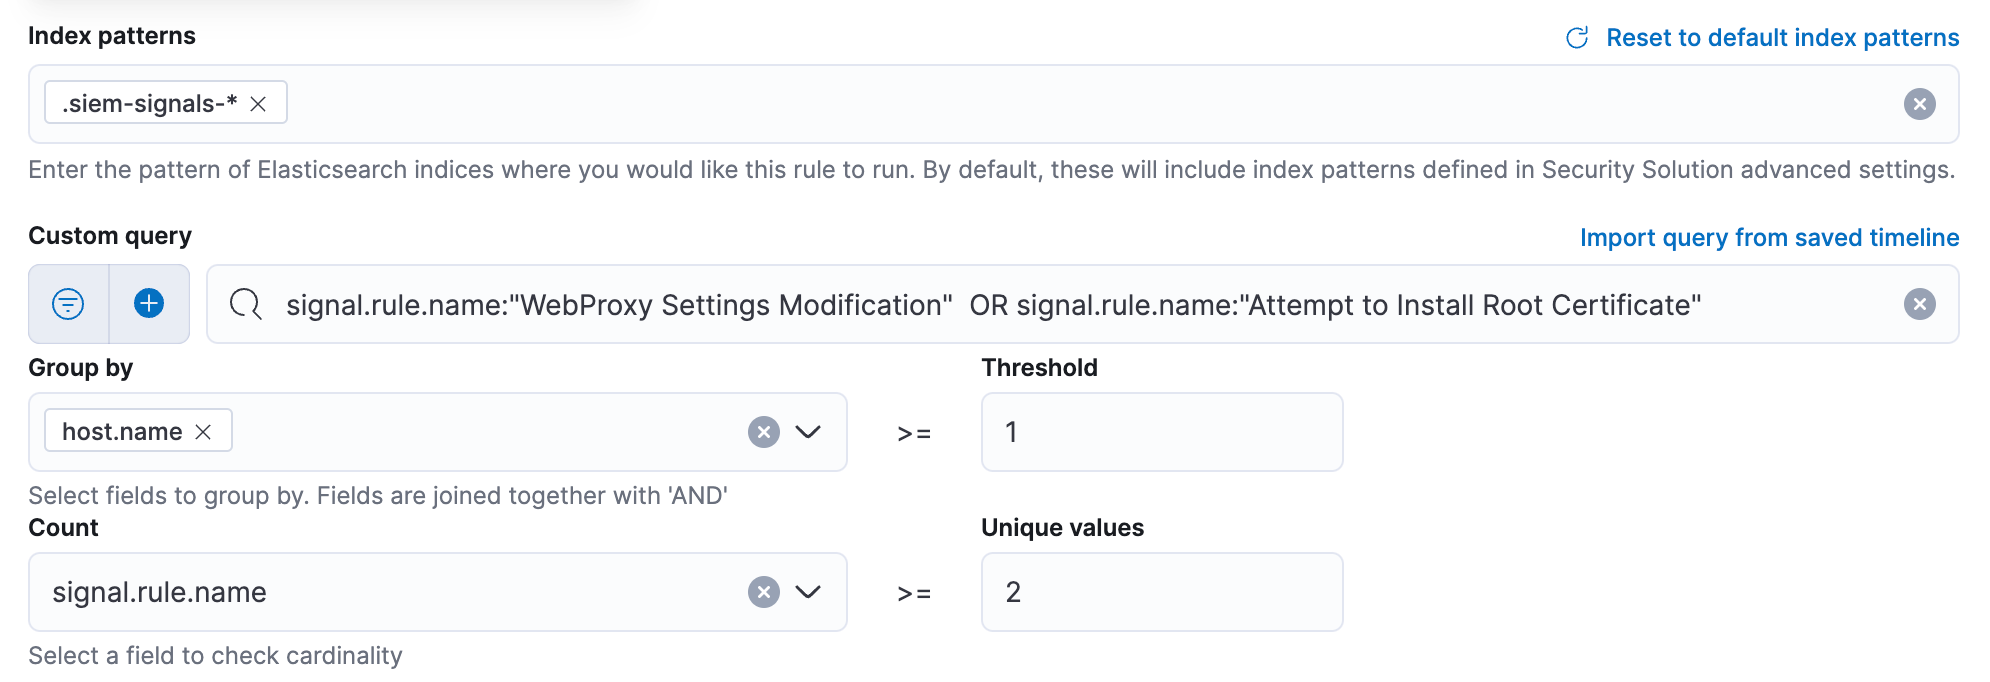
Elastic’s prebuilt rules include a rule for MacOS systems to detect modifications being made to the WebProxy settings. This detection rule will trigger any time a new WebProxy is configured to intercept web traffic from a host. Because there are many legitimate reasons to install proxy software on a system, this detection rule can have a high number of false positives. Often, VPN software will update the WebProxy settings every time the user joins or disconnects from a VPN. Even after filtering out many common VPN products, we still saw 200+ alerts for this rule from around 2,000 MacOS systems over the last year. Because there are so many legitimate reasons to change these settings, this rule should not be configured to send push notifications to SOC analysts. So, we set the severity of this rule to low.
Another prebuilt rule for MacOS will alert when there is an Attempt to Install a Root Certificate. Depending on the environment, this detection rule can generate a lot of false positives from legitimate software installing new root certificates. A common false positive is from document- or code-signing software installing their certificates. For this detection rule, we have seen around 250 alerts in the last year.
On their own, each of these detection rules is low severity and causes many false positives. However, if both detections are seen on a single host within a 24h time period, there is a much higher chance that something is attempting to intercept the encrypted network traffic from the host. For these two detection rules, we made a special critical severity threshold rule that alerts us when both detections are observed on a single host within the last 24h.
Over the last year, this alert has only triggered once and it was a non-malicious true positive. In this case, it was a software developer installing an application that intercepts encrypted traffic to help troubleshoot a web application they were building. By using threshold rules, we were able to reduce the number of alerts pushed to analysts from 450+ to a single alert. We have included the detection rule below so you can create your own version.
How to use Threshold Rules to detect multiple alerts on a host
To get started, navigate to the Rule Management page within the Security app and click Create New Rule. Within the Rule creation interface, select Threshold to begin creating a new custom Threshold rule. Threshold Rules can be used to aggregate events and generate alerts based on the number of events matching a query exceeding a threshold, or when the cardinality (number of unique values) is more than a certain value.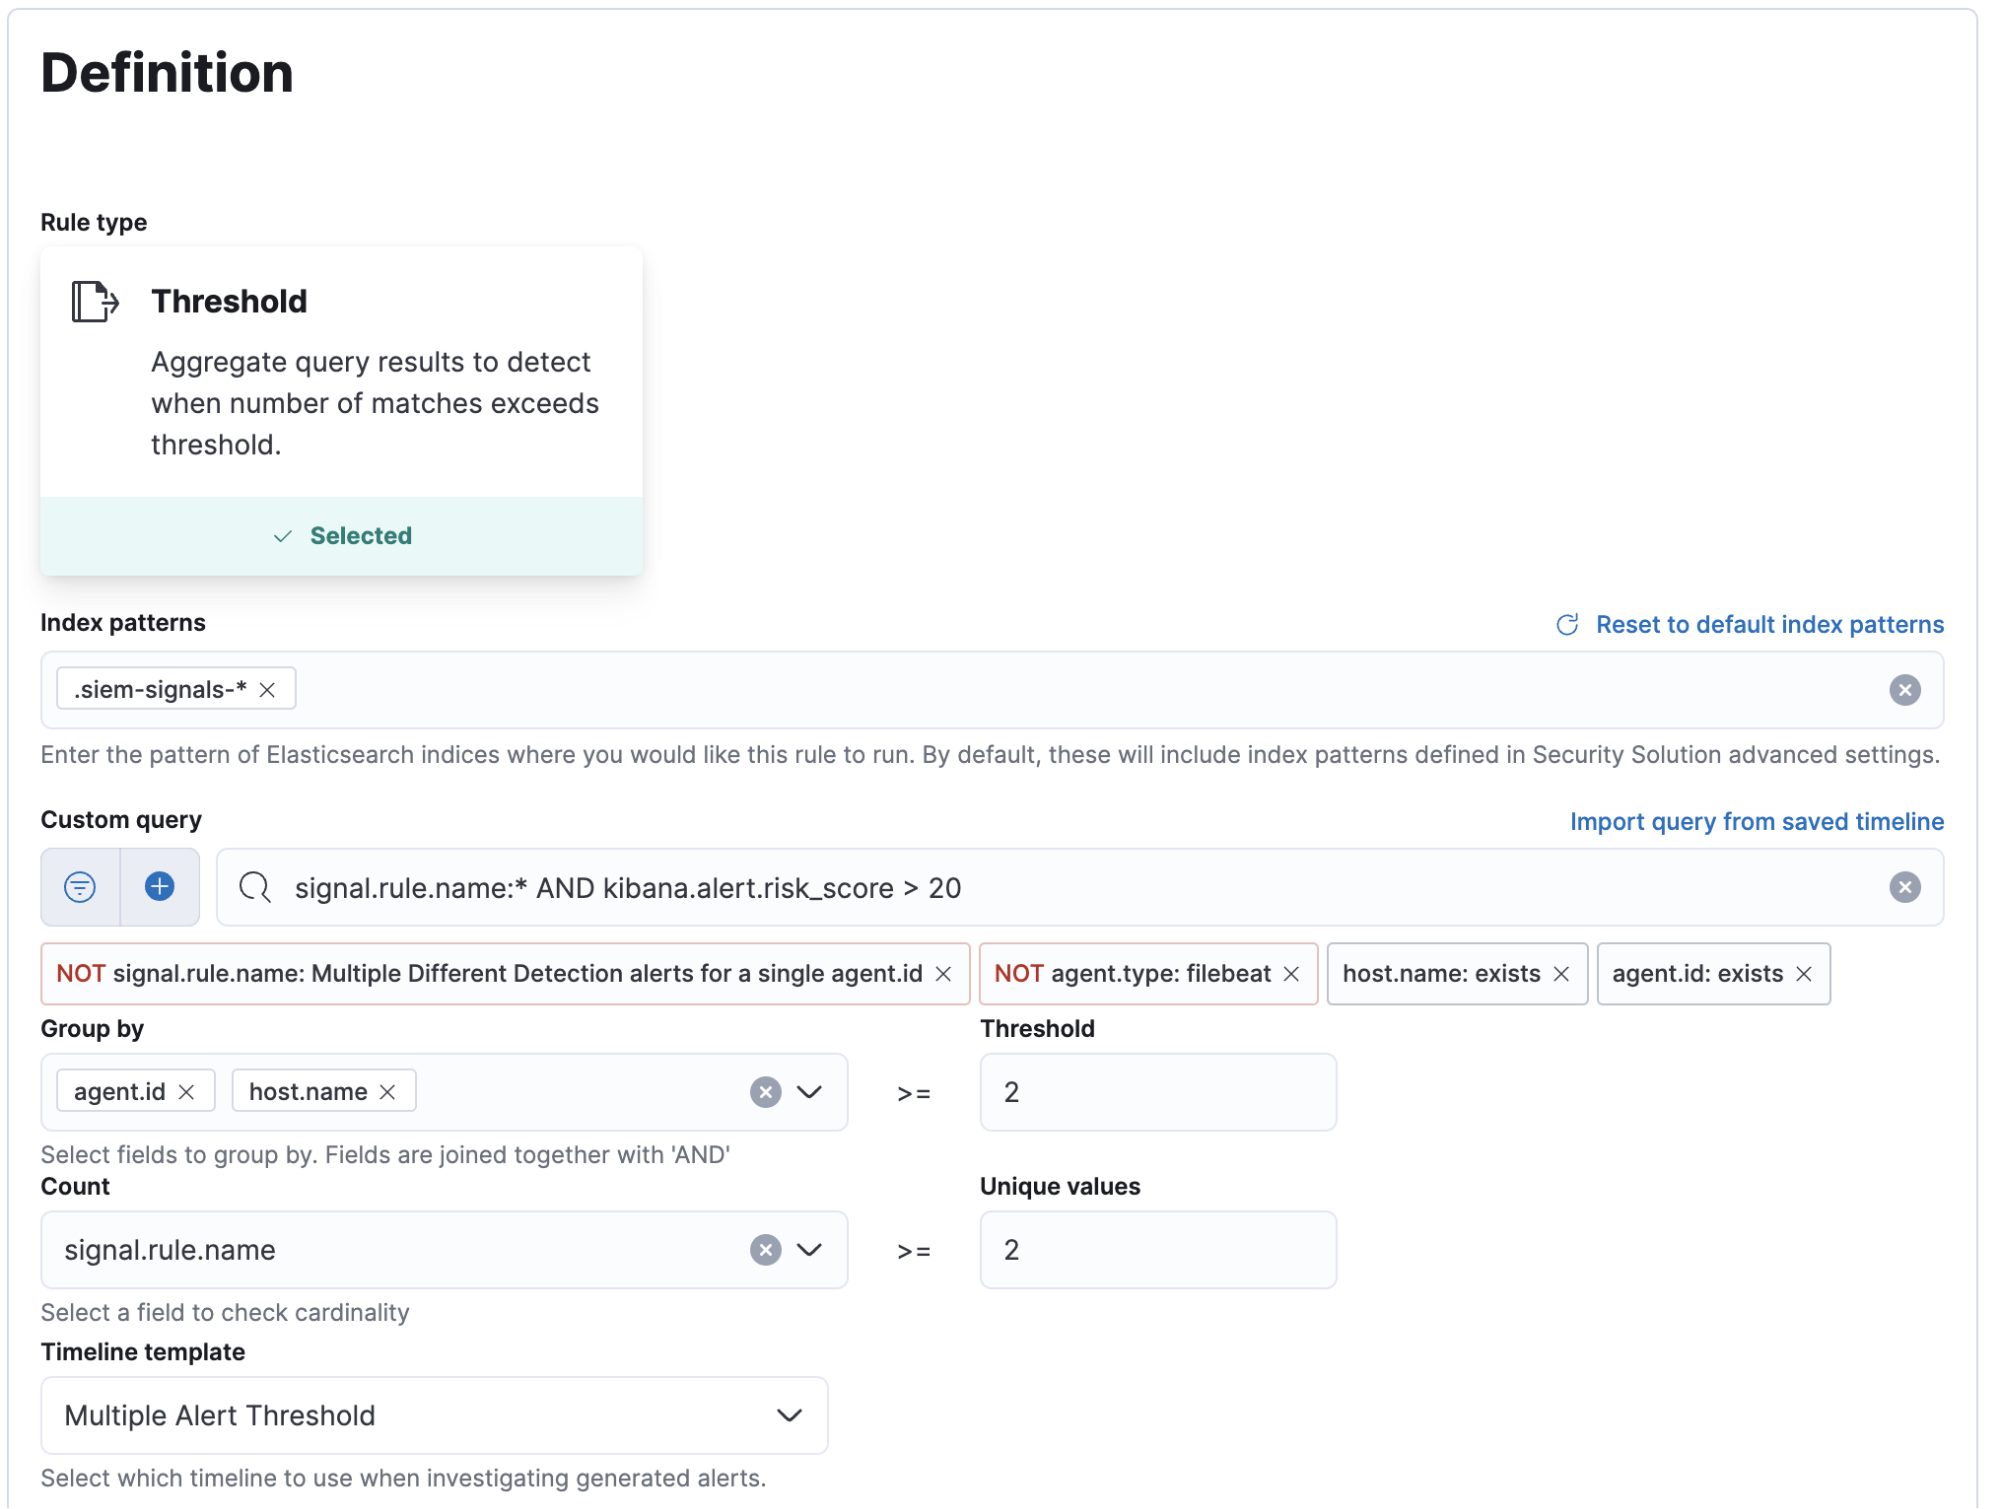
Setting the index pattern
All alerts in Elastic Security are written to an index so you can create alerts on your alerts. To do so, you will need to set the index pattern to use the .siem-signals-* index. If you are using multiple Kibana Spaces with detection rules enabled, you will want to include the space name in the index pattern. For example, use .siem-signals-SPACENAME* so you don’t mix alerts from different spaces.
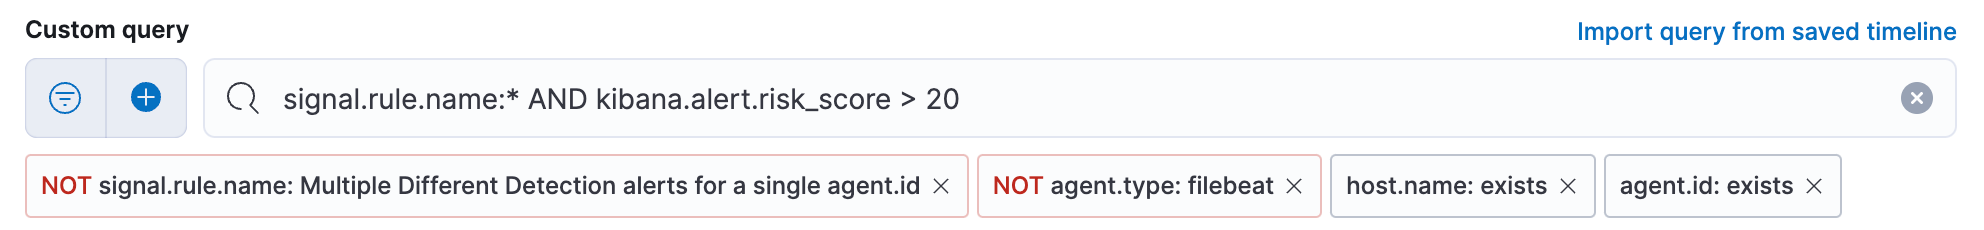
Building the Custom query
After setting the index pattern, you will need to create a query to select only the rules you want to use in your aggregations. You can not leave this blank, so you will need to add a query that returns all of the detections you wish to aggregate. We chose to use the query signal.rule.name:* to do this. This query will return all alerts from the index. In addition to this base query, you will probably want to filter out certain events from the aggregation.
- At a minimum, you will need to filter out alerts from the threshold rule you are creating. If you don’t filter out these events, your threshold rule could alert on its own past alerts, which could lead to a noisy cascade of redundant alerts. Trust us, we learned this the hard way.
- If you are aggregating on a field like host.name you will want to filter out alerts from filebeat agents collecting data such as AWS or Okta logs because all events from a filebeat agent have the host.name value of the host that filebeat is running on.
- You will want to filter out any events where your ‘Group by’ field doesn’t exist, otherwise you may have unrelated events that are grouped together because they will all have a null value for that field.
- If you want to exempt certain low risk rules from this rule, you could add logic to your query to limit results by risk_score or any other field in the alerts.
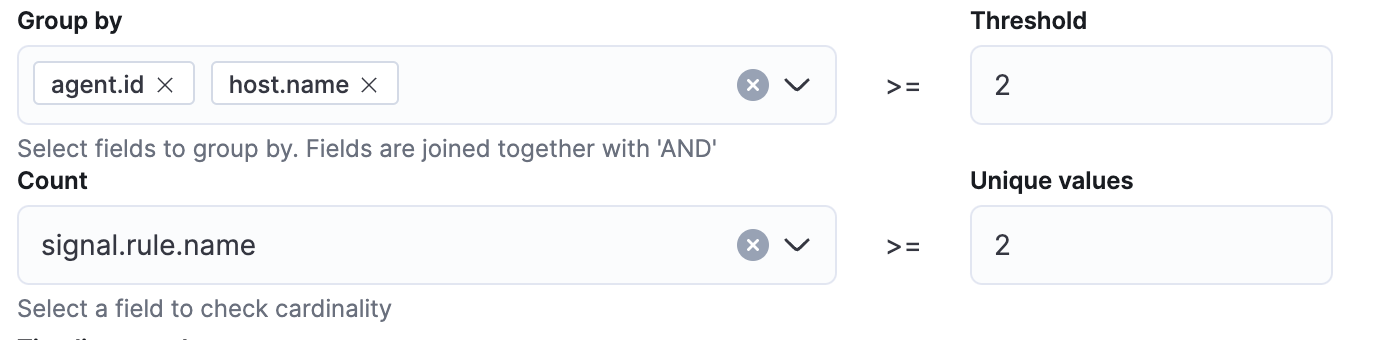
Group by and cardinality fields
After your query is created, use the Group by and Threshold fields to determine which source event field is used as a threshold and also the threshold’s value. For example, if agent.id and host.name are used with a threshold value of greater than or equal to 2, it will evaluate any group of alerts where the same agent.id and host.name have generated two or more events during the time range of the query. The Count field is then used with the signal.rule.name field to check if there are two or more different alerts on those matching events, and if so a new alert will be created.

Scheduling the detection
After creating the logic of your query, you will need to give the rule a name, set the severity, add some documentation for how analysts should respond to the alerts, and set the schedule for how often the alert will run and how large of a time window will be queried each time.
When scheduling these alerts, the first option of Runs every will set how often the rule will run. The second option of Additional look-back time will help determine how large of a time window will be queried each time the rule is run. For example, if both options are set to 1 hour, the query will run every hour. Each time it runs, it will query the last 2 hours worth of events.
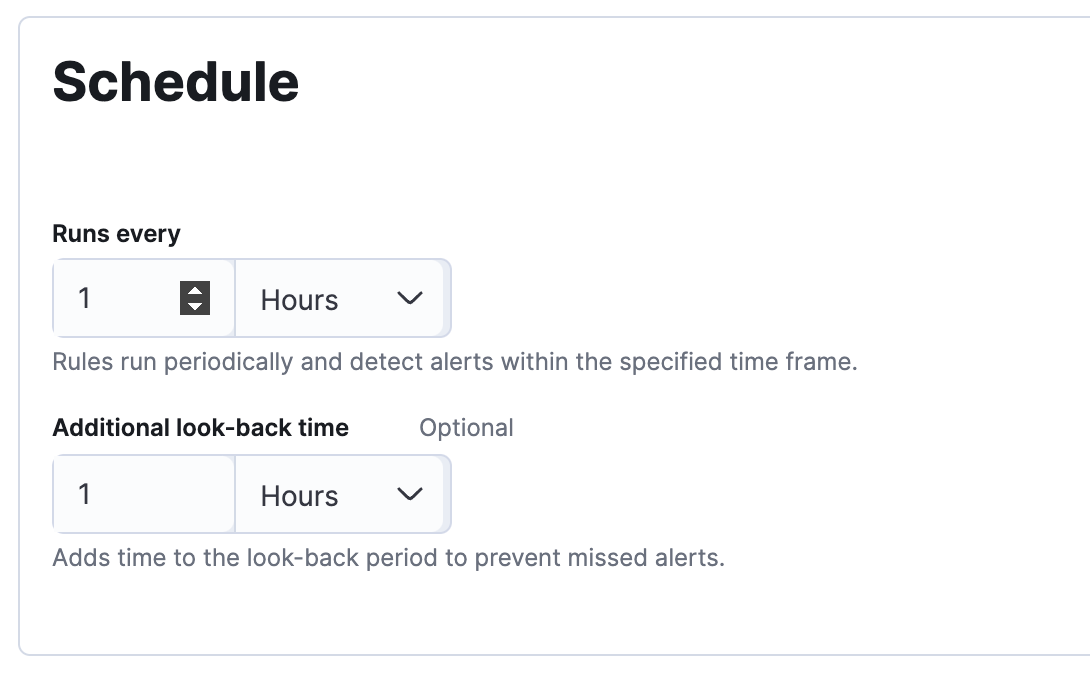
There are trade-offs to having a larger or smaller lookback time that you will want to consider. Having a larger lookback window of 12 or 24 hours can help you catch the more stealthy attackers that are trying to blend in by going slow; but you have a higher chance of false positives from unrelated low severity alerts. Having a shorter time window of 1 or 2 hours will reduce the number of false positives and help you identify spikes of different alerts on a host; however, there is the chance that a very careful attacker could avoid detection.
You will need to experiment a little with different lookback times to determine one that works for your team and environment. The lookback time you use in your network will primarily be determined by the resources you have available to investigate alerts. If you have a small team, you can use a shorter lookback time to reduce false positives while still detecting spikes. If you have a larger response team, you can have a longer lookback time at the cost of more false positives. You can also create multiple versions of your rule with different lookback times and different severity levels.
Recommended Threshold Rules
Luckily, Elastic doesn’t limit the number of queries or detection rules you create. You can fully customize your experience and create several different threshold alerts in your SIEM to generate different detections for different scenarios, create rules with different look-back times and severity levels that fit with your processes, and you can create several threshold detections that group by other field names. Here are some recommended threshold rules that you could apply in your Elastic SIEM:
Multiple different alerts on a single host.name and agent.id
We use both the agent.id and host.name fields together for this detection because you will sometimes have multiple hosts with the same name.
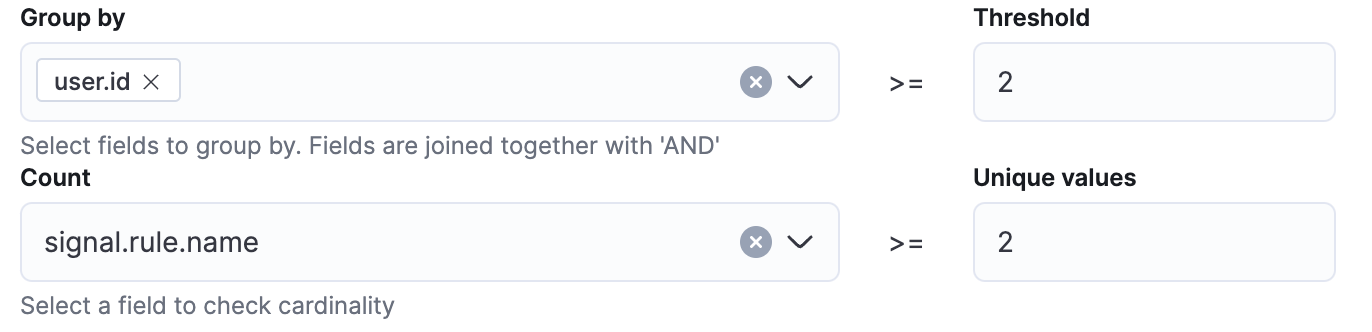
Multiple different alerts on a single user.id
In a Windows domain, the user.id field is the unique identifier for that user within the domain. This alert could identify a compromised account causing multiple different alerts to trigger. If you are collecting logs that contain the user.email field such as Okta or AWS logs, you could make a version of this rule using user.email field instead.
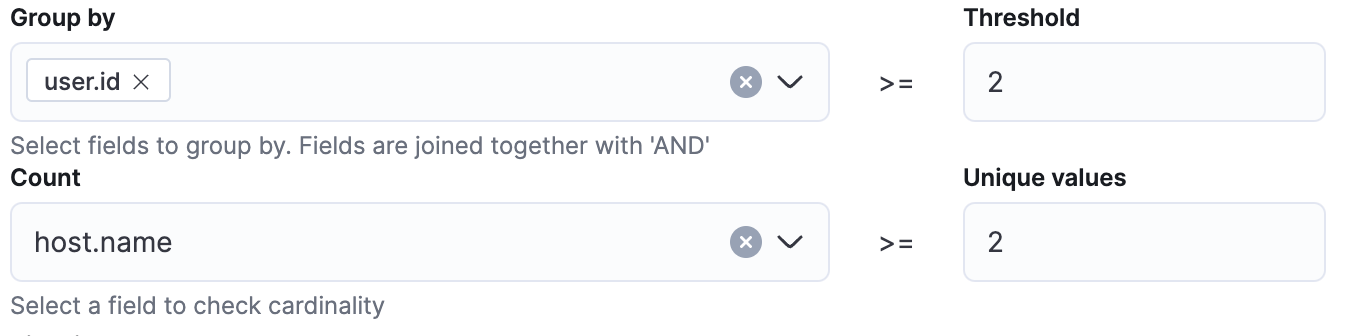
Multiple different host.name alerts on a single user.id
Instead of checking the signal.rule.name field for cardinality, this rule uses the host.name field. This will alert you when a user’s account is triggering alerts on multiple different hosts in your network. This could be an indication of a compromised account being used for lateral movement. A common false positive could be an administrator or service account that is used to push out updates, so those may need to be filtered out in your query or exceptions, but do that with caution because then you may not detect it if one of those accounts is compromised.
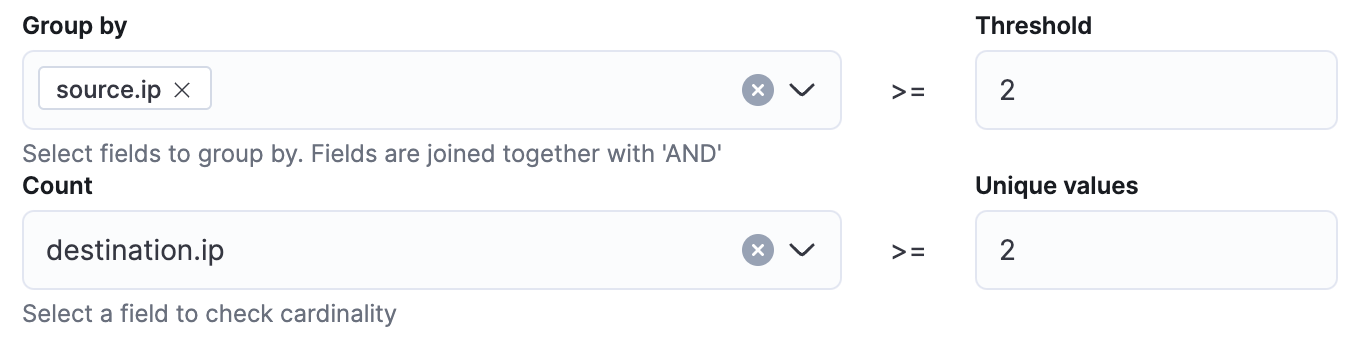
Multiple alerts with different destination.ip for a single source.ip
If you have alerts that use network data, you can use this threshold rule to create a new alert when a single source.ip has targeted two or more different destination.ip. This could be an indication of a network attack or scanning.
Detecting TLS break and inspect activity
This detection is the detection rule mentioned above and it works by alerting when both detection rules have been observed during the time window. Because this is looking for two specific detection rules, the time window can be set to a larger size without causing as many false positives.
Conclusion
Using Threshold Rules to create alerts on your alerts is a great way to maximize your analyst effectiveness without sacrificing visibility. We have found that by using these rules, our security analysts are spending less time investigating false positives and they are responding faster to the alerts that matter.
Share
- Share on Twitter
Share on Twitter
- Share on LinkedIn
Share on LinkedIn
- Share on Facebook
Share on Facebook
- Share by Email
Share by Email
- Print this page
Print