How to build a malware analysis sandbox with Elastic Security
As a security analyst on Elastic’s InfoSec team, a common scenario we see is users coming to our team and asking: “Is this file safe to open?” Or one user reports a phishing email with an attachment that they didn’t open, but we see from the logs that 10 other users also received that email but didn’t report it and no alerts went off on their systems. A common attack we see is phishing emails containing attachments that do not contain malicious code and thus do not set off any alerts, but they attempt to social engineer a user to steal their password.
In these situations, the security team needs to quickly find out what has occurred on one of their systems when a file is executed to determine whether it would have been detected or stopped. If it wasn’t, they need to quickly understand what actions were taken on the host. In these cases, the security team needs to have a well-instrumented virtual machine (VM) sandbox that they can use to safely execute the file in question and observe what happens. The Elastic InfoSec team is always pushing the limits with Elastic products as part of our Customer Zero effort so we decided to build a sandbox using Elastic products.
In this blog post, I will demonstrate how the Elastic InfoSec team uses Fleet and Elastic Security as a fully instrumented malware sandbox. Not only is Elastic a natural fit for instrumenting and collecting data from a sandbox, it is also easy to build and can be created within minutes.

What is dynamic malware analysis?
Dynamic malware analysis is the act of executing and observing a suspicious piece of software inside an isolated VM. The goal of dynamic analysis is to learn:
- What processes the malware executes
- What changes it makes to a host
- What network connections it makes
- What files it downloads for the second or third stage of the attack
After observing the malware, you can take the information learned to create new detections and defenses, or hunt for other malicious activity within your network.
Why Elastic?
If you have ever created a sandbox environment for observing and analyzing malware, you know that setting up your sandbox can be a time-consuming process involving installation and configuration of dozens of different pieces of software. This can involve installing and configuring a collection of software such as Wireshark, Regshot, and ProcMon to manually step through the execution of the malware while observing and documenting the actions.
There are advanced dynamic malware analysis sandbox systems such as Cuckoo Sandbox that have lots of features and capabilities such as automation, but they usually require much longer to set up and configure and may not be necessary for every InfoSec team. Many of the phishing malware samples we have seen recently are social engineering attempts to steal credentials that require user interaction. In these cases the automated systems may not collect all of the indicators of compromise.
Some malware samples will check for the existence of many of these tools and stop executing, making them harder to analyze. Other malware will even actively search out these tools and kill the processes or overwrite the logs inside the sandbox. Because of this, dynamic malware analysis can be time-consuming when you are working an active incident that needs immediate attention.
Elastic Endpoint Security is a single agent that collects information about actions happening on the system and quickly visualizes the process tree for analysts. This makes for quick and easy investigation into what exactly happened and provides you with the indicators you need to improve your detections and protections. The Analyzer view in Elastic Security visualizes the entire process tree for you, showing you all the child processes and their associated indicators created by the initial malware process.

Creating your sandbox
There are several different reasons to use a malware analysis sandbox. For this use case, our goal is to have a virtual environment that is similar to a standard enterprise build, but that is also thoroughly instrumented so we can observe every action the malware initiates.
When creating your sandbox, you may want to create two images for each build: a ‘hardened image’ that is built with the same protections you have in your enterprise, and another ‘vulnerable image’ that has most of the protections turned off. The advantage of having two images is that the hardened image will show you what would happen in your environment if someone executed the file, while the vulnerable image will show you the full execution of the malware. In a large enough enterprise, there are almost always systems that have had some protections disabled, so I recommend both methods.
Creating test systems
The first step is to create the VMs used to execute the files. Any virtualization software can be used to build the images. I won’t be covering the setup of your virtualization software, but it is important to isolate the systems from your host and enterprise network as much as possible when executing the malware. In this scenario I will build a Windows 10 VM and a MacOS image. If you have a standard Linux build for your enterprise you could build one of those as well.
After creating your VMs, I recommend installing all of the commonly used software that you have in your domain, such as MS Office, Adobe Reader, or Python. Anything that your users would use to execute a file should be included in the sandbox. On your Windows VMs, I recommend enabling PowerShell ScriptBlock logging. ScriptBlock logging will save the full text of any executed PowerShell scripts to your Windows event logs that can be collected with Elastic Agent. When configuring your ‘vulnerable’ VM, you will need to change multiple settings to disable all of the built-in OS protections. Some advanced Windows malware will check to see if the host is part of a domain prior to downloading the second stage, so you may want to configure your VM to add it to a fake domain that has a similar name to your enterprise.
If you wish to also collect Sysmon data from the Windows host, you can do that as well. The Elastic Endpoint agent collects most of the same information as Sysmon, so you may want to customize the Sysmon configuration so as not to duplicate the data. Once you have installed and configured Sysmon, the Elastic Agent can stream those events to your cluster using the Windows integration.
Configuring your Elastic Security cluster
For this testing I used Elastic 7.10 running within Elastic Cloud. Setting up your cluster in Elastic Cloud is the easiest way to create and host a new cluster for testing and can get you up and running within minutes with all of the Platinum subscription features. If you want to build a completely isolated sandbox, you can set up your own on-prem Elastic Stack. If you’re going on-prem, you can follow these instructions to install the Elastic Stack, and everything covered in this blog is included free of charge through our free Basic tier.
After you have created your cluster in Elastic Cloud, you will need to log in and configure Elastic Security. If you want to watch a video walkthrough of the setup, we have one available here.
Setup
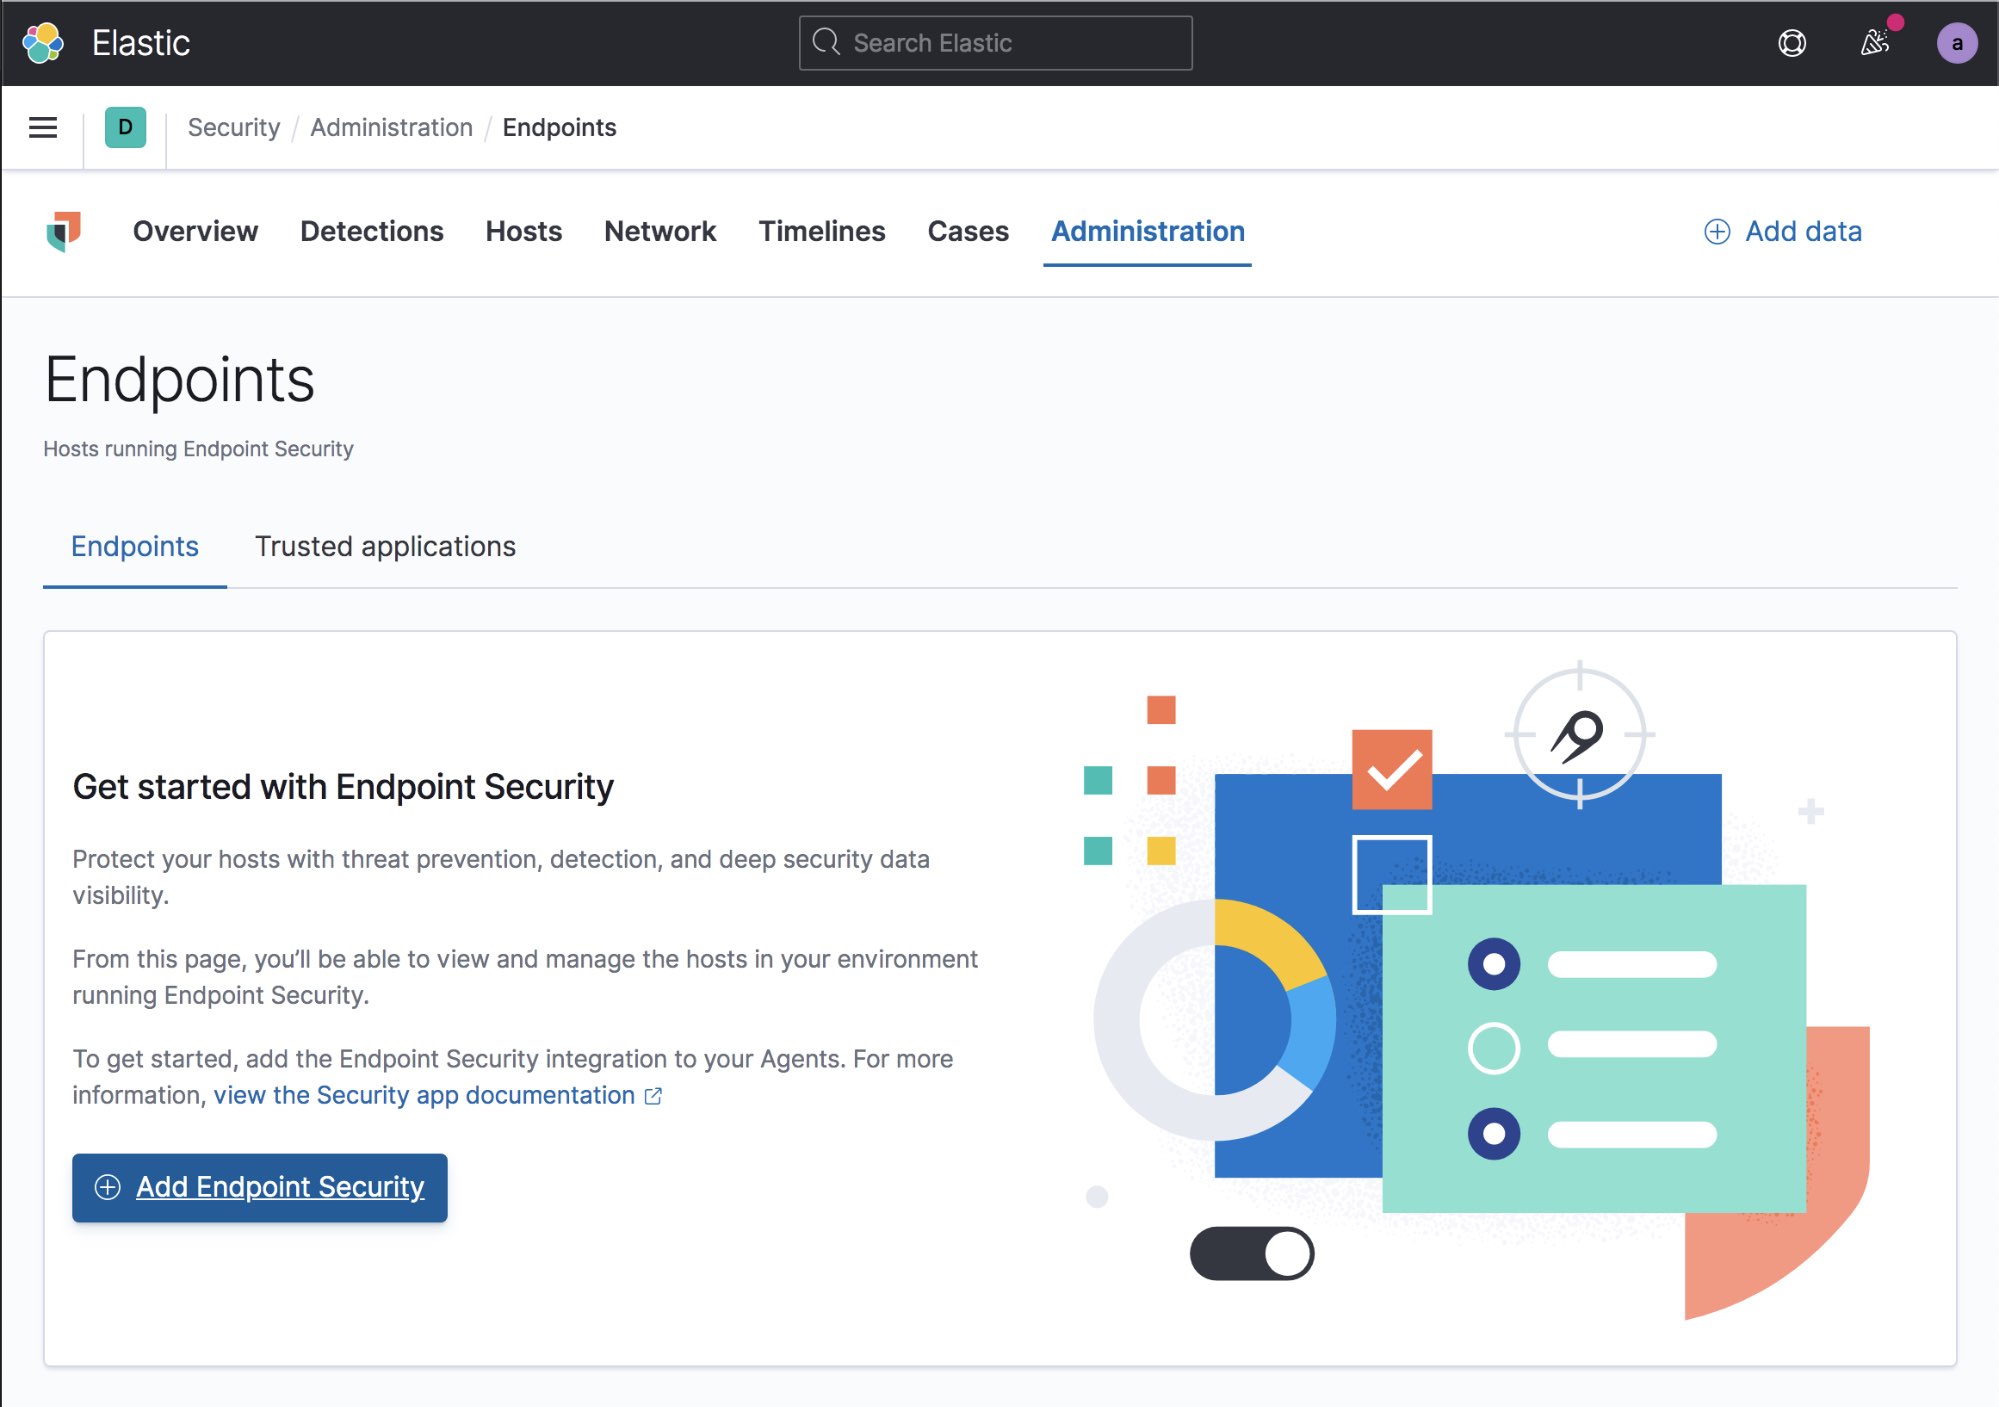
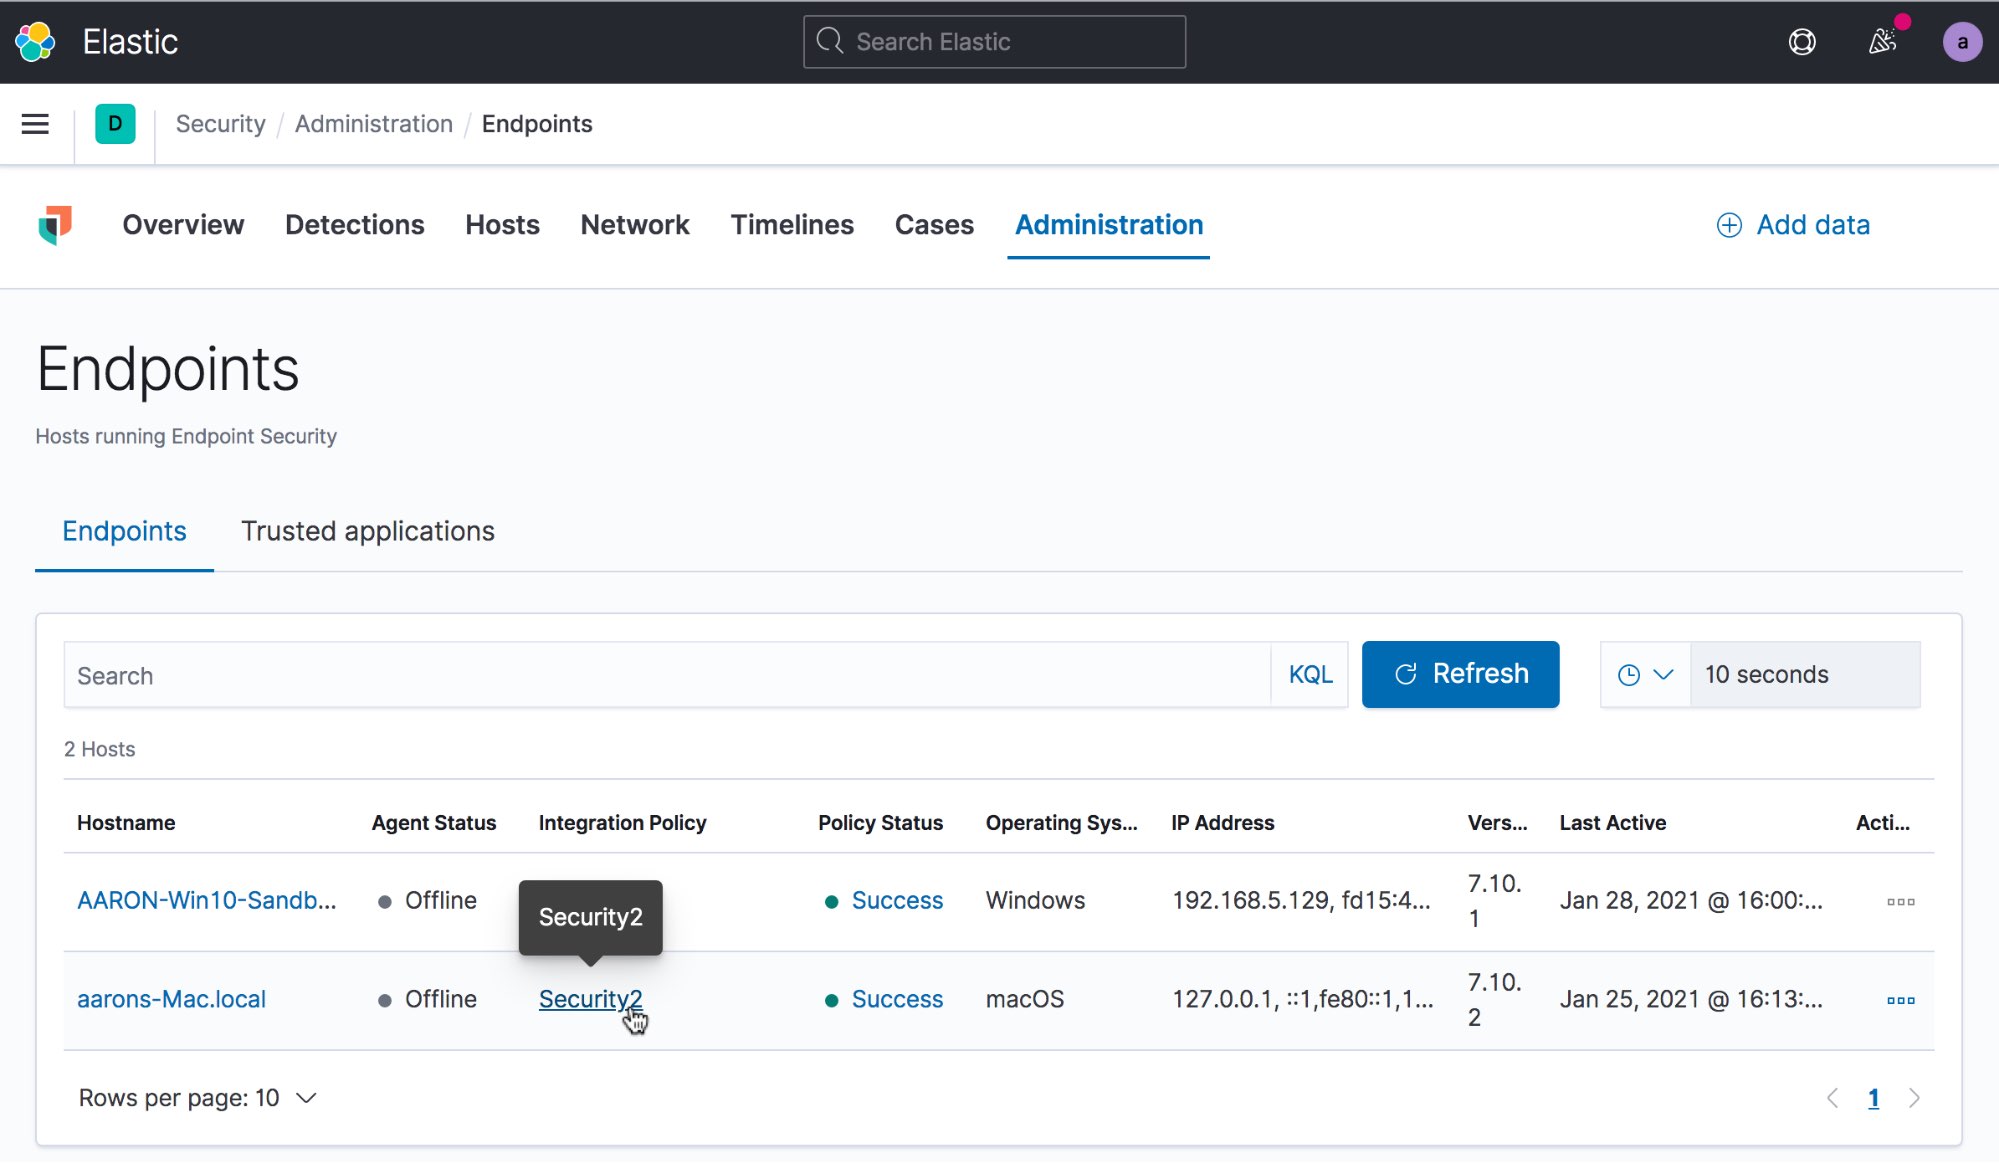
The first step is to log into Kibana as an administrator and navigate to the Security > Administration > Endpoints tab and select Add Endpoint Security.
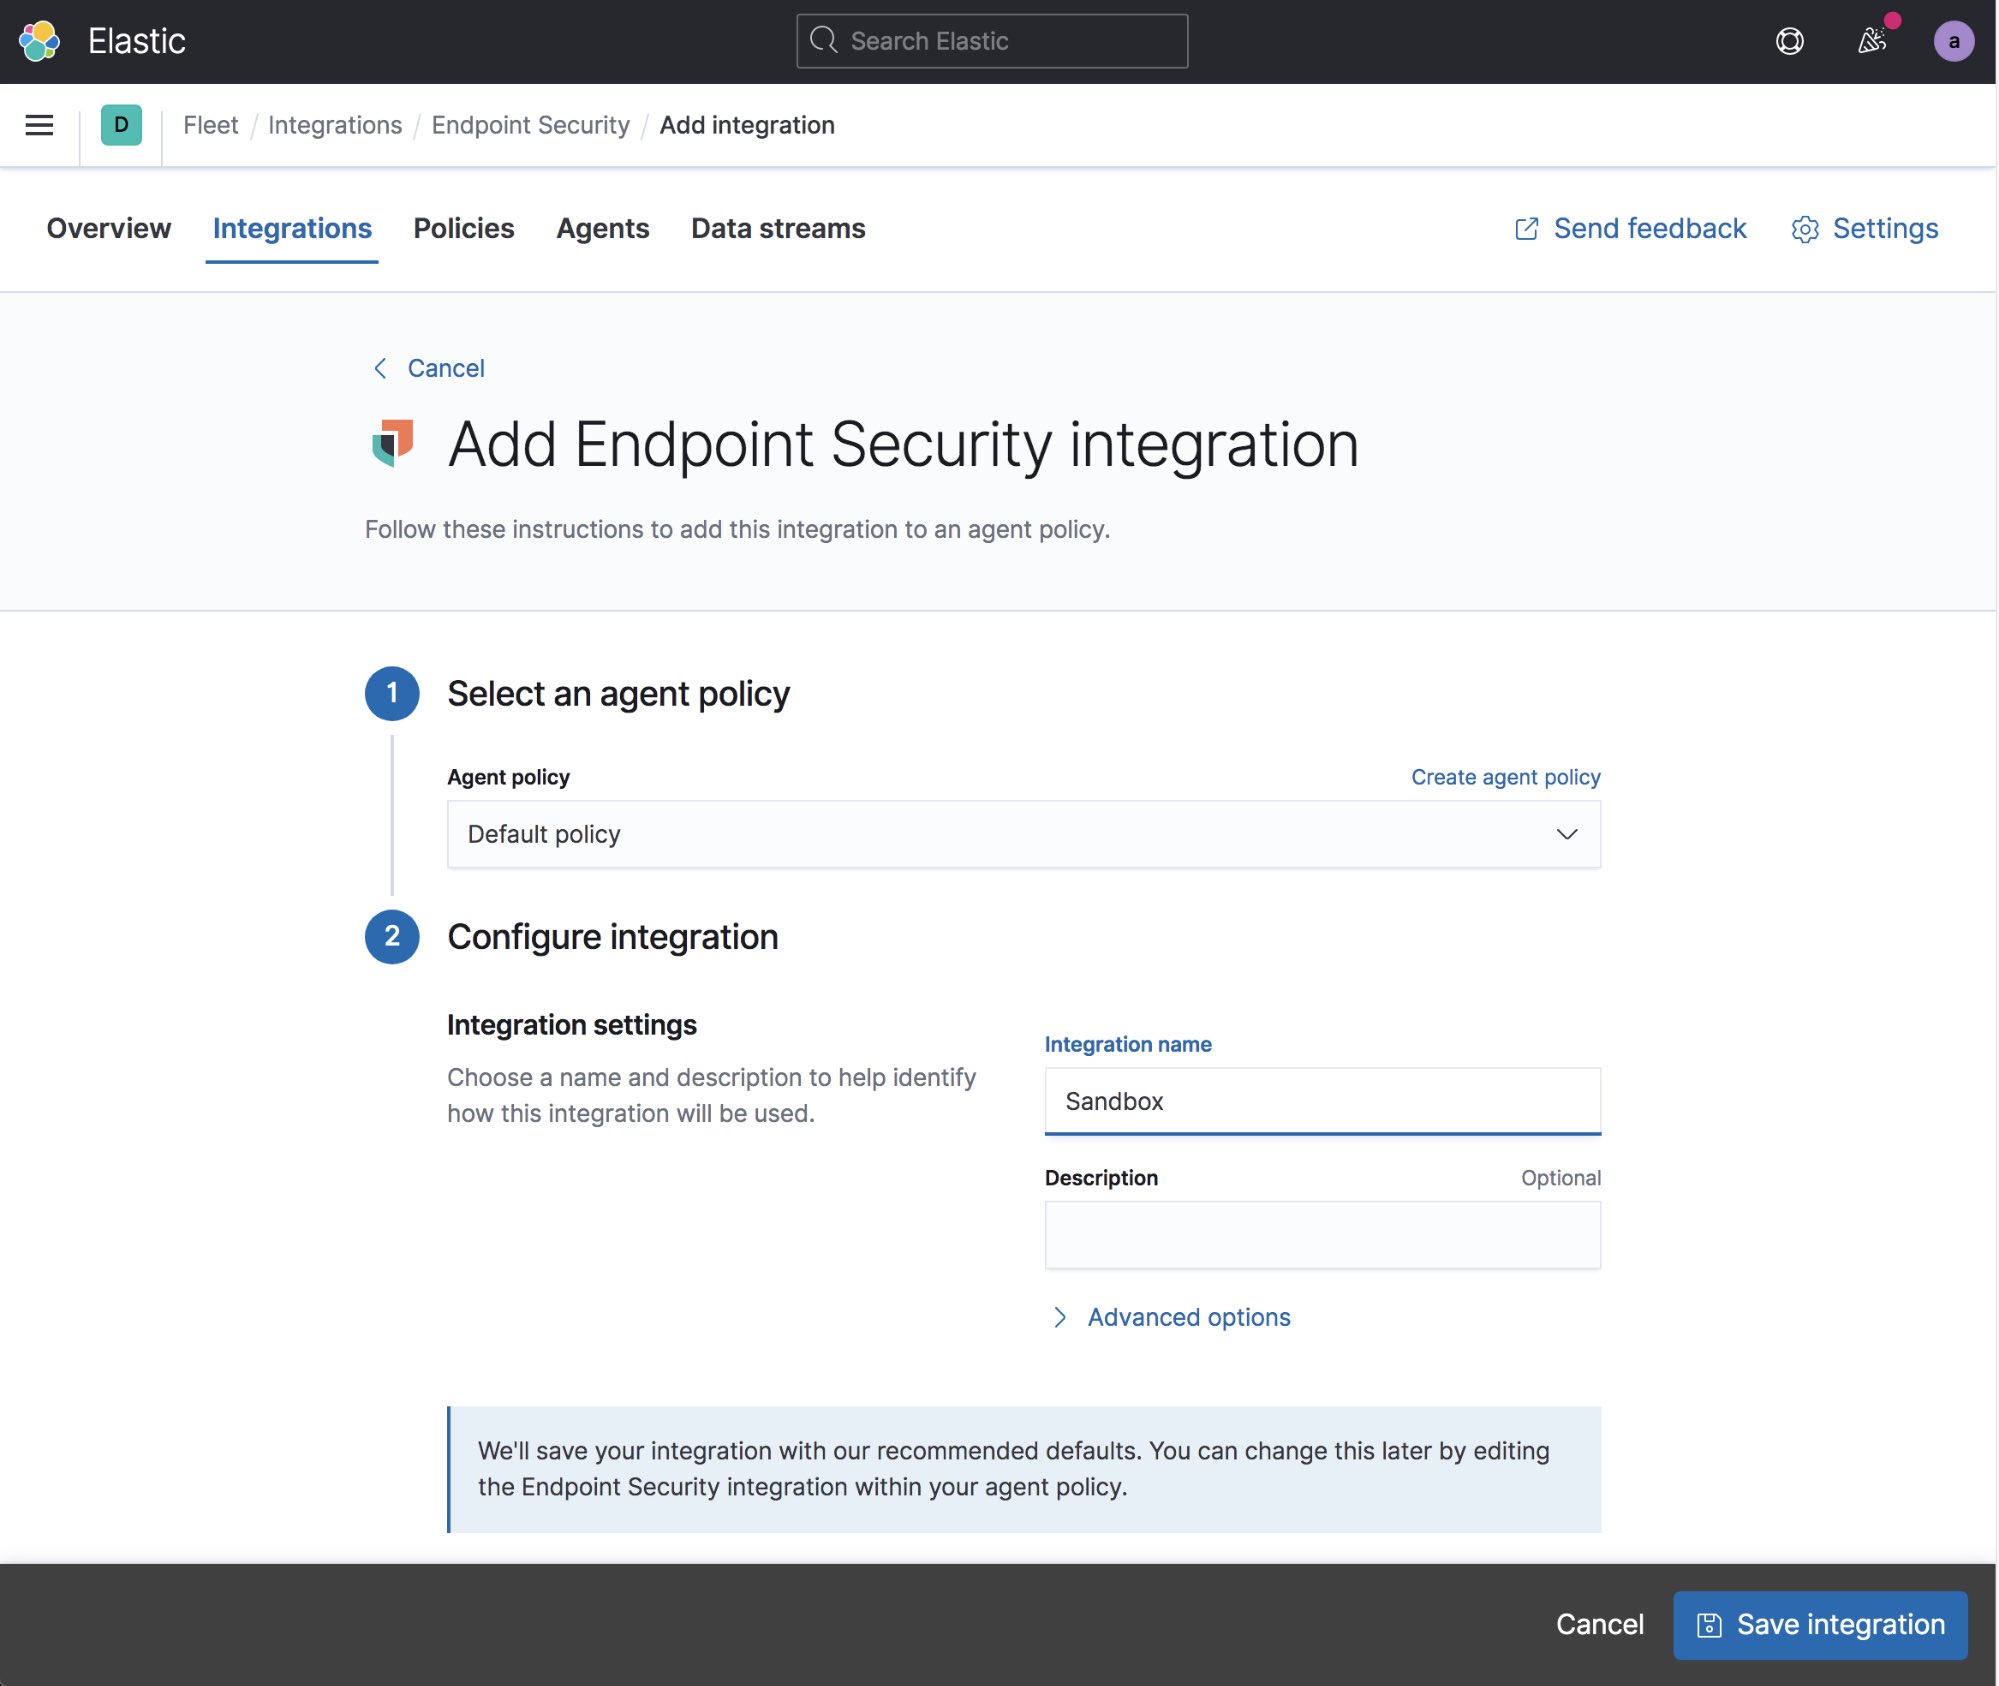
First you need to create a security integration. Give your integration a name and select Save integration. You can create multiple integrations and Agent policies, but the easiest thing to do for this sandbox is to use a single policy for all of your sandbox systems. A single policy will work for your Linux, Windows, and MacOS systems.
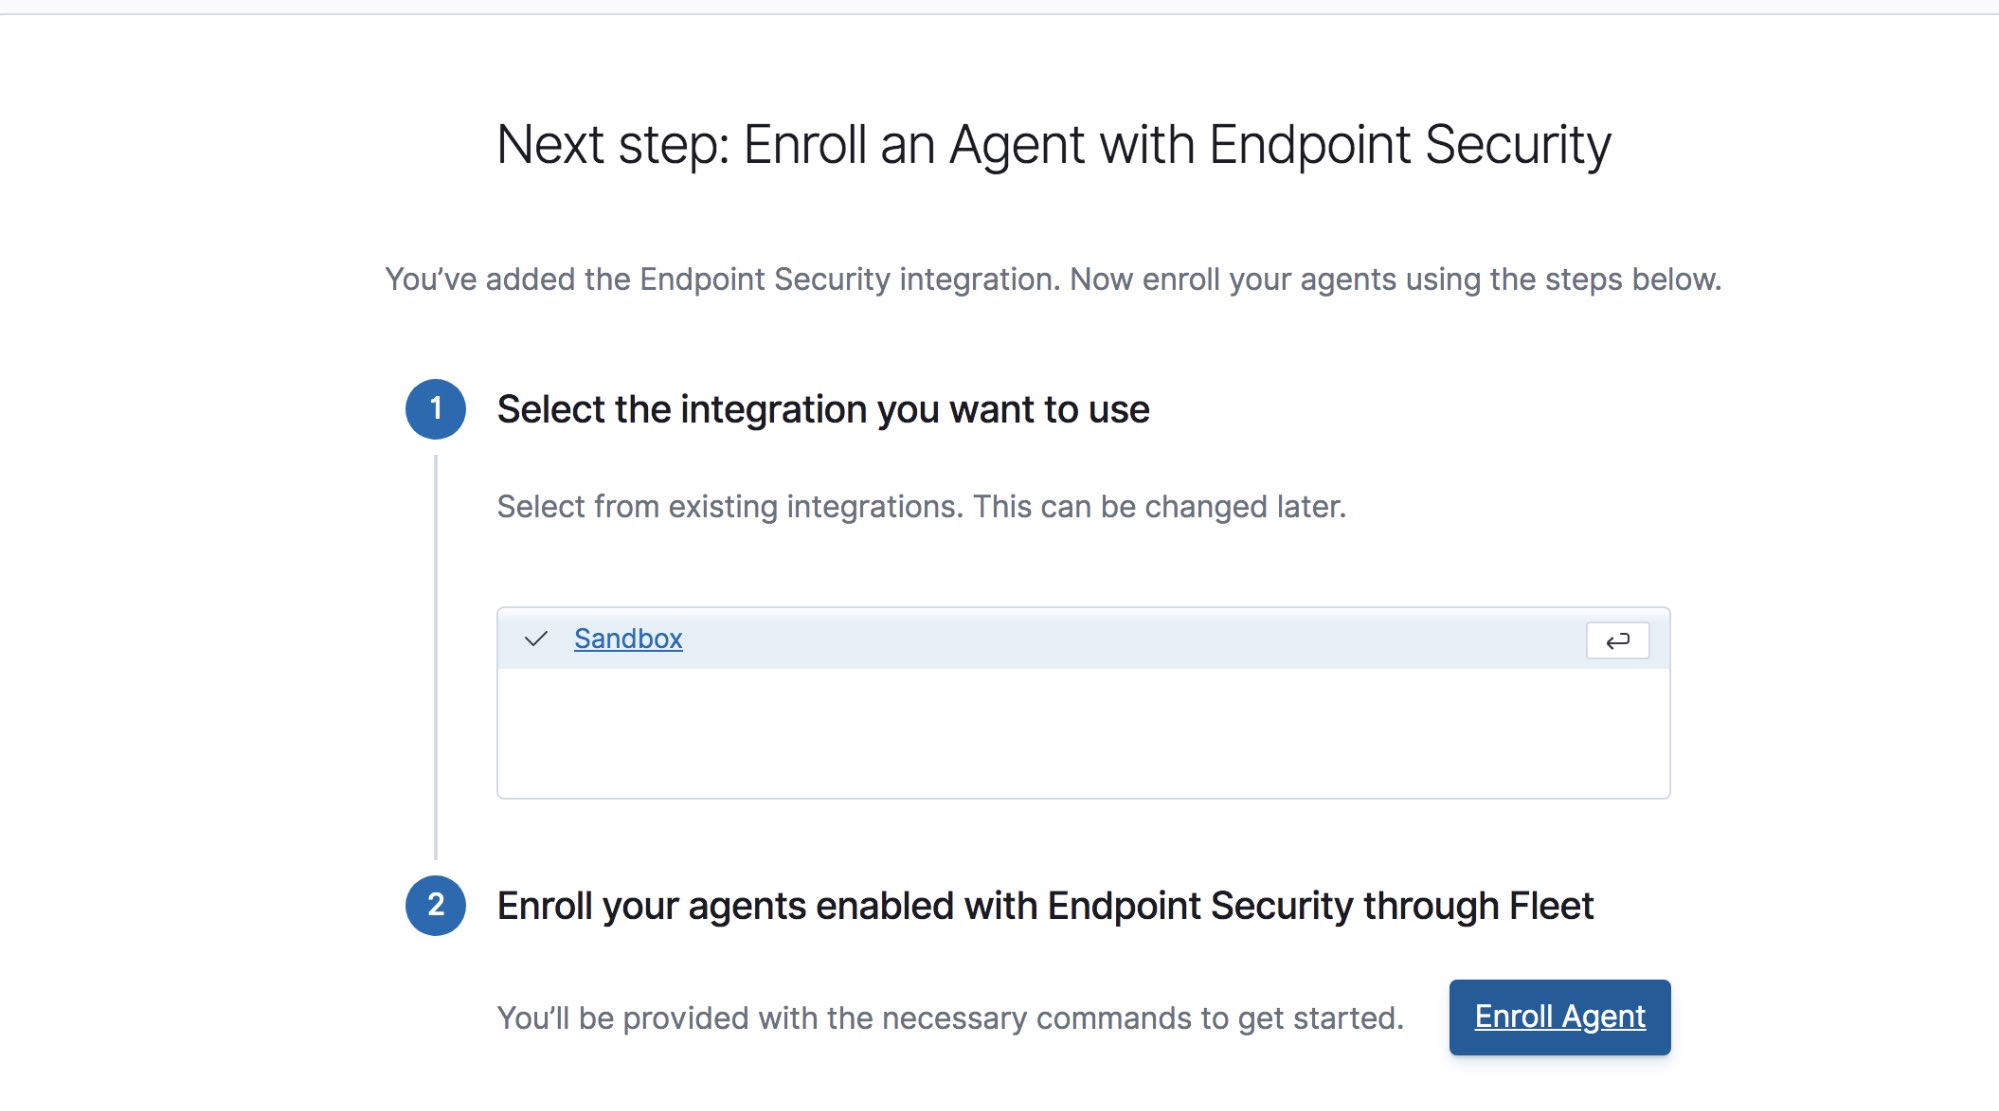
Select your integration and select Enroll Agent. In the screen that appears, confirm that you want to Enroll in Fleet. This will let you configure and control your agents entirely through Kibana.
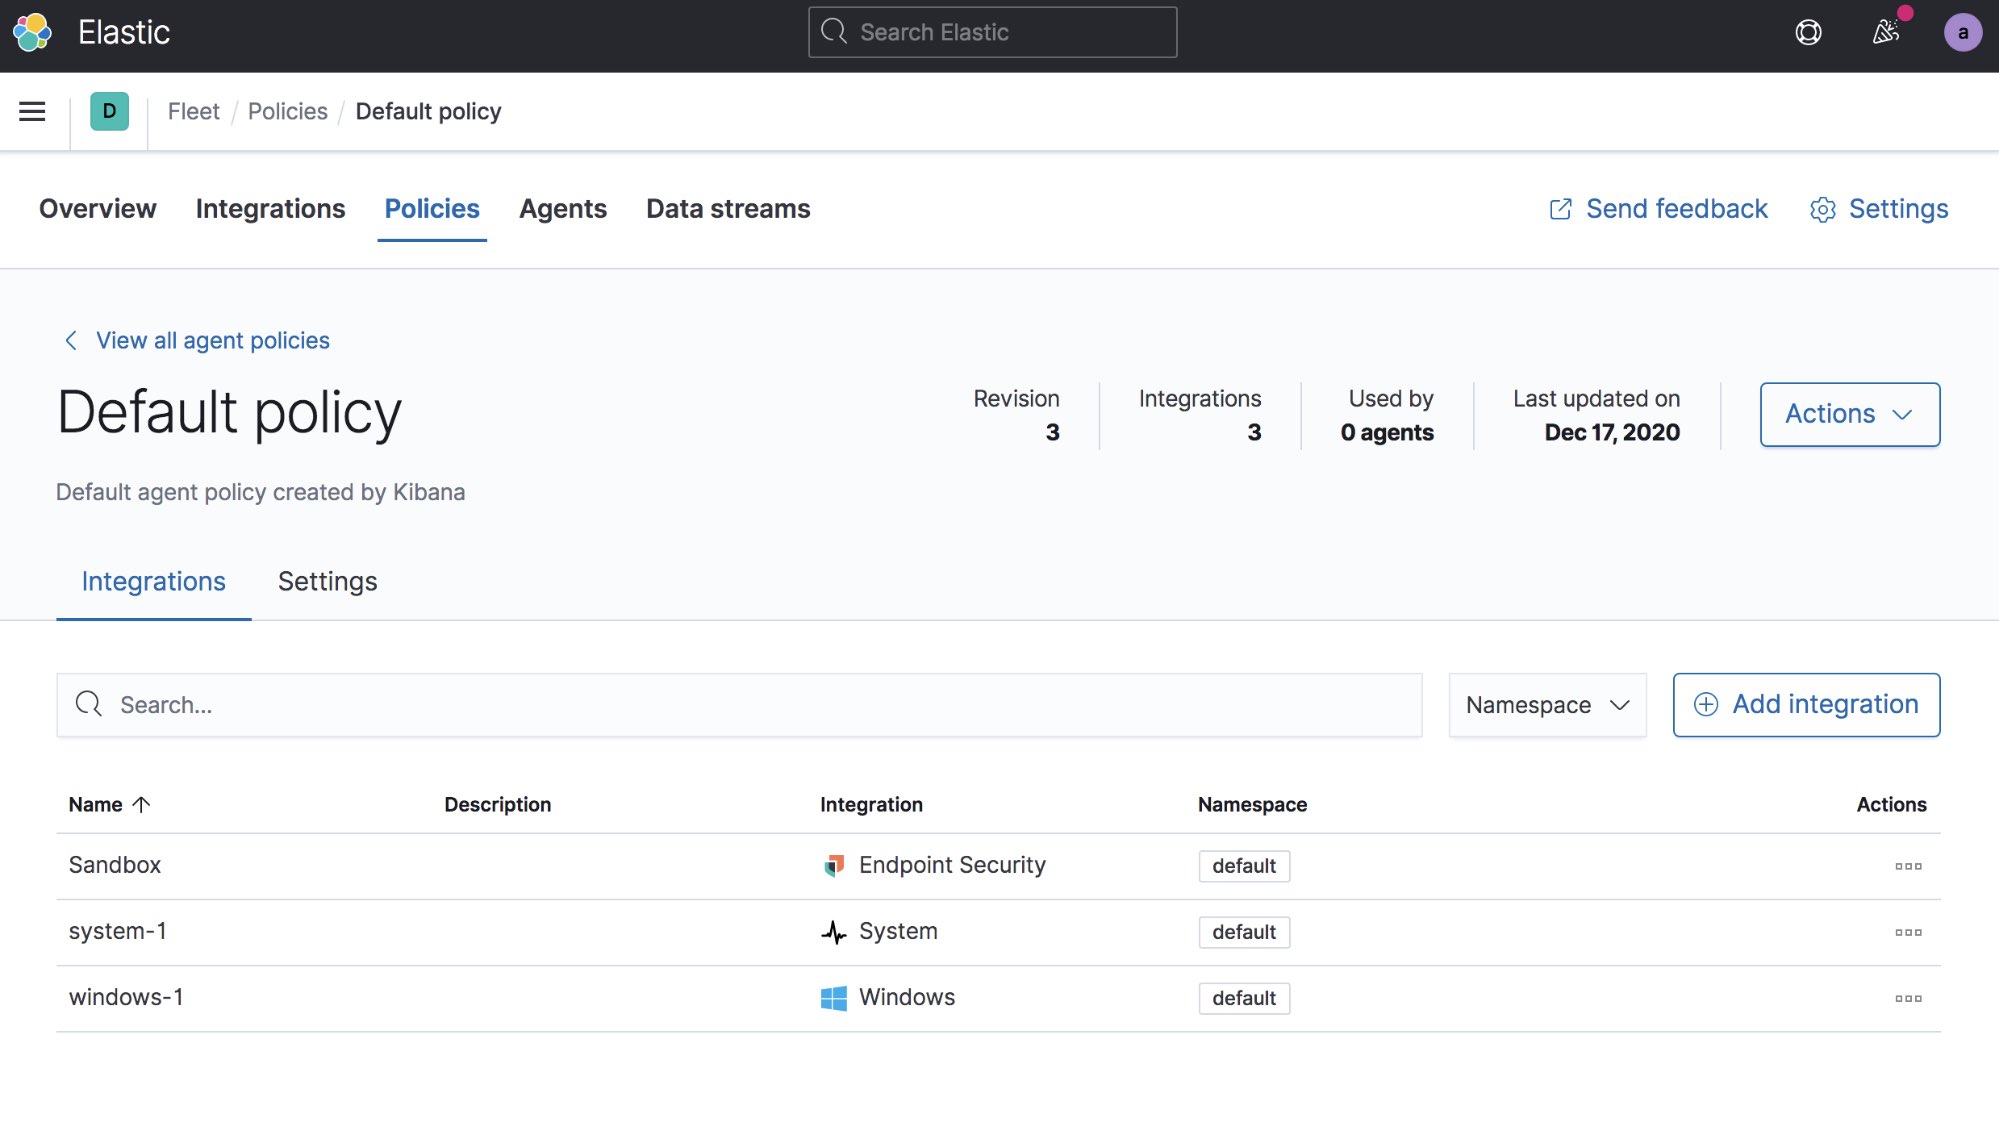
If you want to also collect Windows event logs, select Add integration, select Windows from the premade integrations, use the default settings, then select Save Integration to collect the Windows Security events, Sysmon events, PowerShell Scriptblock logging, and any Windows event logs that are configured to be forwarded.
At this time you should have a default policy configured that will deploy endpoint security, the System module, and Windows event logs from Windows systems.
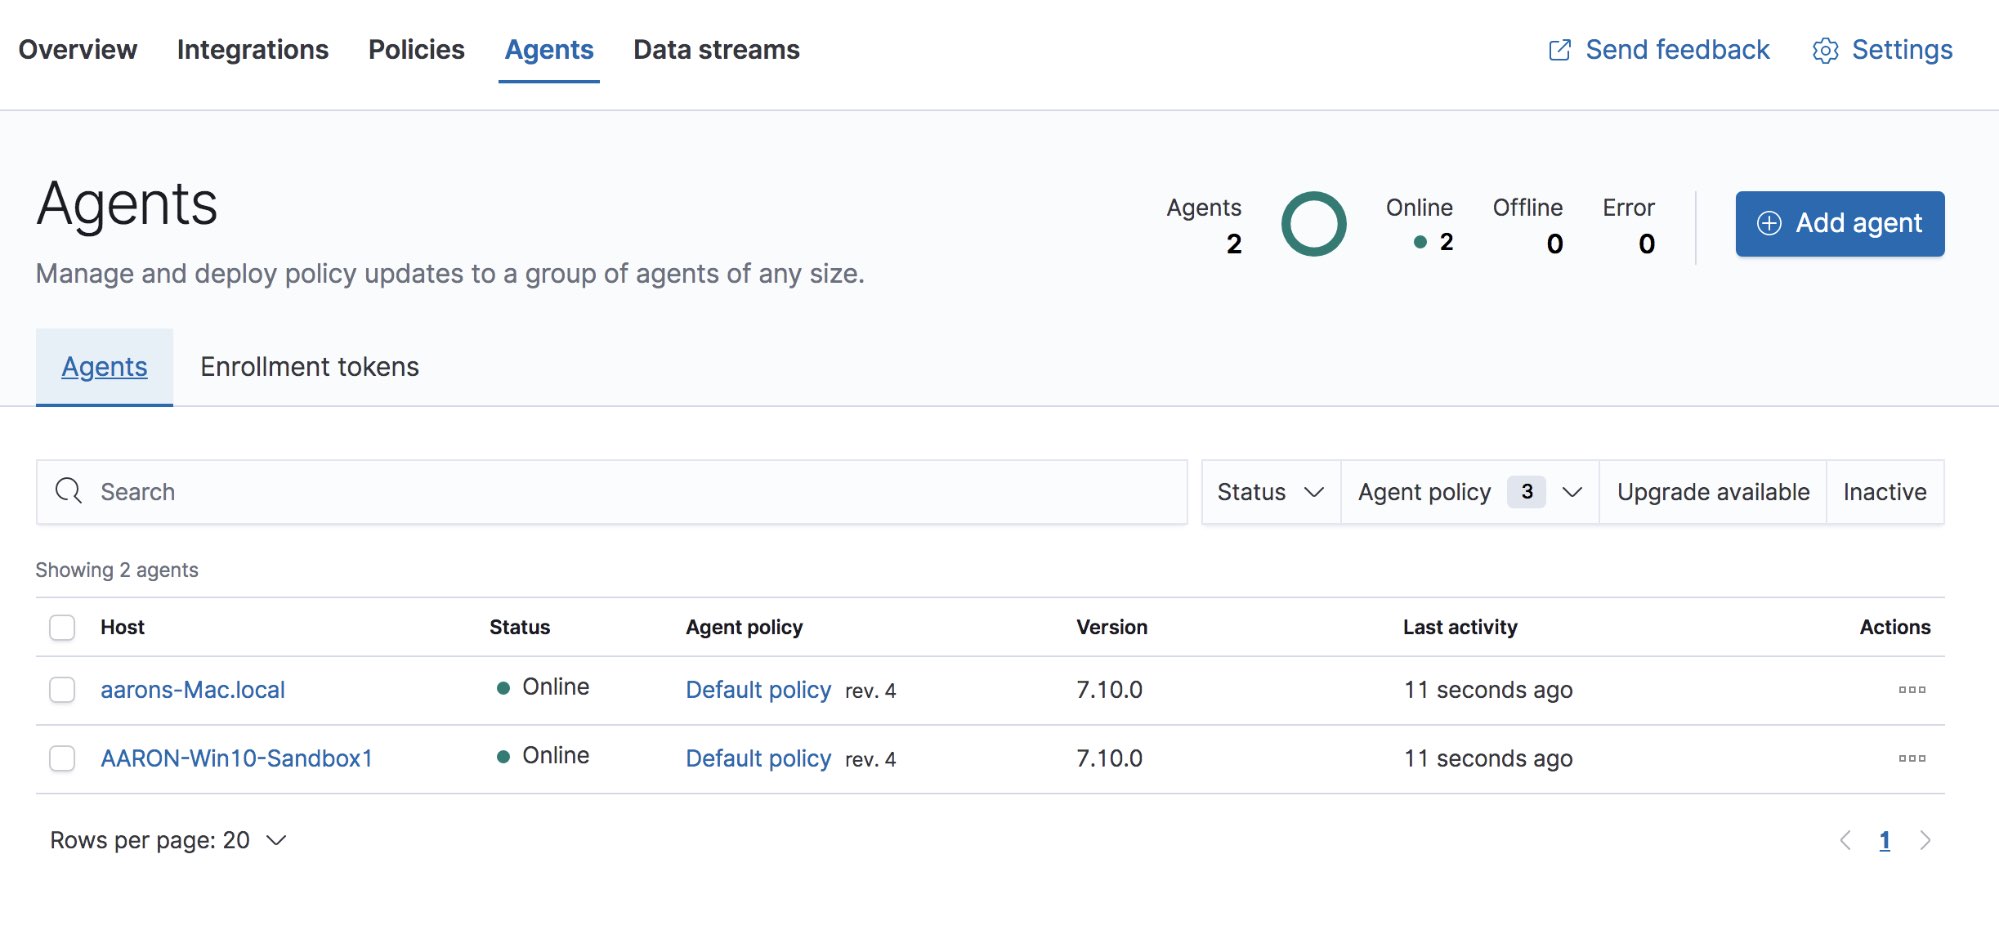
Now you are ready to deploy your agents to your sandbox systems. Select the Agents tab. If this is your first agent then you will need to be an admin and then select the button to automatically create the Fleet user in Kibana. Then click Add Agent, which will direct you to the Elastic Agent download page and show you the commands you will need to run to install the agent on your VMs. After you download and install the agent you should see it appear automatically in the Agents list.
Within Elastic Security, you will need to configure the Integration Policy of the Elastic Endpoint agents. The Agent Policy sets the policy for the Elastic Agent while the Integration Policy sets the policy for the endpoint security integration deployed by the agent. The endpoint security integration policy can be set in the Administration tab in Elastic Security. Select the Integration Policy next to one of your agents to open the view.
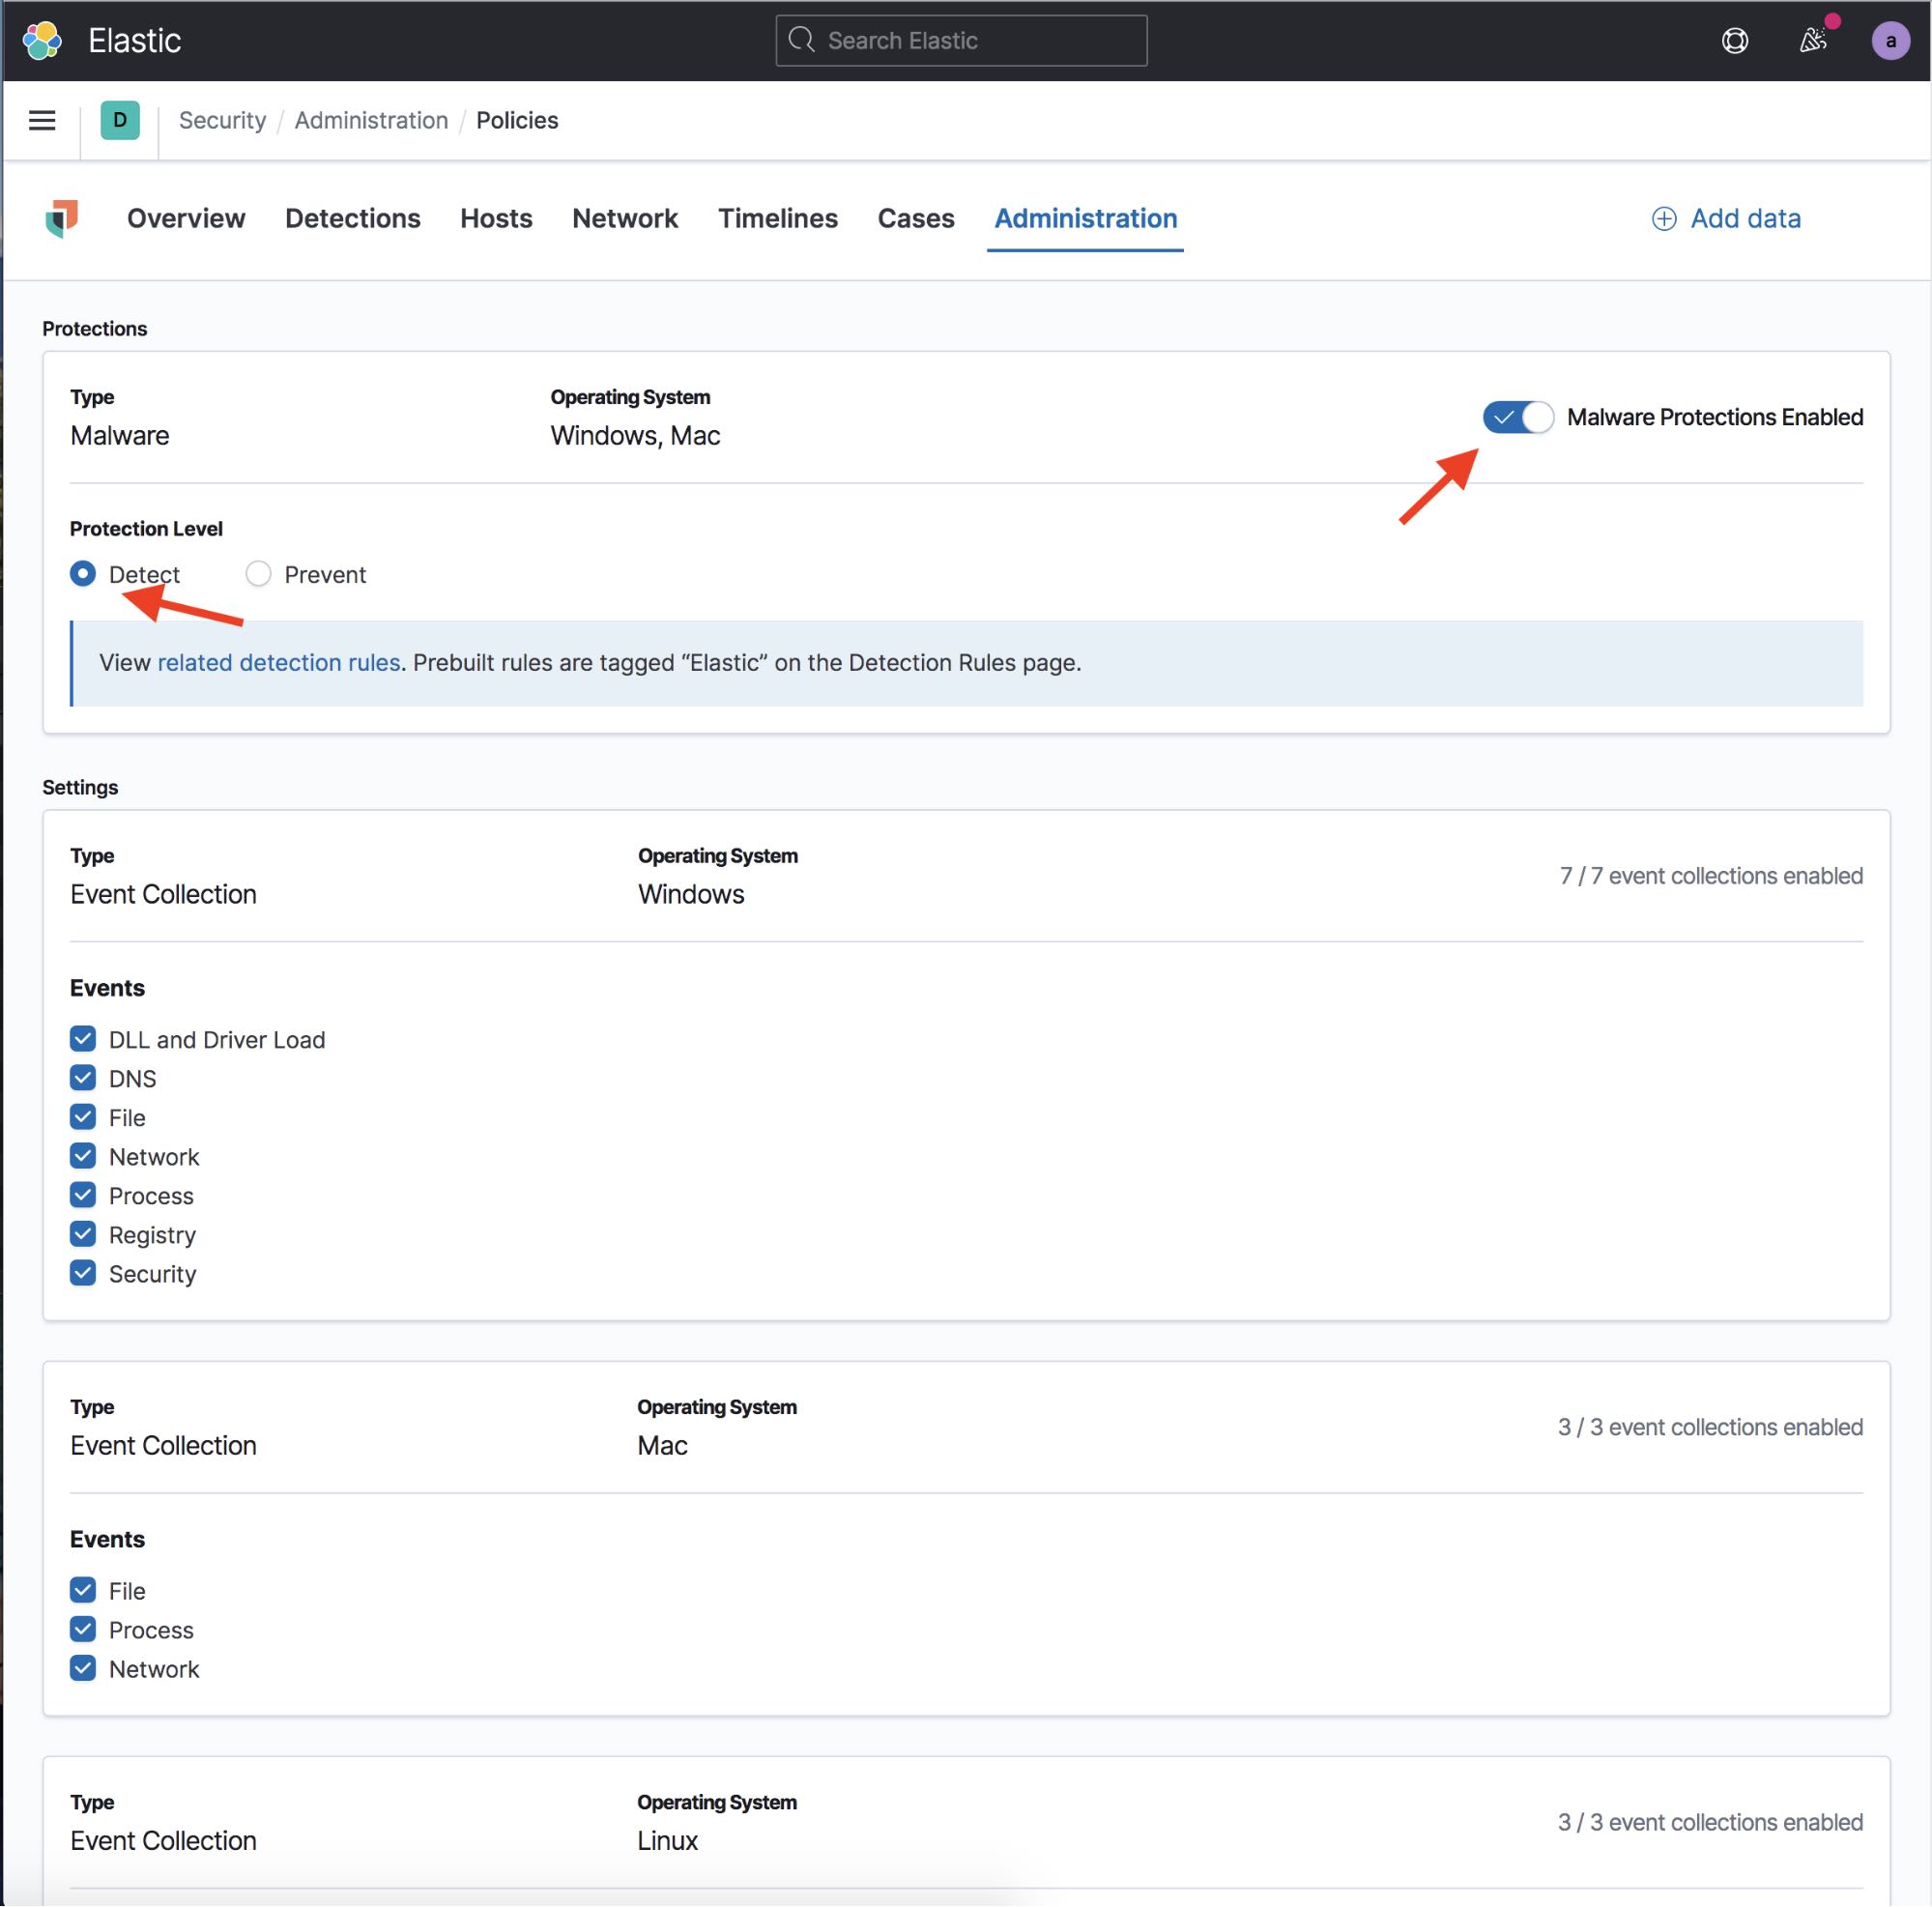
This will bring up the Integrations Settings view. Within this view make sure that Malware Protections Enabled is toggled on, and that the Protection Level is set to Detect, not Prevent. If you have malware protections on but place them into detect mode, you will see the malware detection alerts but Elastic Security will not take any actions to stop the malware.
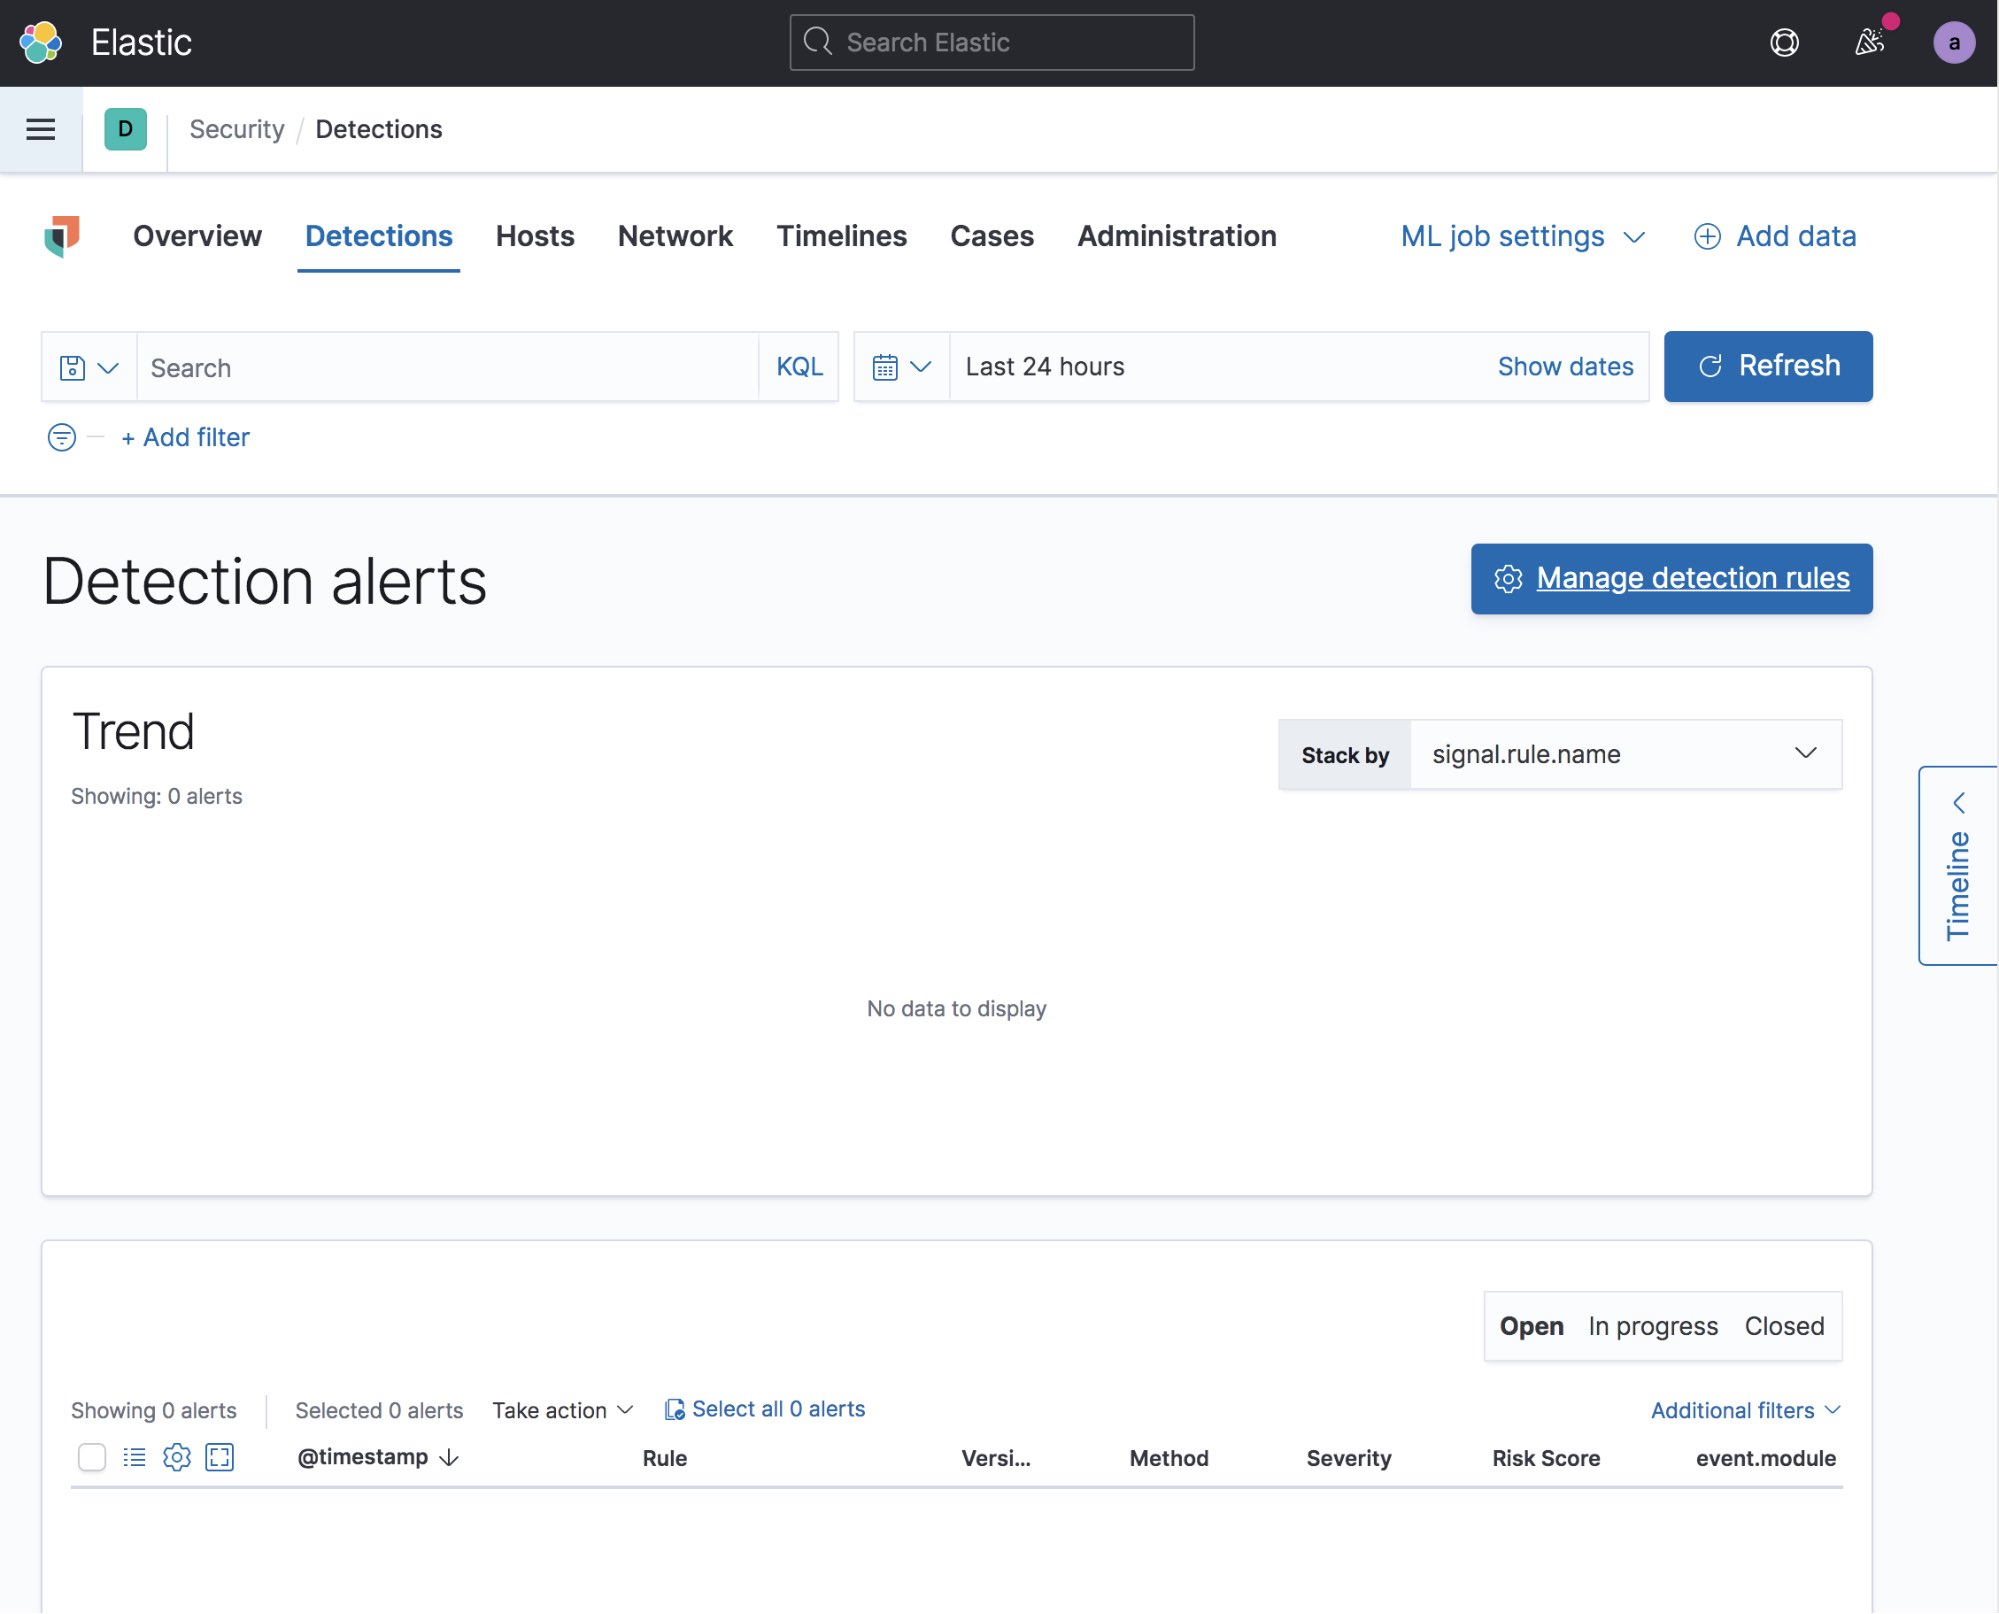
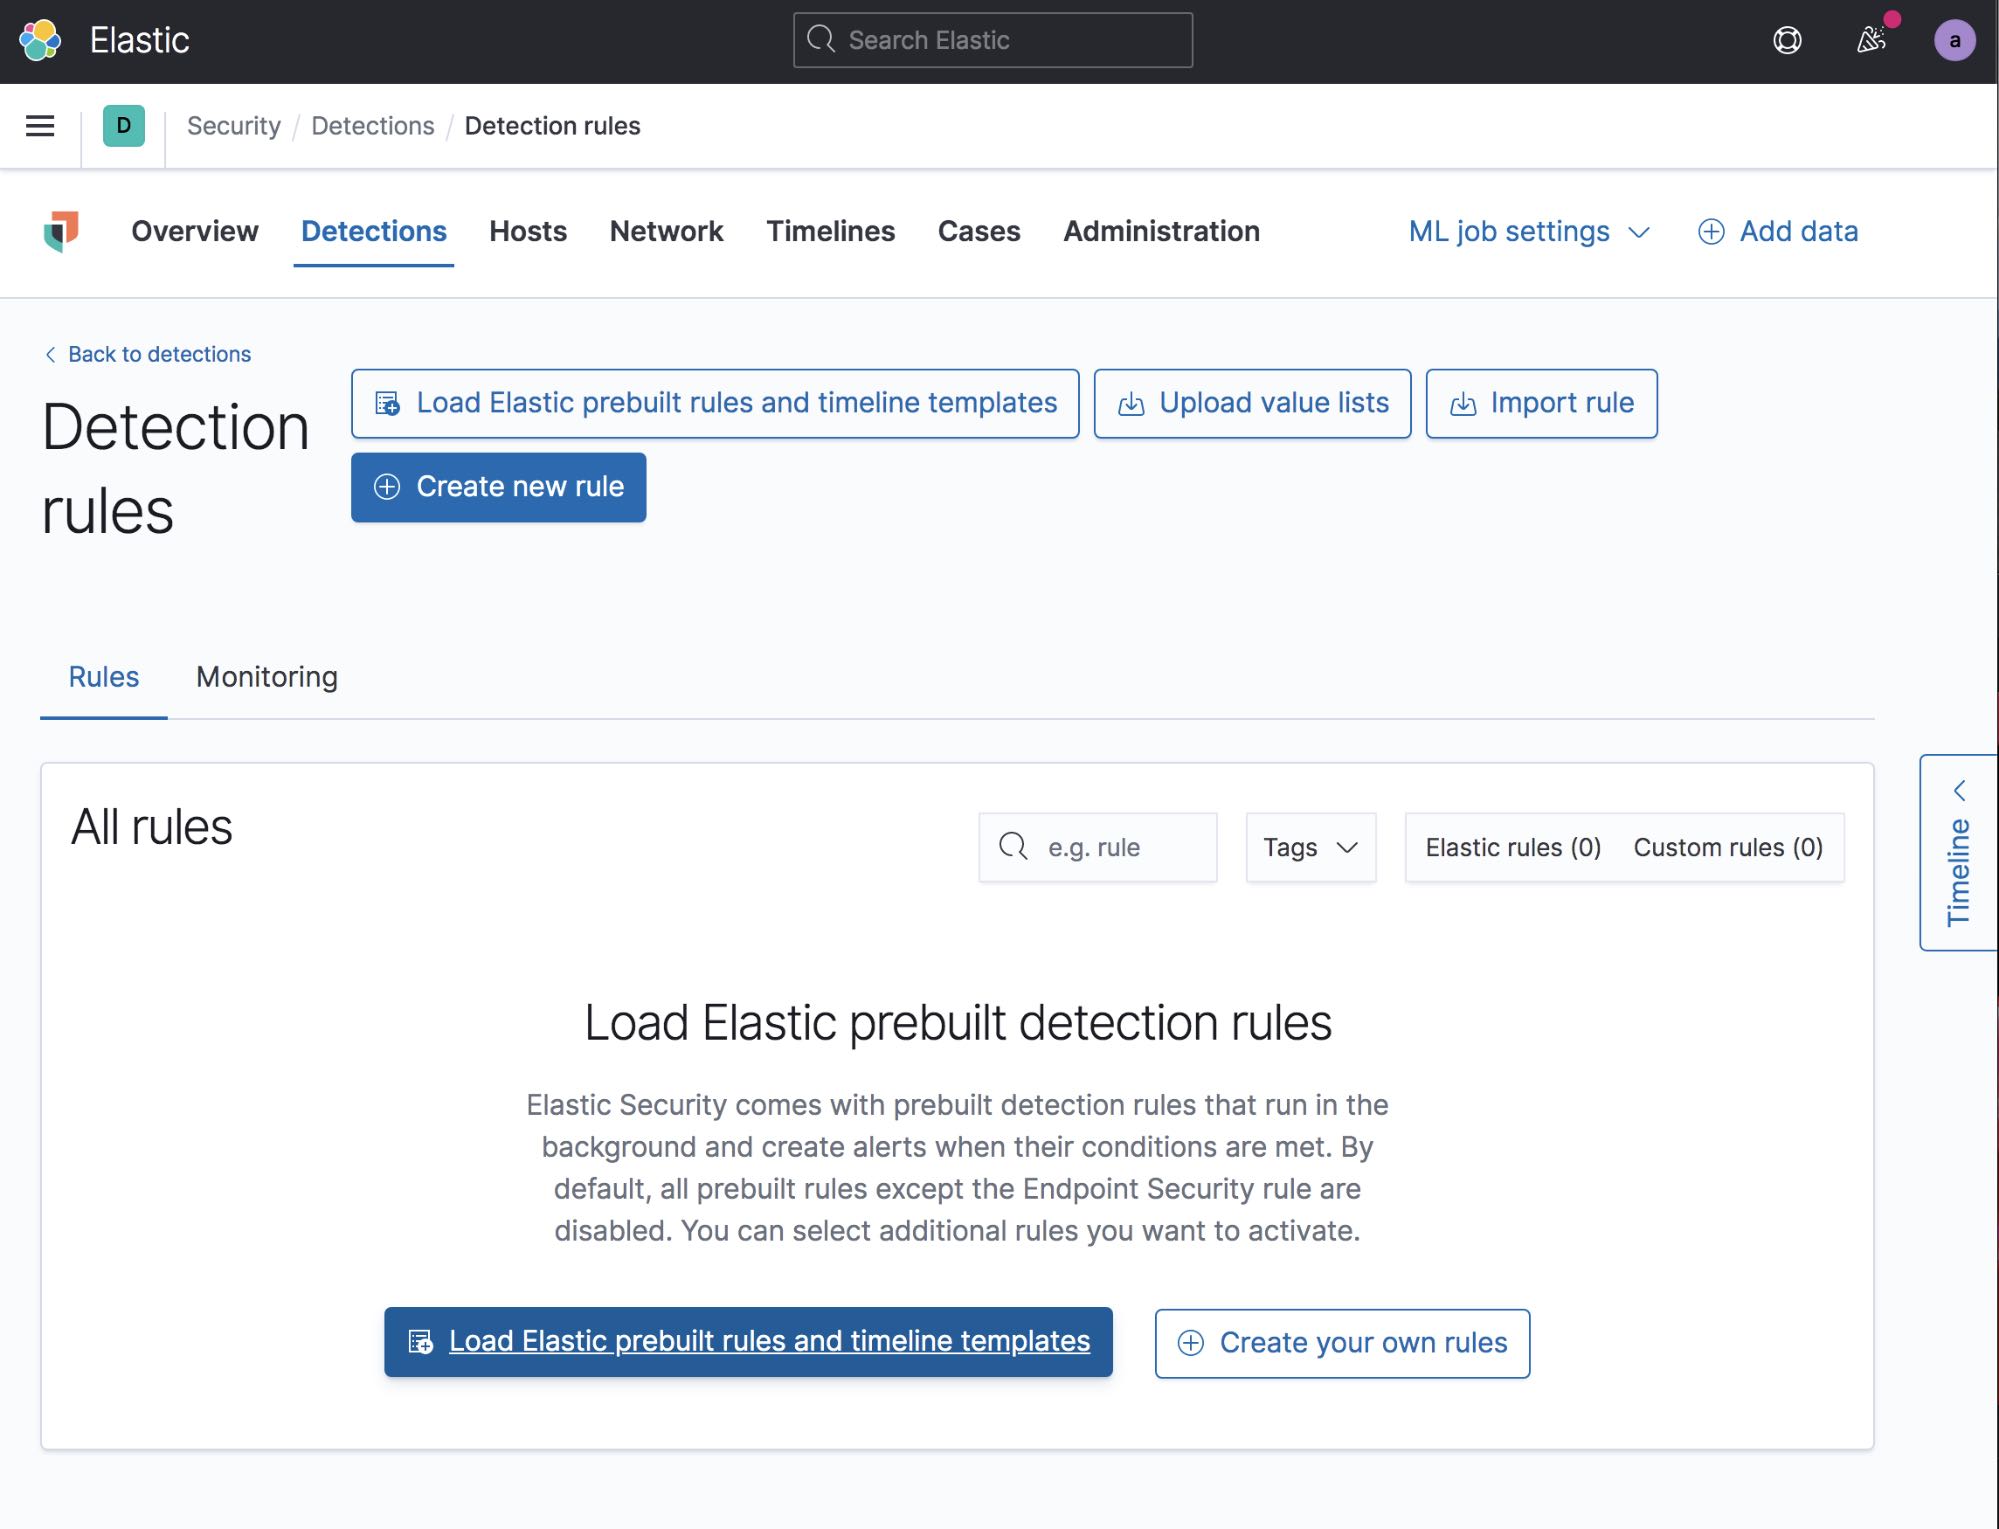
The next step is to take an extra minute to set up your detection engine in Elastic Security and install all of the included prebuilt Elastic detection rules. You don’t have to do this for your sandbox, but it is easy to do and will very often detect the malware’s actions — making triage easier. To do this, just select the Detections tab in Elastic Security and then select Manage detection rules. From there, click Load Elastic prebuilt rules and timeline templates. You will have to do this as an administrator the first time around.
After the rules have been loaded, you will need to enable any rules that you want turned on. You can go through the rules and select only the rules you want to enable, or you can just turn them all on if you want. Turning all of the rules on is the easiest way to go — it doesn’t hurt anything to have rules enabled, even if there isn’t any data for that particular rule.
Collect network traffic (optional)
In addition to capturing the malware’s activity on a host, you may also want to collect its network activity from an external host. Some advantages to doing this are the ability to see the data inside the network events (not simply that they happened). There are several ways to do this, but I prefer to use a separate VM that sniffs the network traffic in the same virtual network.
To do this, you can either use Packetbeat, which will give you a good summary of data without flooding your stack with events, or TShark and Filebeat to stream a full packet capture to Elasticsearch. Within your Packetbeat config, you will want to configure it to collect request and response for most protocols, and to collect the raw certificates for all TLS traffic. It is very common for malware to reuse TLS certificates and they can be a treasure trove of malicious domain names.
Your malware analysis sandbox is now complete and ready for testing. Remember to snapshot your VMs in a clean state before you start executing malware.
Analyzing malware
| Note: Be careful to never open live malware onto your host system. We recommend keeping the suspected malware in a password-protected zip file to prevent accidental opening. If possible, download the malware directly to the sandbox system. |
For this test, I detonated a piece of the Emotet Malware family. This particular piece of malware is a malicious Office document that requires the user to enable macros to gain execution. If you didn’t disable malware protections in the Endpoint Policy, the malware will be immediately quarantined by Elastic Security, making your test very short.
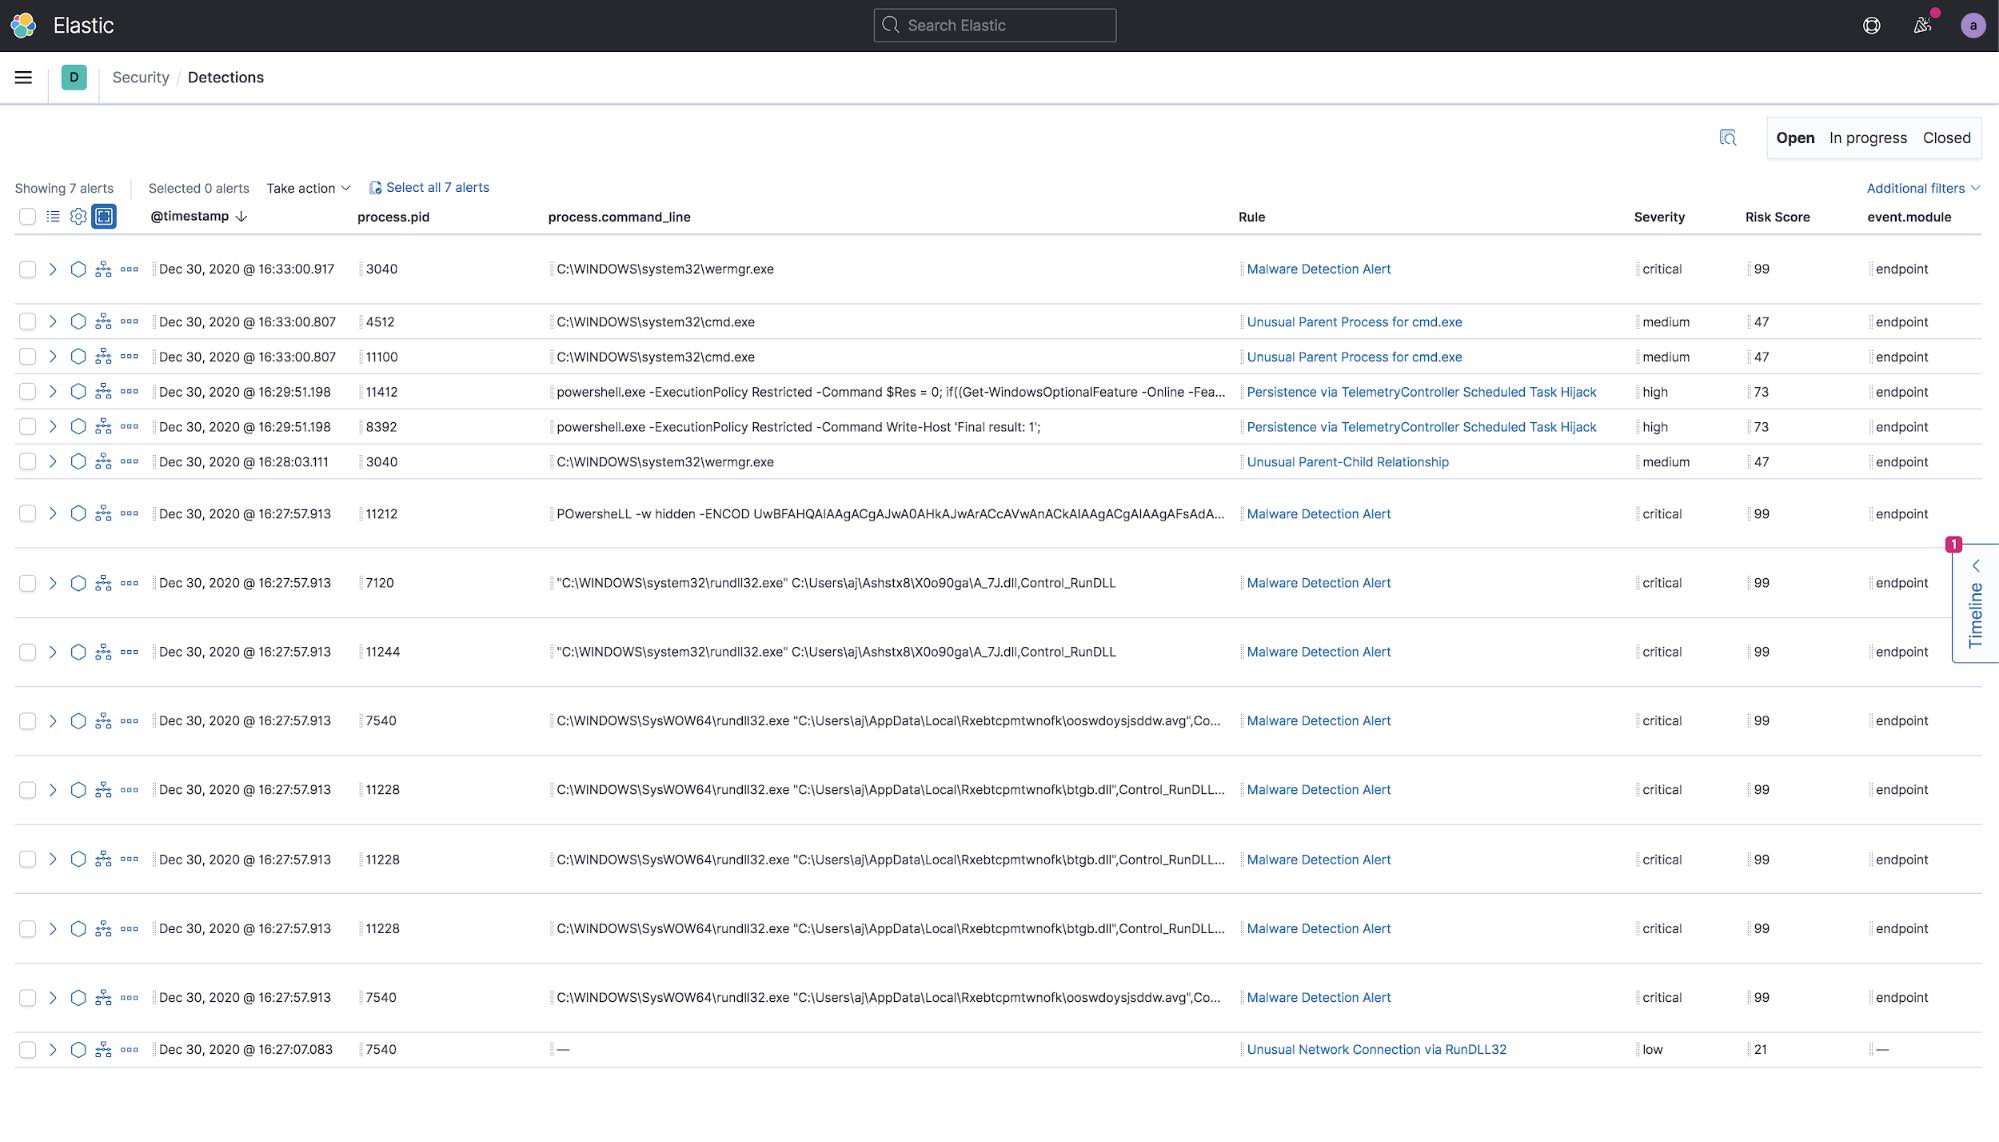
After detonating the Emotet Malware in your VM, you can go back to the Elastic Security in Kibana and watch the fireworks. In the Detections tab you will probably see a bunch of new alerts from the malware activity on the host. You can see from the screenshot below that there were multiple initial malware detection alerts. If endpoint security was set to prevent instead of detect, the malware would have been stopped and quarantined at this point and you wouldn’t have all of the extra data.
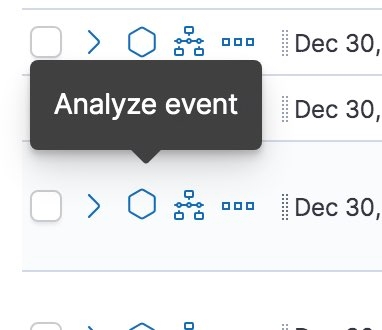
Next to one of the alerts you can select the Analyze Event icon to open up the Analyzer view to visualize what happened in a tree graph.
In this example I decided to select the strange-looking PowerShell command to see how it fits into the execution chain. The Analyzer view is an interactive view of the execution of the software in a hierarchy view based on the parent process. The lines connecting the processes show the time difference between the start time of the parent process and the child process. If you zoom in on a node, you can see the number of events associated with that process.
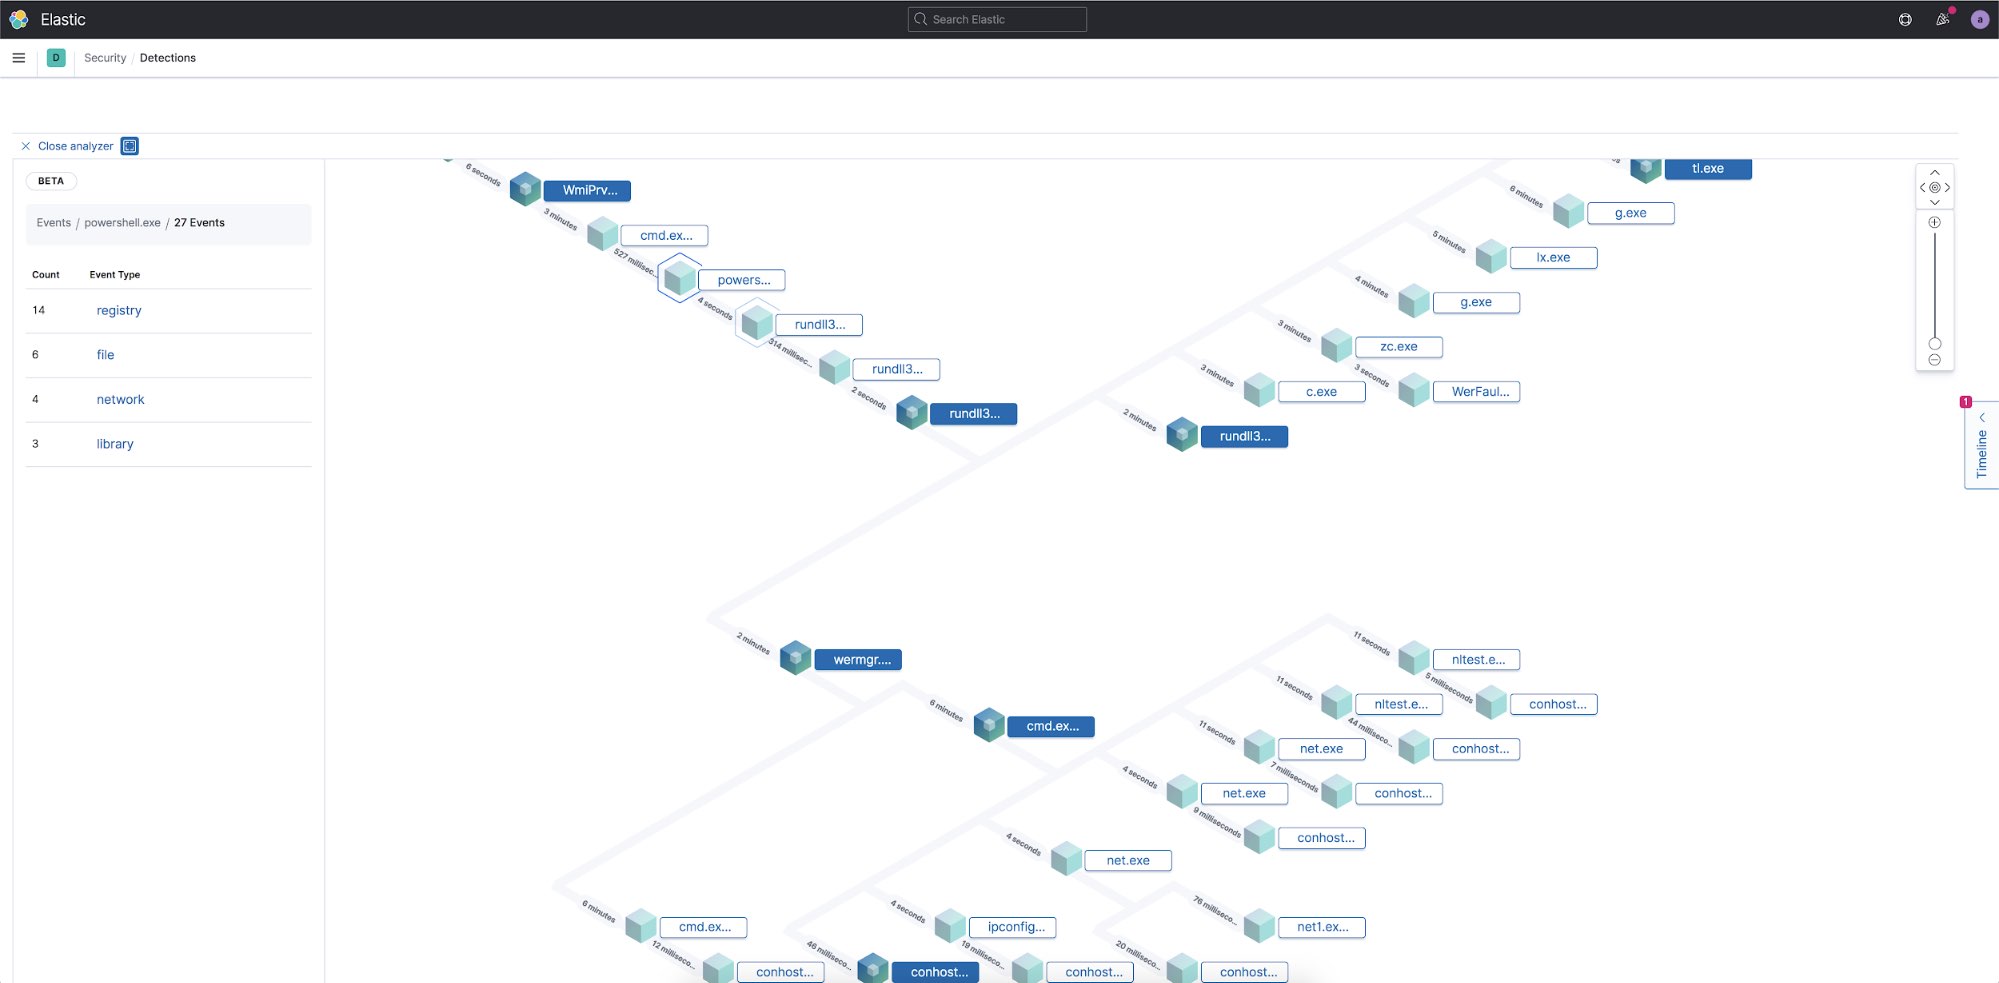
To find out what actions the PowerShell process took, I can select the node and see that there are 27 separate events associated with this one process. I can then select each of the categories to see what files were created, network connections made, registry entries that were modified, and what libraries were loaded into memory by this process.
Some malware will only load certain capabilities after a reboot so it is a good idea to reboot the VM and look for more alerts to see if there are any additional detections.
Since all of this information is already in Elastic, I can also view and visualize these events in any of the other Kibana apps, such as within Dashboard or Discover. If you are using Packetbeat to collect network traffic, Kibana comes with many built-in dashboards and visualizations for various network protocols.
Conclusion
In this post, we covered how to quickly set up your own malware analysis sandbox using Elastic. Within minutes, you can build a sandbox that lets you safely open and observe files while streaming all of the events to your Elastic Stack for safe offline analysis. Within the Elastic InfoSec team we use the information from these files to build new detection rules and hunt for any previously undiscovered attacks to the network.
Ready to get started? Start your free 14-day trial (no credit card required). Or download our products, free, for your on-prem deployment.