Myth busted: Kibana isn't just for developers — it's for everyone
Myth: You have to be a developer to understand and use Kibana.
Reality: False! Kibana is for everyone.
As the creators of the Elastic Stack, we get a lot of feedback when chatting with our users from all corners of the world during ElasticON events, in GitHub and forums, and while helping folks resolve their support cases. One of the things we've heard in the past is that Kibana is difficult to use. And we've listened to our community!
The evolution of Kibana
Way back in 2010, Elasticsearch was released, and this new search engine took the developer world by storm. And in those early days, Kibana took its first determined steps as the user interface of Elasticsearch: instead of relying on the familiar blink of a command line to search their Elasticsearch data, developers started to use Kibana as a more convenient way to display data with charts and other visualizations.
Kibana has changed a lot in the past decade! Today, building visualizations in Kibana is so simple and intuitive, millions of people — from business analysts to executives to data scientists — use it to interact with data in real time. As the window into the Elastic Stack, Kibana gives you the freedom to choose how you shape and view your data. And true to our DNA, it’s free and open.
Here are a few ways you can see this for yourself — no prior Kibana experience required.
Easily create visualizations with Kibana Lens
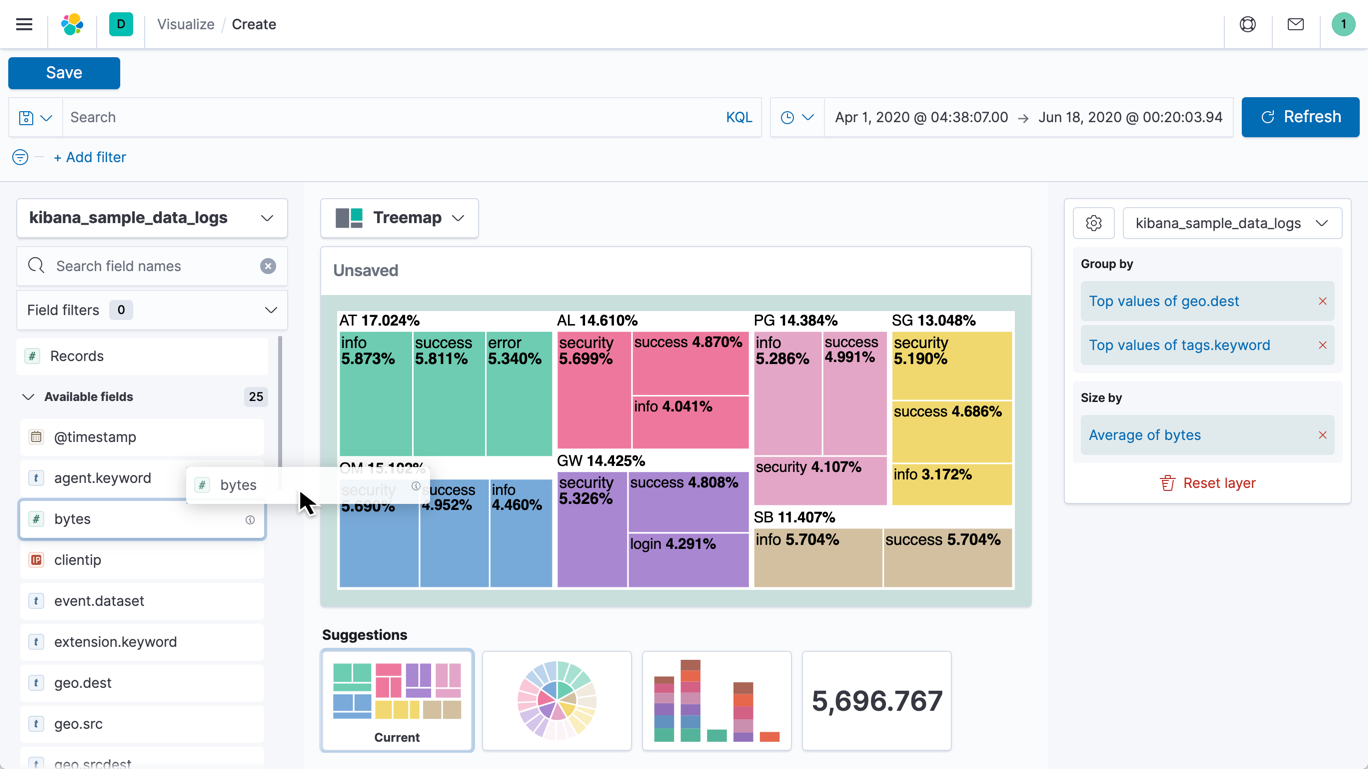
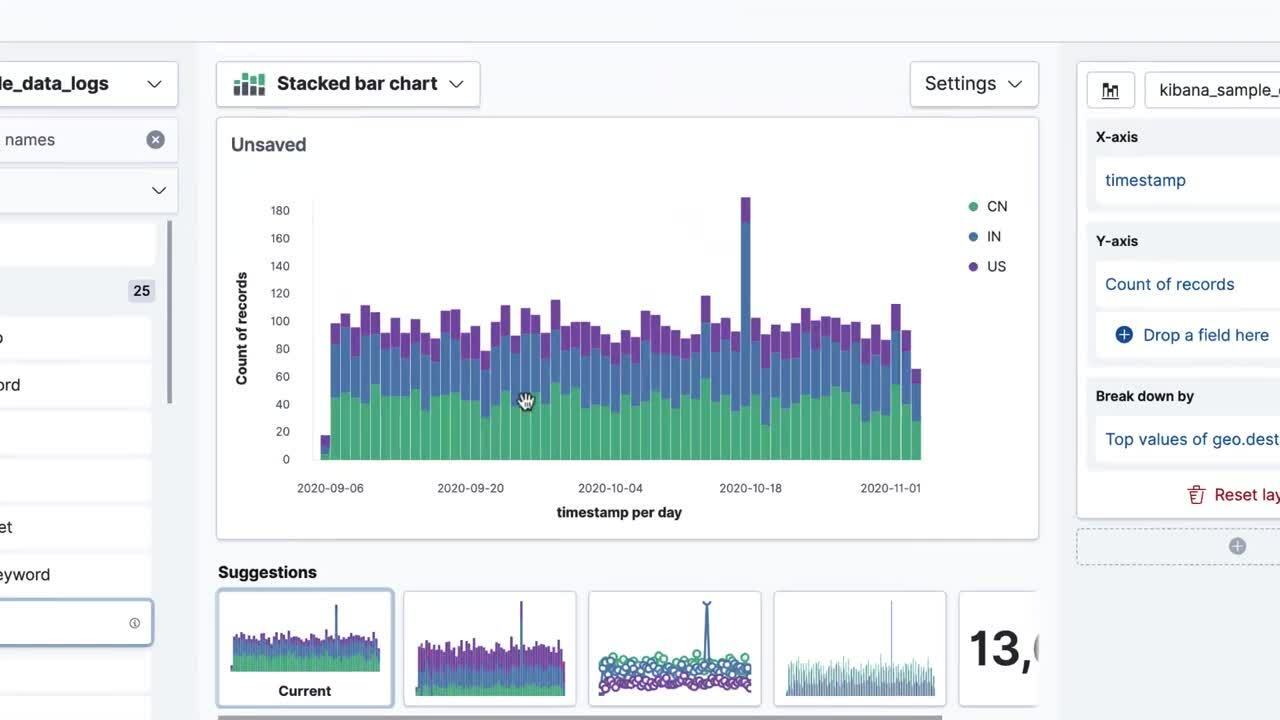
Kibana Lens is a perfect way for brand new Kibana users to dive straight into visually analyzing data in Elasticsearch. Lens visualizations give you complete control over how you slice and dice your data. Plus, it’s designed to support the twists and turns of real-world data analysis operations, meaning you can be halfway through an ad hoc exercise and have a change of heart chart.
With Lens, you can:
Quickly inspect data fields
With Lens, there’s no need to select ahead of time which data sources (indices) or fields to use in your visualization. Lens displays Elasticsearch data fields upfront, allowing you to see a breakdown of a field’s values with a click and choose the data that answers your questions.
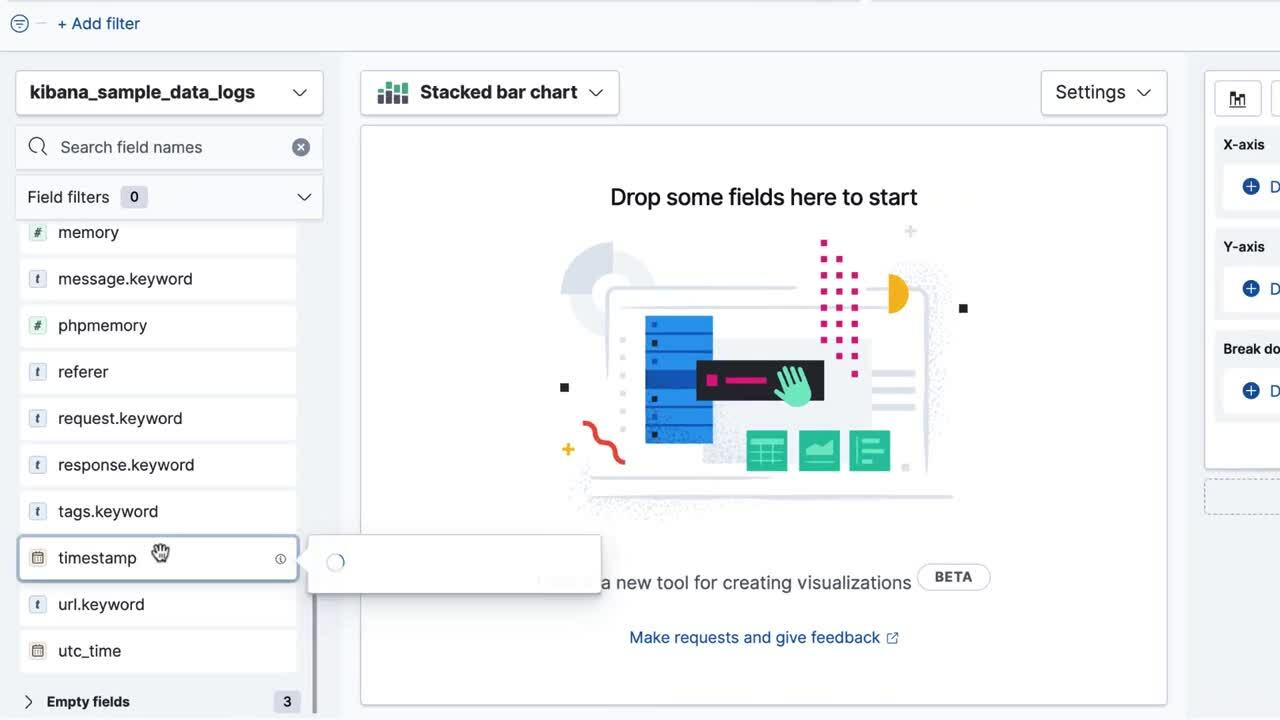
Just drag, drop, and see
Once you know what data you want to look at, simply drag and drop a field, and Lens will automatically visualize that data. Lens also lets you bring in additional data fields and indices that can help sharpen your analysis through comparison.

Save time with smart suggestions
With every drag and click, Lens suggests alternative ways to visualize your data. Lens flattens the curve required to learn more about the data sets you’re using: it combines other Kibana users’ common — and successful — usage patterns with relevance ranking to present visualization types optimal for your data.
To learn more about Kibana Lens, check out our documentation.
Showcase your data your way with Canvas
Ready to get a little more advanced to make your data stand out? If you’re itching to flex your creative muscle, Canvas is a data presentation tool built right into Kibana that lets you customize every pixel of your creation. Create dynamic dashboards featuring the logos, colors, and other design elements that define your brand so you can present your Elasticsearch data in a way that tells your story.
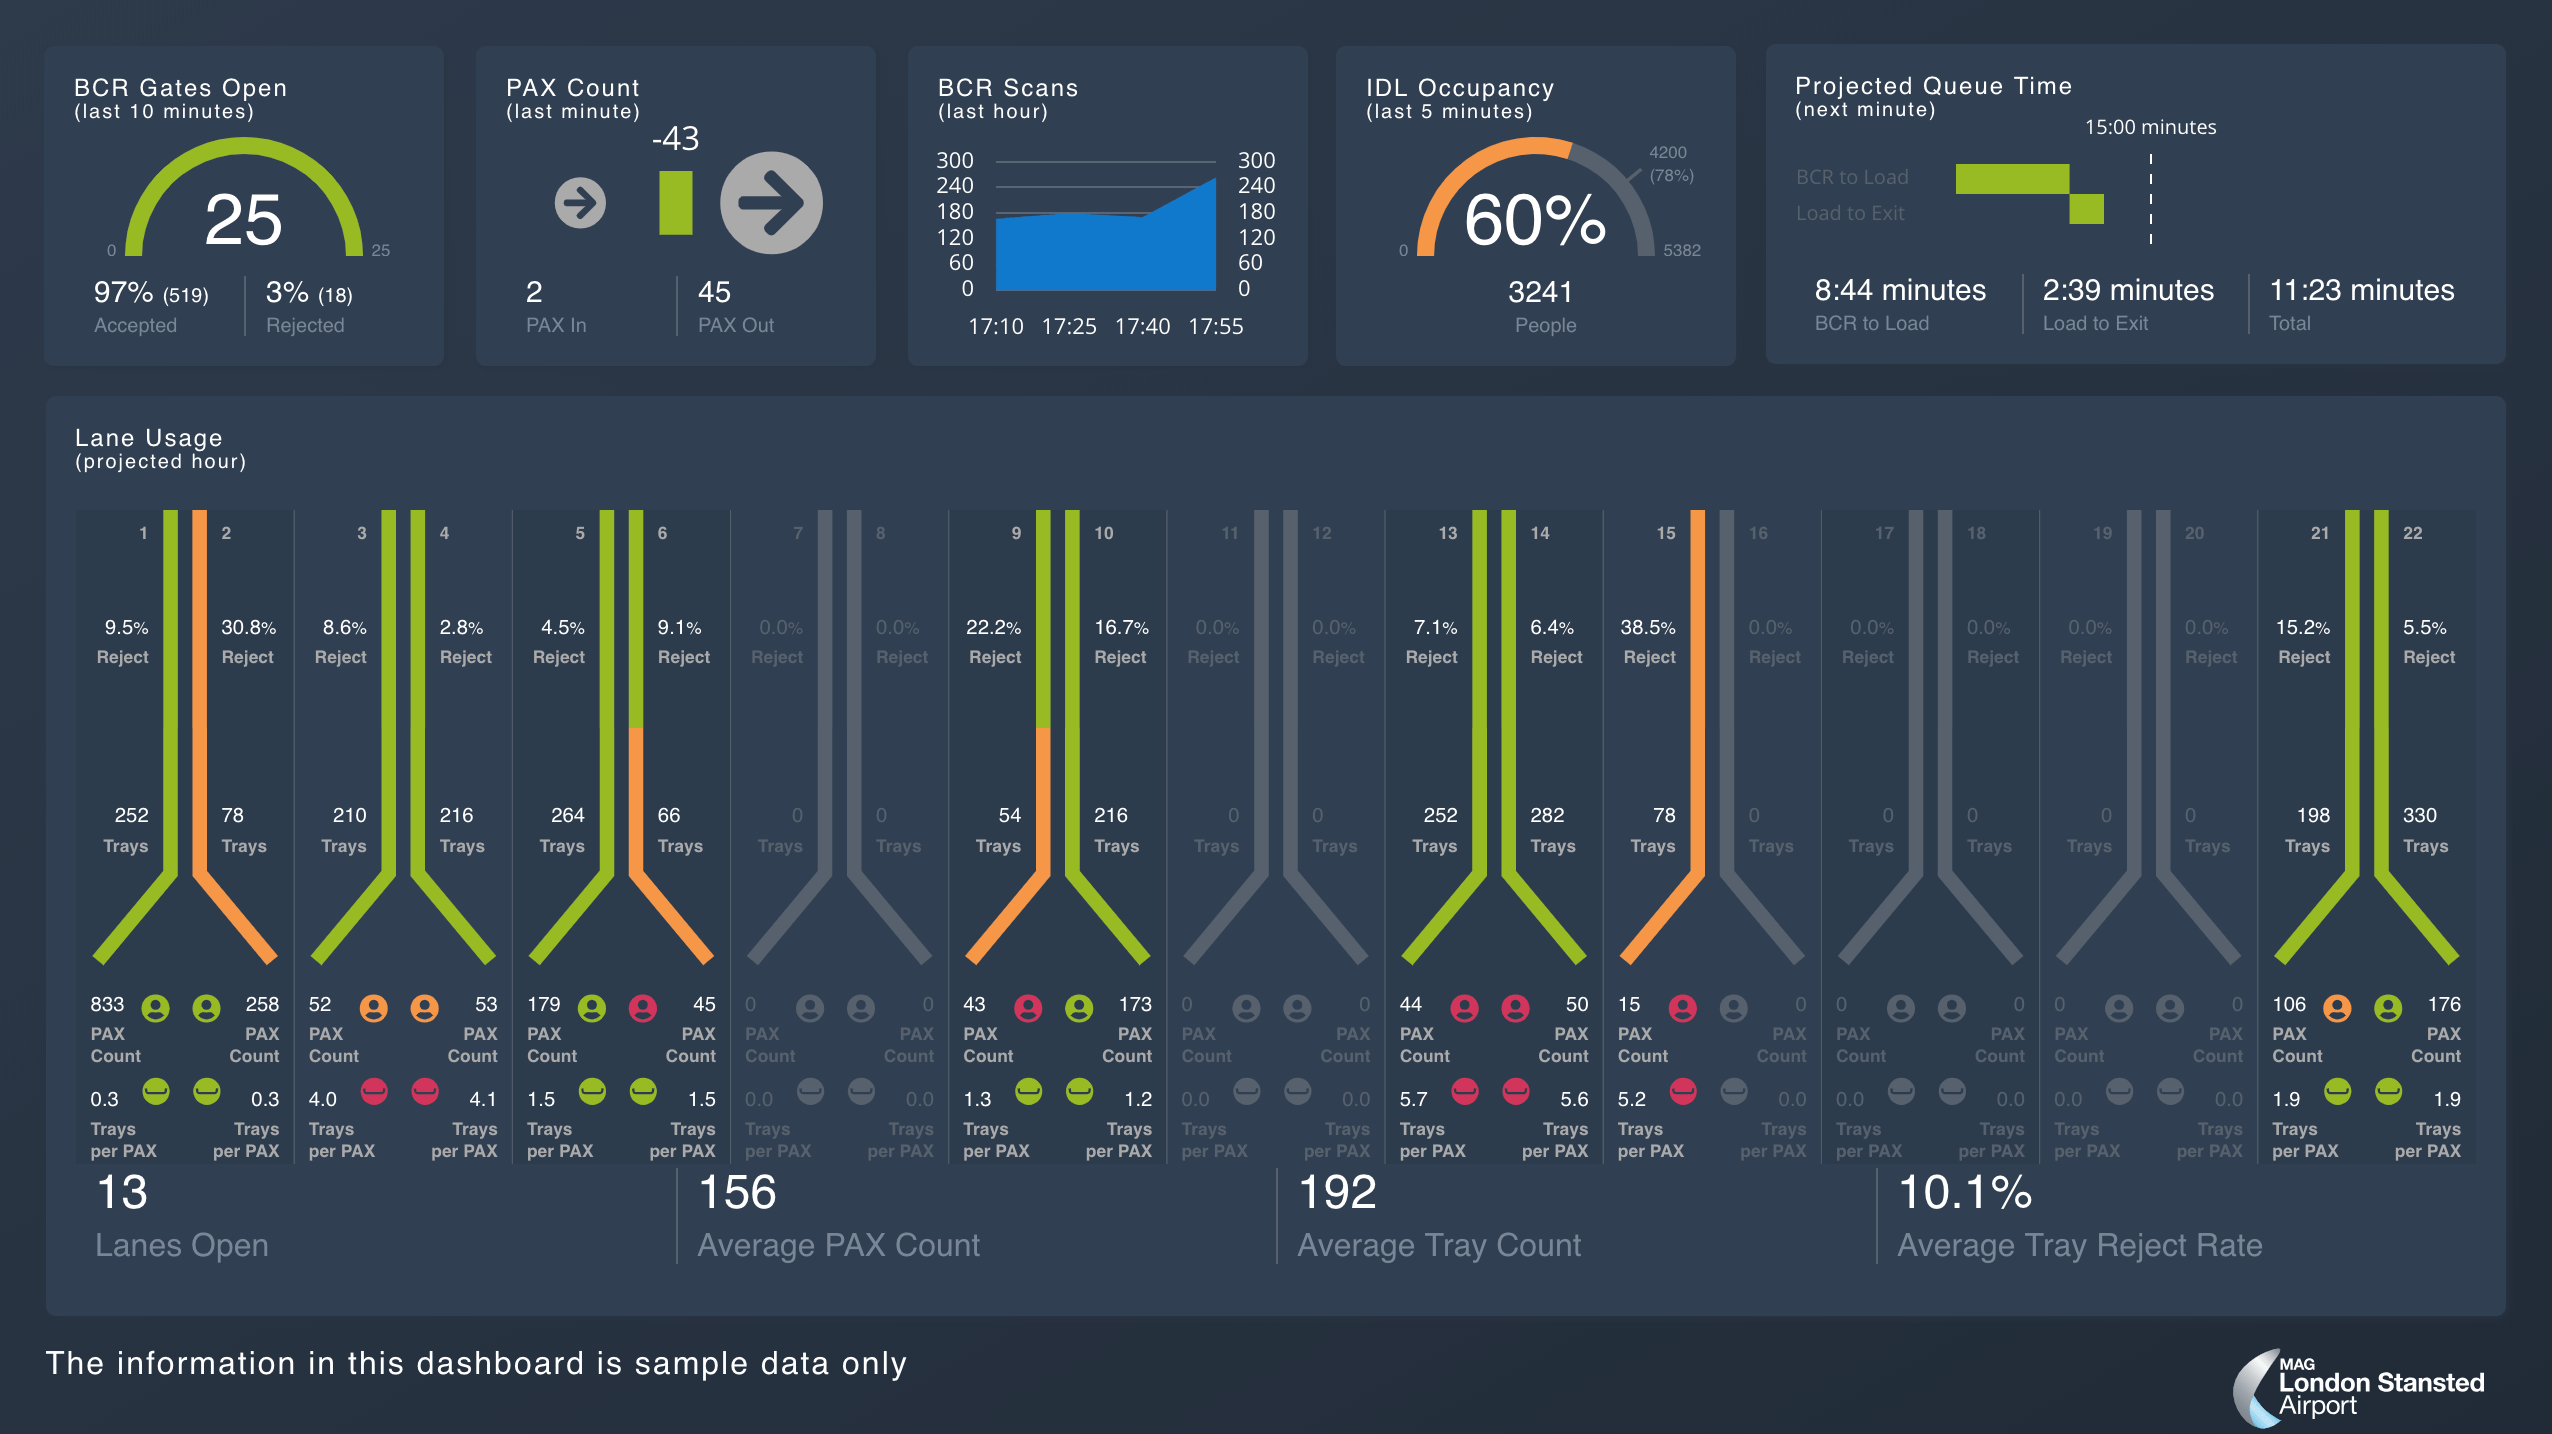
And while other dashboarding tools take snapshots of data that lag, charts in Canvas are as fresh as the data streaming into your Elasticsearch indices. That means no matter if you’re using Canvas in your mission-critical SOC or to update your executive team, your data is current and able to support real-time decision-making.
Best of all, Canvas is a free and open feature of Kibana — and it supports Elasticsearch SQL.
To learn more about Canvas, check out our getting started blog or intro to Canvas webinar.
Do more than visualize data
Kibana is also your front door to powerful tools, from endpoint protection to application performance monitoring to adding search to your application.
Want to see your network traffic mapped globally? Interested in getting a picture of your log streams? Kibana can show you what you need with just a few clicks.
Go make something
With Kibana, you can choose your own adventure: Start with the classics such as line graphs, pie charts, and sunbursts. Use Elastic Maps to dig into location data, or harness our curated time series UIs to perform advanced time series analyses. Or detect anomalies lurking in your Elasticsearch data with unsupervised machine learning. And did we mention there’s even more?
Experience Kibana for yourself today. Watch our getting started with Kibana webinar, or sign up for a free 14-day trial. We’re excited to see what you make.