Azure Cloud Monitoring with the Elastic Stack
UPDATE: This article refers to our old getting started experience for Elastic on Microsoft Azure. You can now take advantage of a more streamlined way to get started with Elastic on Microsoft Azure. Check out our latest blog to learn more.
“We’re moving to the cloud!” is now a commonly heard statement that was greeted with skepticism just a couple years ago. The adoption of the cloud has been growing at an astronomical pace. Although this growth is exciting, possessing deep visibility into your cloud infrastructure and application health now naturally becomes an important pillar of operational excellence for many users and companies, especially for mission critical services. The Elastic Stack is already a popular platform choice for monitoring and metrics use cases, and we’ve now made it much easier to monitor your Microsoft Azure deployments.
The Azure Monitoring Module
We’re pleased to introduce the Azure monitoring module, now available in Logstash 6.4. The module unlocks instant operational insights into your Azure user activity, infrastructure changes, and Azure SQL Database health across multiple subscriptions. It offers a suite of Kibana dashboards that enable you to detect issues earlier and investigate faster, right out of the box. Significantly expand the overall observability of your Azure Cloud environments by identifying compromised or malicious users, problematic resource groups, or SQL DBs running at unusually high workloads.
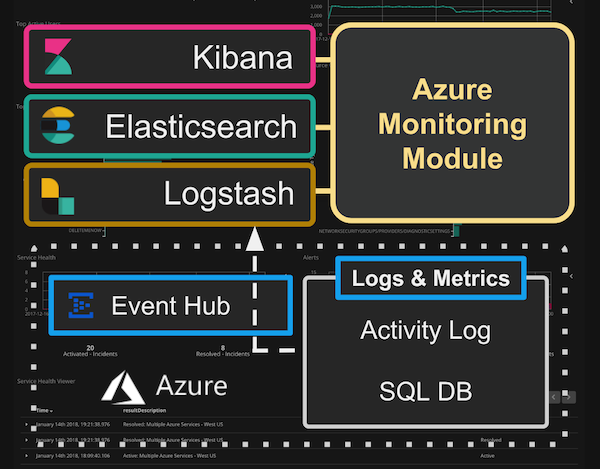
Elastic and Microsoft have collaborated to bring you a turnkey solution for monitoring the Azure Cloud. The module integrates with Azure Monitor, centrally collecting and analyzing activity logs and SQL DB diagnostic logs and metrics through Azure Event Hubs. Interested in running Elasticsearch on Azure? Check out this blog post to learn how to deploy Elasticsearch on Azure in a couple minutes with official templates in the Azure Marketplace.
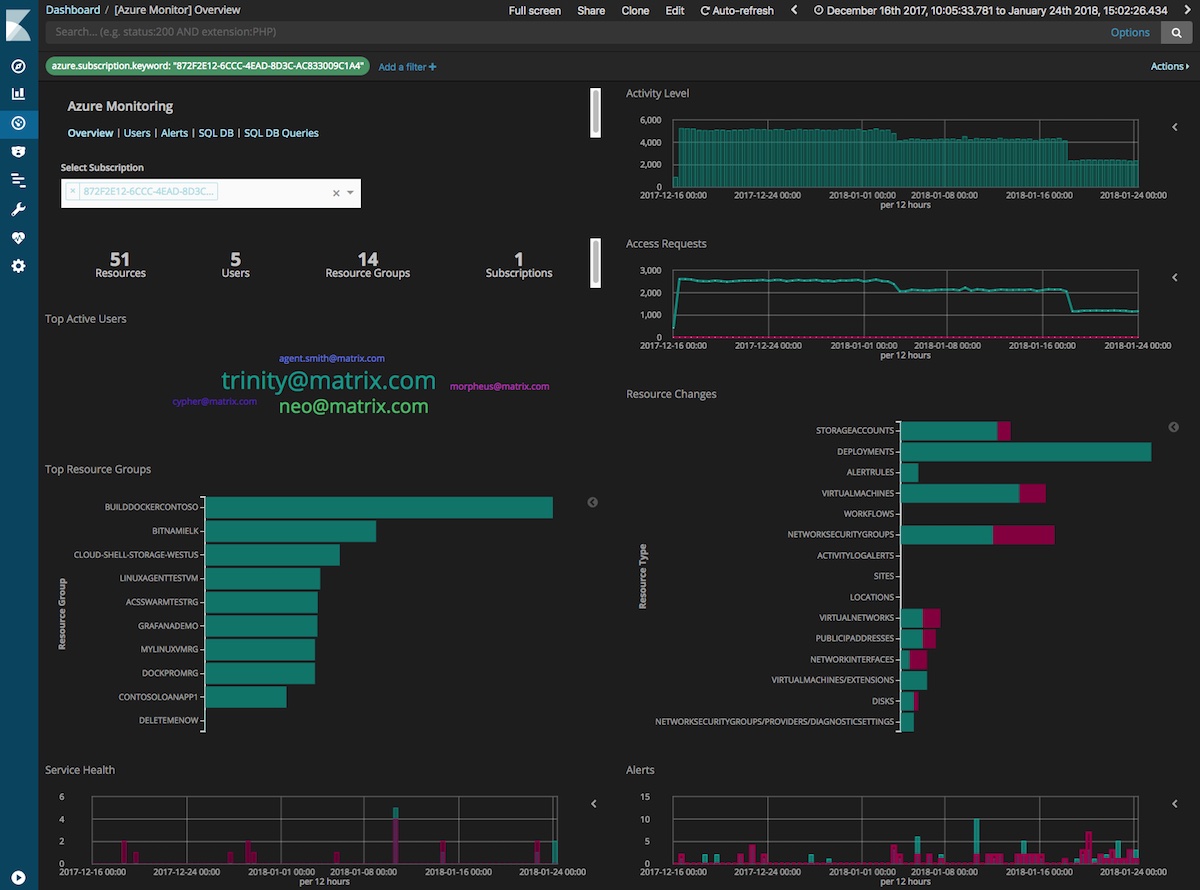
Azure Activity Log Monitoring
The core integration of this module is with the activity log, which tracks the overall activity of an Azure subscription. The module bundles Kibana dashboards for administrators to quickly understand the activity landscape across an entire deployment, with dedicated monitoring dashboards for user and alert activity. Quickly uncover suspicious activities like brute force attacks on a user login, unexpected infrastructure creations / deletions, or high alert density from a particular resource group. These are indeed Kibana dashboards, so you not only have the power of Kibana visualizations at your fingertips, but also the flexibility to edit, augment, and even add new dashboards to tailor tightly with your business requirements.
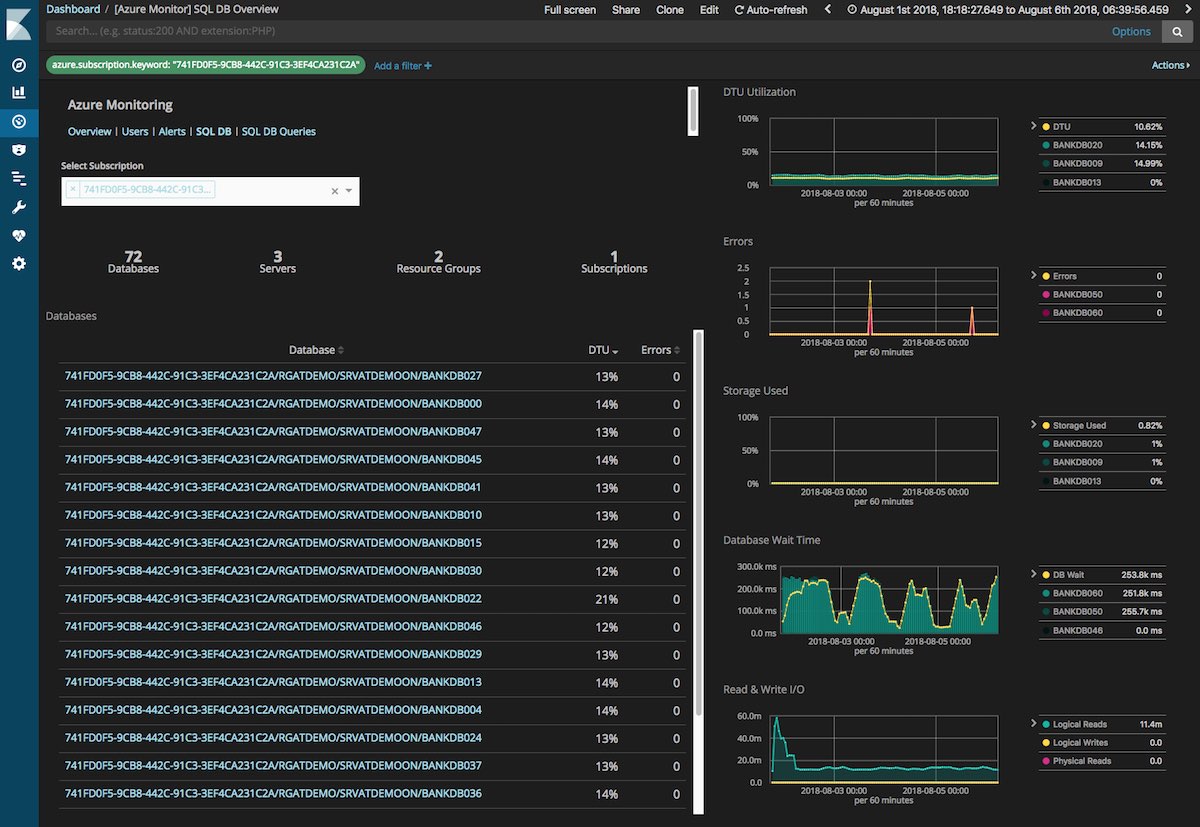
Azure SQL Database Monitoring
Additionally, we also offer a dedicated experience for monitoring your Azure SQL Database deployments. Keep a pulse on your database health and performance with the module through key real-time metrics like DTU utilization, errors, disk usage, and wait times. Deep dive into query execution and performance to better understand and resolve run-time bottlenecks.
New Azure Event Hubs Input Plugin
The Azure monitoring module leverages the new Logstash Azure Event Hubs input plugin. This plugin enables Logstash to scalably consume and process data from any Event Hub for real-time analytics with the Elastic Stack. Event Hubs and other messaging queues are often key architectural hubs for centralized data ingestion and resilient streaming ETL. For product feedback, please feel free to file an issue in the plugin Github repo.
Free to Use and Easy to Upgrade
The Azure monitoring module has initially been introduced as an experimental feature and is free to use under the Elastic Basic License. On top of that, users have the option to upgrade their Elastic deployment with a subscription that includes additional powerful features like security controls, alerting, monitoring, reporting, Graph analytics, and machine learning. Users can quickly achieve an automated monitoring platform by creating alerts for automated notifications and machine learning jobs for anomaly detection and predictive forecasting.
Monitoring your Azure deployments with the Elastic Stack has never been easier. Check out the Logstash Azure monitoring module documentation to get started!
For more information:
- More details on the Logstash product
- Other available module integrations for Filebeat, Metricbeat, and Logstash
- Azure monitoring module demo from Elastic{ON} 2018
- Learn more about Microsoft on Elastic’s technology partner page
- Azure Marketplace Elastic template
- Overview of Azure Monitor and Event Hubs
If you prefer email, feel free to drop us any questions or feedback at monitor-azure@elastic.co.