A simplified stack monitoring experience in Elastic Cloud on Kubernetes
To monitor your Elastic Stack with Elastic Cloud on Kubernetes (ECK), you can deploy Metricbeat and Filebeat to collect metrics and logs and send them to the monitoring cluster, as mentioned in this blog. However, this requires understanding and managing the complexity of Beats configuration and Kubernetes role-based access control (RBAC).
Now, in ECK 1.7, the Elasticsearch and Kibana resources have been enhanced to let us specify a reference to a monitoring cluster. When specified, sidecar containers are automatically set up by ECK to ship logs and metrics to the referenced Elasticsearch cluster.
If you are new to ECK
If you are new to ECK, here are the steps to start from scratch.
Set up ECK
First, let's deploy our ECK in Kubernetes.
Deploy production and monitoring environment
Once the ECK operator is ready, we can deploy the Elastic Stack. To make the steps easier, we can deploy the monitoring cluster first and then deploy the production cluster and refer it to the monitoring cluster.
Here's the documentation on how to deploy Elasticsearch and how to deploy Kibana.
To enable stack monitoring, simply reference the monitoring Elasticsearch cluster in the spec.monitoring section of their specification, in the production cluster, as described in the manual.
spec:
  monitoring:
    metrics:
      elasticsearchRefs:
      - name: monitoring-cluster    # assuming monitoring ES cluster name is "monitoring-cluster"
        namespace: observability    # assuming monitoring ES cluster is in observability namespace
    logs:
      elasticsearchRefs:
      - name: monitoring-cluster    # assuming monitoring ES cluster name is "monitoring-cluster"
        namespace: observability    # assuming monitoring ES cluster is in observability namespace
If you already have ECK running
If you already have ECK running, you can enable monitoring as follows:
- First, deploy a separate Elasticsearch cluster for monitoring purposes if you haven’t already.
- Second, update the existing Elasticsearch production cluster manifest yaml to add the reference to monitoring Elasticsearch cluster in the spec.monitoring section, and apply it.
It may take a few minutes to get reflected.
A start from zero sample
Here is a start from zero sample. The sample yaml file is from my GitHub Gist.
- Set up ECK
kubectl create -f https://download.elastic.co/downloads/eck/1.7.1/crds.yaml && kubectl apply -f https://download.elastic.co/downloads/eck/1.7.1/operator.yaml
- Deploy Monitoring Elastic Stack to monitor
kubectl create -f https://gist.githubusercontent.com/kunisen/58fb0a2c09f2c07e22372bd96763923f/raw/7ce32113a67d3c4fc910fd41fe85a382f83d6b93/1_eck-monitoring-stack-714.yaml
- Deploy Production Elastic Stack to be monitored
kubectl create -f https://gist.githubusercontent.com/kunisen/58fb0a2c09f2c07e22372bd96763923f/raw/7ce32113a67d3c4fc910fd41fe85a382f83d6b93/2_eck-prod-stack-714_with_monitor.yaml
- Check
Login to Kibana with the elastic user. The password can be retrieved as below if needed.
# assuming namespace for monitoring is "observability"
kubectl -n observability get secret monitoring-cluster-es-elastic-user -o go-template='{{.data.elastic | base64decode}}'
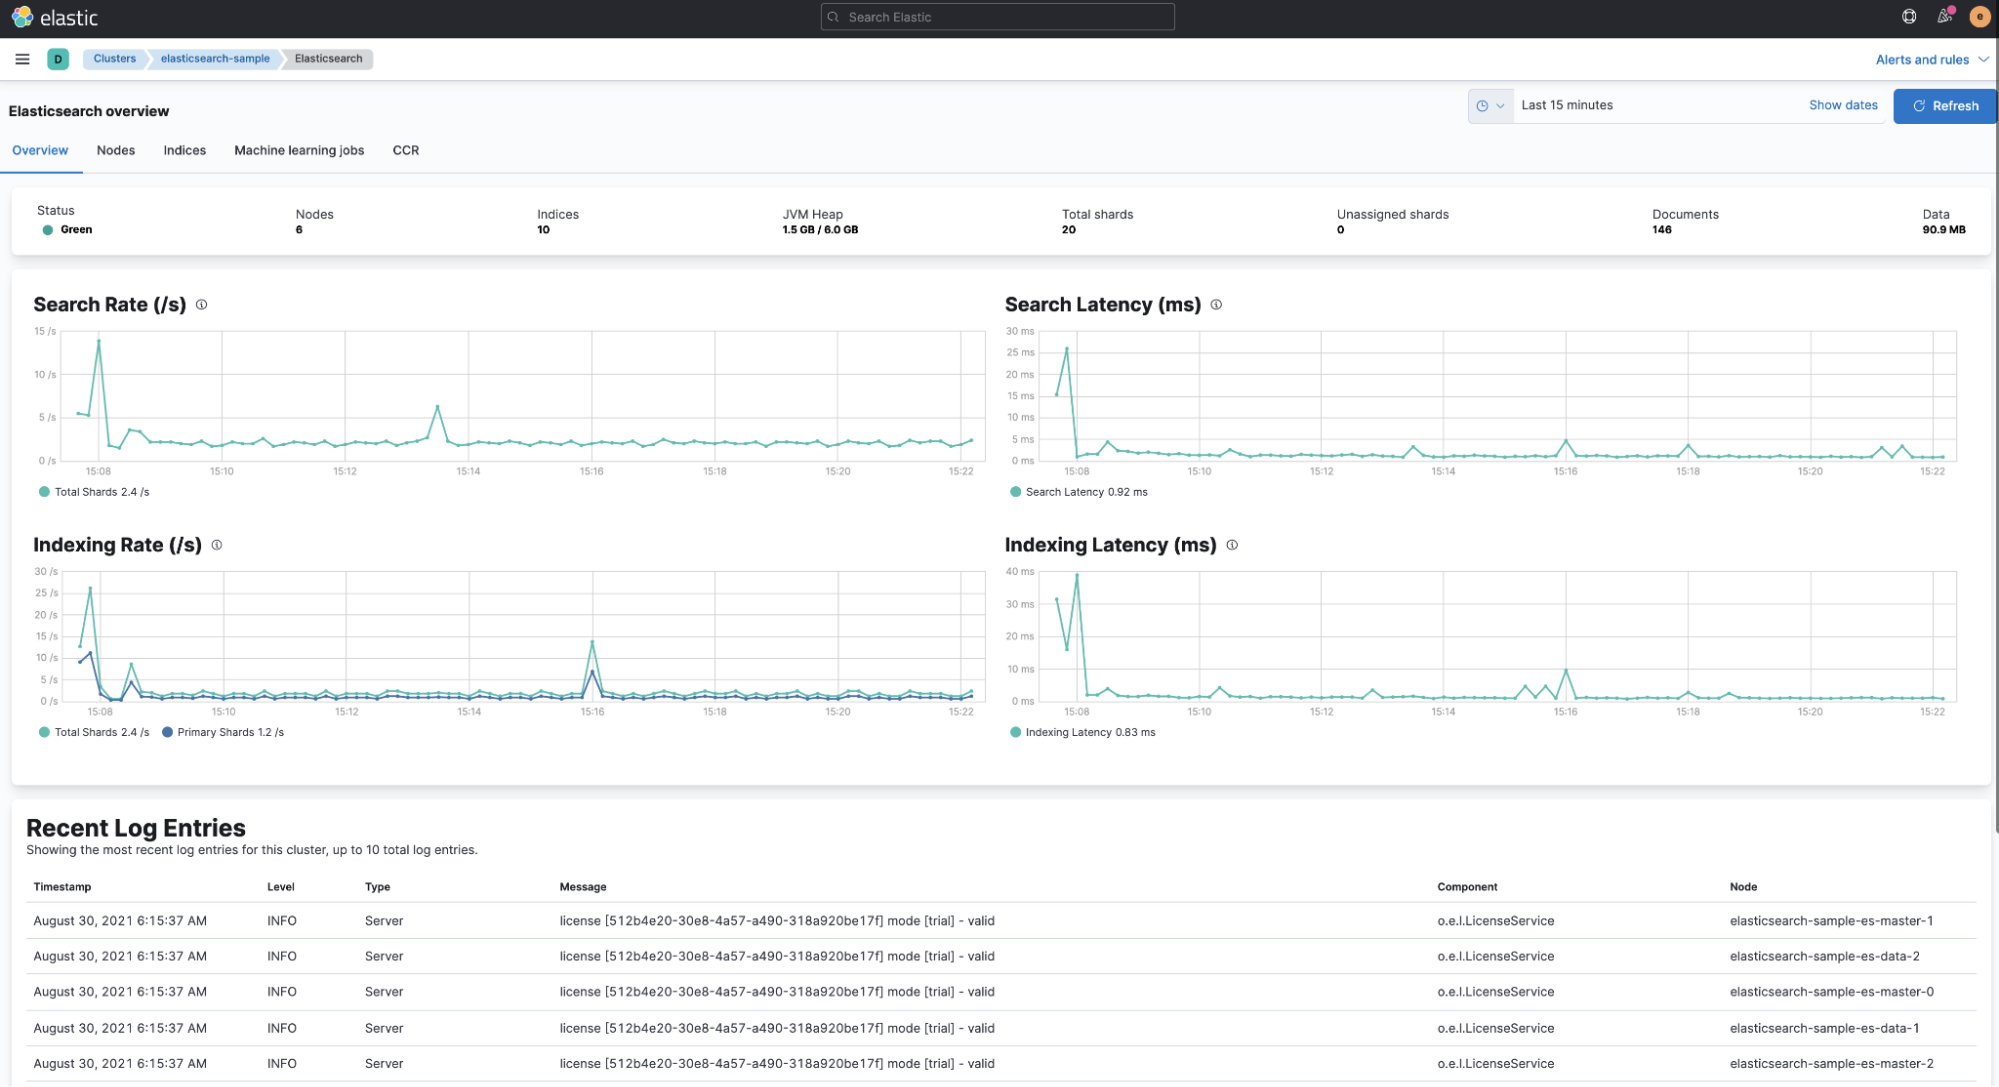
In the Stack Monitoring UI, we can see that the monitoring logs and metrics are in good shape for Elasticsearch and Kibana.
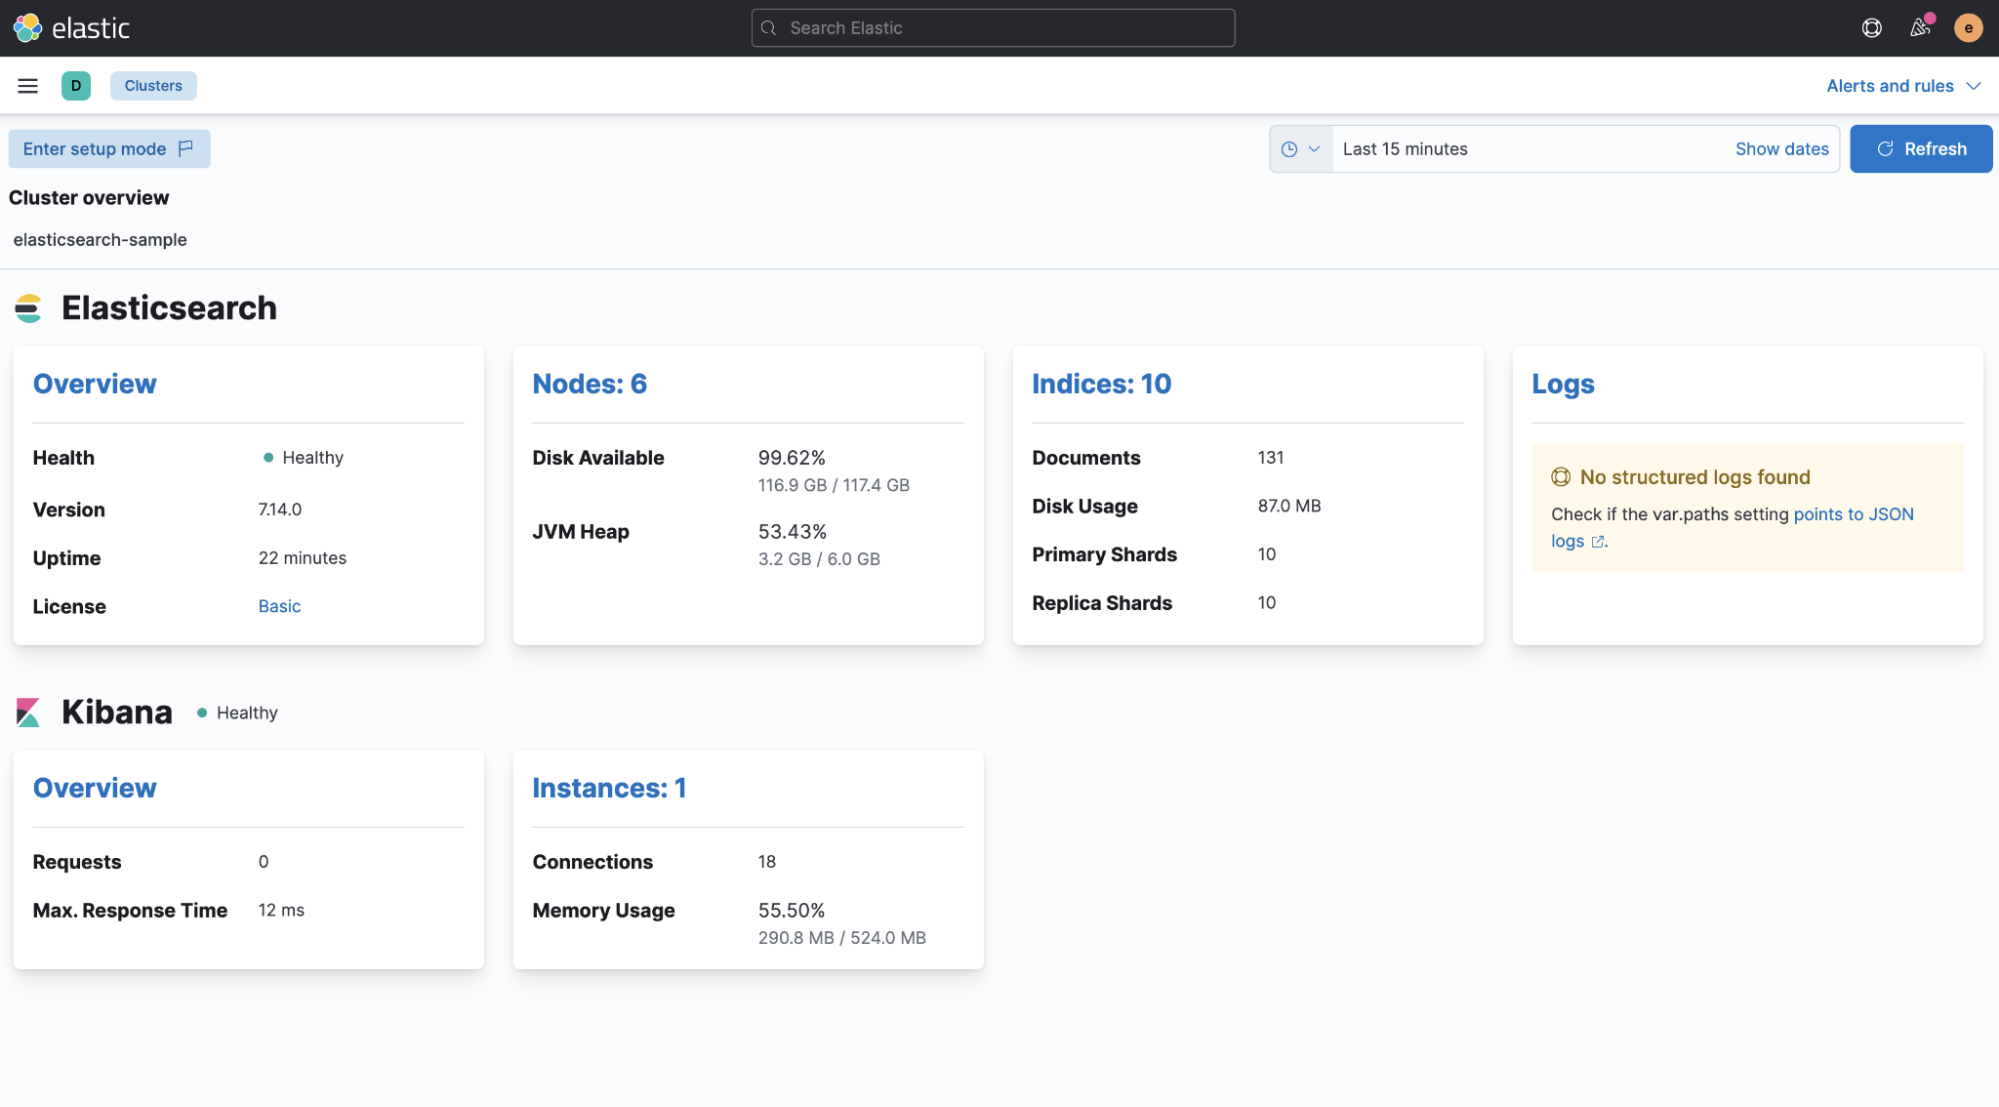
By default, things like indexing/search rate metrics are collected and showing.
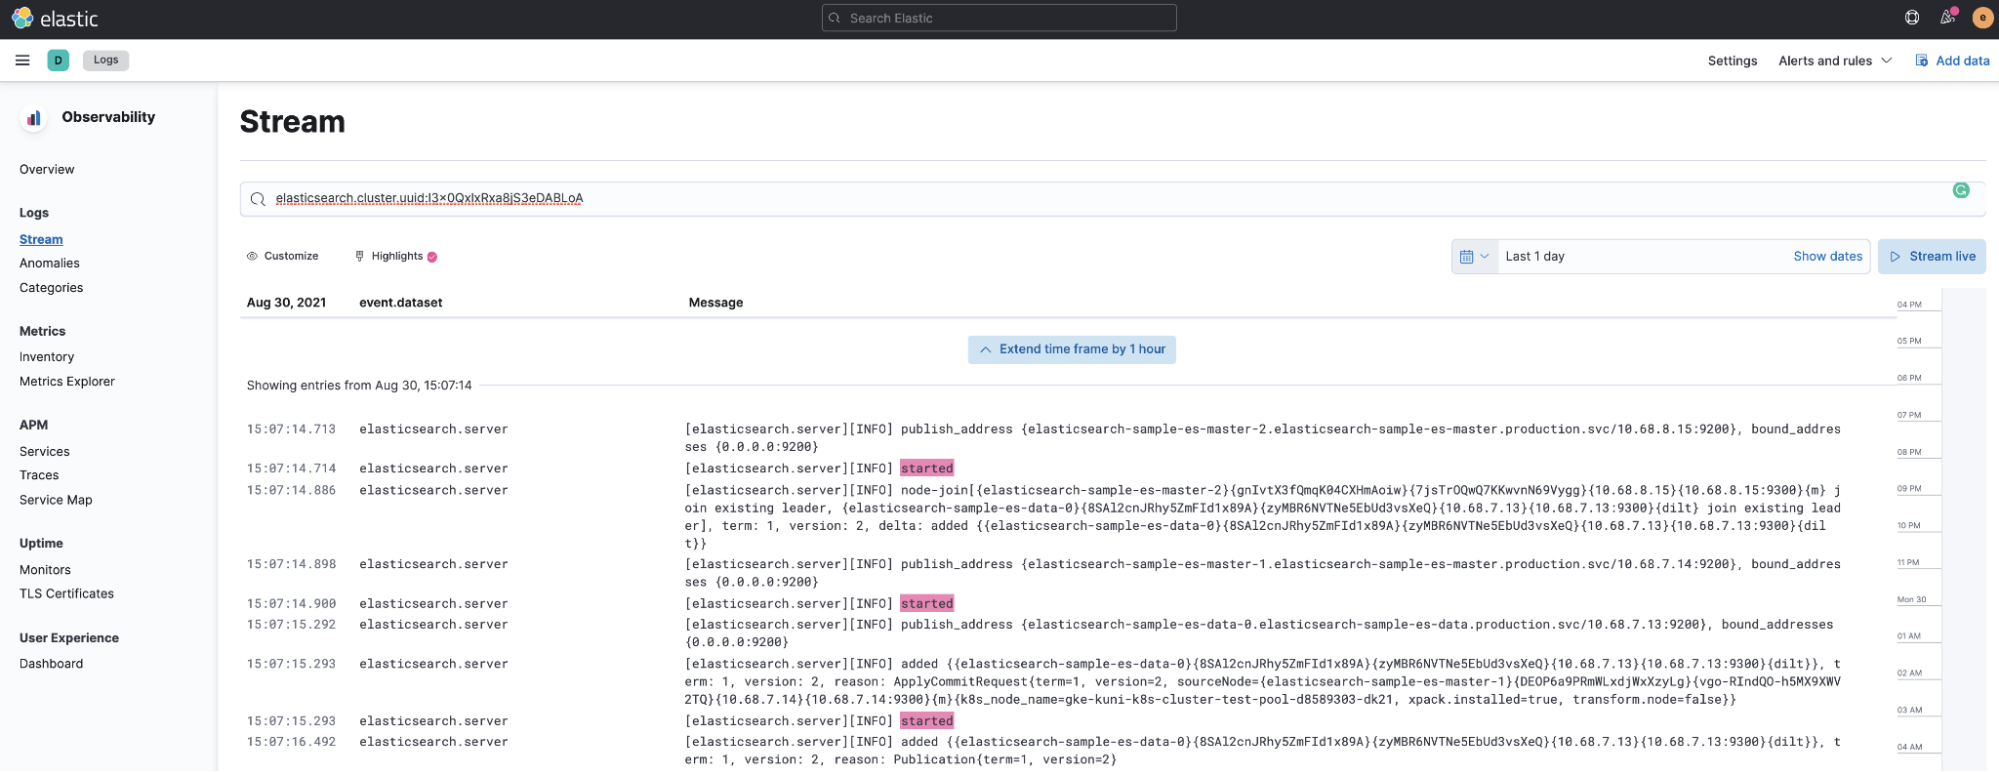
We can also have more visibility into what’s going on inside the cluster by viewing Elasticsearch logs in the Logs view in Elastic Observability. In this example, we highlighted the started message of each Elasticsearch node.
Also, just in case you are new to ECK, let’s start a trial per the guide here.
cat <<EOF | kubectl apply -f -
apiVersion: v1
kind: Secret
metadata:
  name: eck-trial-license
  namespace: production    # also turn on this for “monitoring-cluster” next
  labels:
    license.k8s.elastic.co/type: enterprise_trial
  annotations:
    elastic.co/eula: accepted
EOF
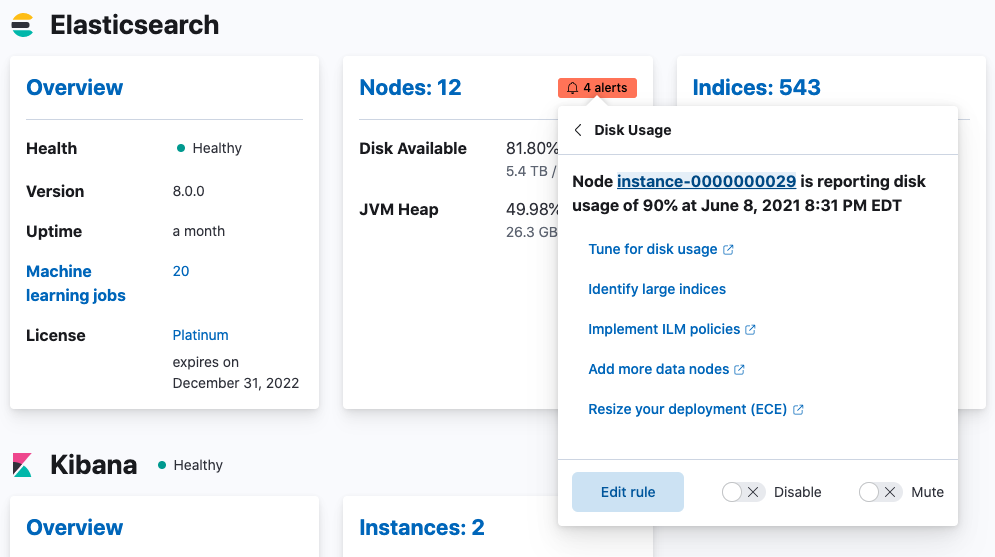
Then we can enjoy the awesome out-of-the box Kibana alerts, per the guide below:
“The Elastic Stack monitoring features provide Kibana alerting rules out-of-the box to notify you of potential issues in the Elastic Stack. These rules are preconfigured based on the best practices recommended by Elastic. However, you can tailor them to meet your specific needs.”
That’s it! We hope this has been useful to help you manage and maintain your cluster.
Additional notes
As mentioned in the manual, there are currently some limitations with this approach.
- You cannot configure an Elasticsearch cluster to monitor itself. The monitoring cluster has to be a separate cluster.
- The monitoring cluster must be managed by ECK in the same Kubernetes cluster as the monitored cluster.