Kibana Dashboards API: A stable contract for every panel type, tested by 50+ teams before GA
Manage Kibana dashboards as code: Commit to Git, promote across environments, and automate deployments with the Kibana API and Terraform.
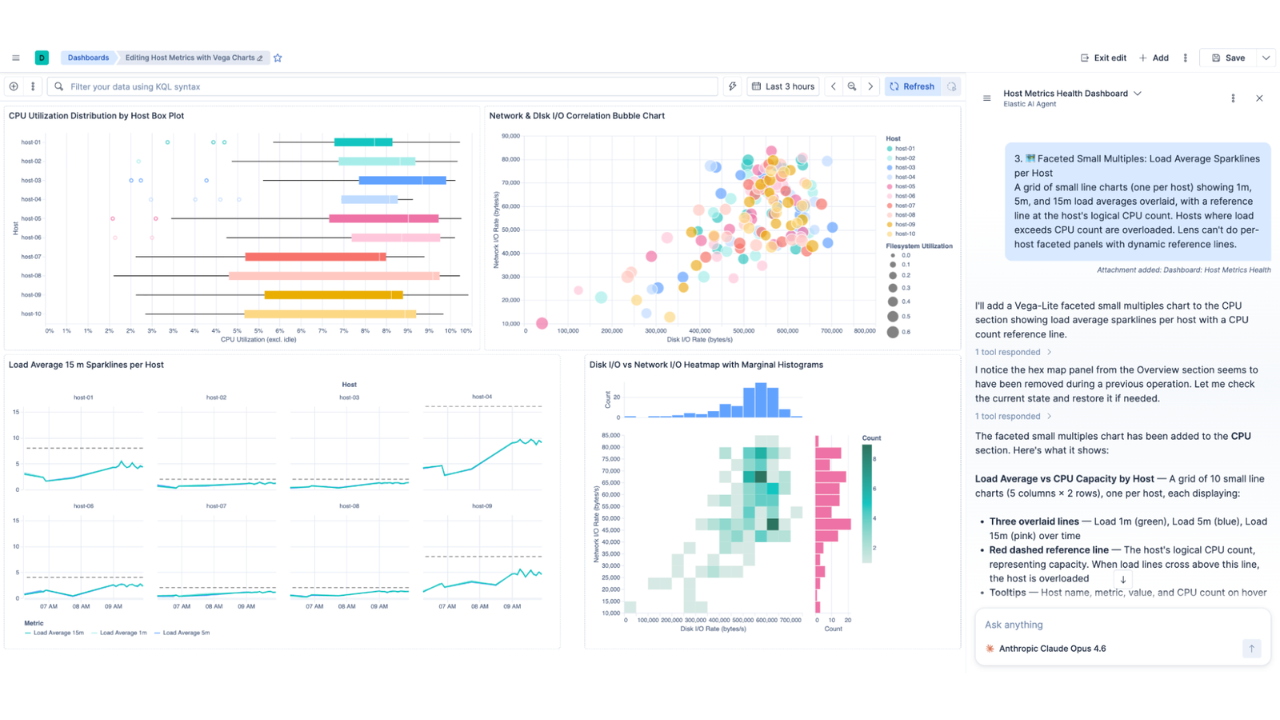
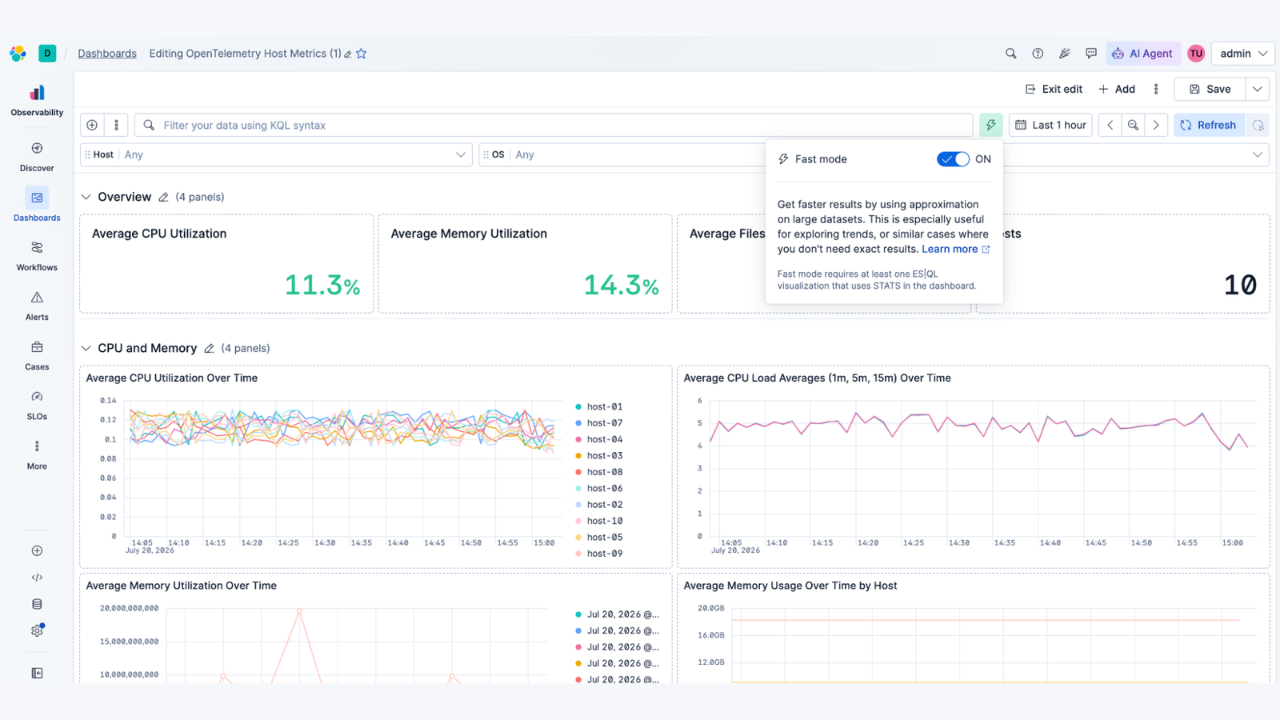
The Kibana Dashboards and Visualizations APIs are production-ready in Elastic 9.5, available across all subscription tiers, with full backward compatibility. Define your dashboards as JSON, commit them to Git, and then deploy across environments using continuous integration and continuous deployment (CI/CD) pipelines, Terraform, or whatever tooling you already have. Over 50 teams tested the API during technical preview in 9.4, some already running it in production. Version 9.5 also adds new endpoints (in technical preview) for Tags, with Markdown and Links panel endpoints available now in Elastic Cloud Serverless and landing in 9.6.
What backward compatibility means for the Kibana Dashboards API
During technical preview, the API shape could change between releases.[1] That's no longer the case. General availability (GA) means:
Complete backward compatibility. New fields and panel types will be added over time, but existing fields and behavior remain unchanged. Any future breaking changes would be very carefully considered and would only be introduced in a new major stack version.
Production-ready with full support. The API carries Elastic's full support guarantees. You can safely use it in production environments for automated deployments, environment promotion, and programmatic dashboard management.
New Kibana API endpoints for Tags, Markdown, and Links panels
Elastic 9.5 also introduces a new standalone endpoint for Tags, which let you categorize and filter dashboards. Now you can manage them programmatically through dedicated CRUD endpoints, making it easier to organize dashboards at scale across environments.
New Markdown and Links panel endpoints are available now in Serverless and will land in the next stack release (9.6).
What panel types does the Kibana Dashboards API support?
The Dashboards API supports all by-value panels in 9.5 (those defined directly in a dashboard, as opposed to library panels saved for reuse). Every supported panel type has a typed, validated schema.
Panel type | Status |
XY charts | Supported |
Metrics | Supported |
Pie | Supported |
Gauge | Supported |
Heatmap | Supported |
Data tables | Supported |
Treemap | Supported |
Discover sessions | Supported |
Controls | Supported |
Markdown | Supported |
Links | Supported |
ML panels | Supported |
Observability panels | Supported |
Maps | Coming soon |
Vega | Coming soon |
How to manage Kibana dashboards as code
The Dashboards API enables a full dashboards-as-code workflow: Export a dashboard as clean, diffable JSON, commit it to Git as the source of truth, review changes in pull requests, and deploy the same definition across development, staging, and production. Once a dashboard is managed as code, treat Git as the single source of truth: Changes made directly in the UI are overwritten the next time you deploy.
The main challenge when moving a dashboard between spaces, clusters, or stages is that dashboards reference objects like data views and library visualizations by ID. Because these IDs are auto-generated and differ across environments, a dashboard exported from one environment can point at objects that don't exist in another. There are three ways to handle this, listed here from most to least automated:
Use Terraform. The Elastic Stack Terraform provider tracks each resource and maps IDs per environment automatically, so references stay consistent as you promote a dashboard from development to production.
Define by-value Elasticsearch Query Language (ES|QL) panels. The most portable way to build a panel is to define its visualization with ES|QL directly in the dashboard. An ES|QL query reads from the indices you name in it, so the panel carries no external references to data views or library objects. The result is a fully self-contained, portable dashboard.
Assign matching IDs. If you reference saved objects, like data views or library visualizations, create them with a chosen ID using
PUT(upsert) rather thanPOST(which auto-generates an ID). Use human-readable IDs, likelogs-prod, so they're easy to reuse and recognize across environments.
For a detailed walkthrough of these portability patterns and the full dashboards-as-code workflow, see the Manage dashboards as code documentation.
Create a Kibana dashboard with the Dashboards API using PUT
Here's a quick example creating a dashboard with a metric panel using PUT instead of POST to assign a custom ID using the dashboard name (service-health-overview). The same logic works for creating standalone visualizations saved in the library.
PUT kbn:/api/dashboards/service-health-overview
{
  "title": "Service health overview",
  "description": "Key service metrics — managed via API",
  "tags": [
    "production",
    "sre-team"
  ],
  "panels": [
    {
      "type": "vis",
      "grid": {
        "x": 0,
        "y": 0,
        "w": 12,
        "h": 8
      },
      "config": {
        "title": "Error rate (5xx)",
        "type": "metric",
        "data_source": {
          "type": "esql",
          "query": "FROM logs-* | WHERE http.response.status_code >= 500 | STATS error_rate=count(*) BY host.name"
        },
        "metrics": [
          {
            "type": "primary",
            "column": "count"
          }
        ]
      }
    }
  ]
}
Kibana Dashboards API roadmap: Maps, Vega, and standalone endpoints
We're actively expanding the API surface. Maps and Vega panel support is next, adding typed schemas for them. We're also building standalone CRUD endpoints for Discover sessions (beyond their existing support as dashboard panels), Vega, Maps, and Annotations, decoupled from the dashboard lifecycle.
For the full schema definitions, visit the Dashboards API documentation. For Terraform users, the Elastic Stack Terraform provider supports the GA Dashboards API.
Note
The core endpoints are unchanged from the technical preview. If you built integrations against 9.4, they work in 9.5. The only breaking changes are two minor ones affecting dashboard listing and duration unit formats, documented here.
Related Content