Elastic Observability 8.11: ES|QL, Universal Profiling in APM, and enhanced SLOs


 Share on Twitter
Share on Twitter

 Share on LinkedIn
Share on LinkedIn

 Share on Facebook
Share on Facebook

 Share by Email
Share by Email

 Print this page
Print
Elastic Observability 8.11 introduces ES|QL for Observability (technical preview), Universal ProfilingTM and Elastic APM integration, and new SLO enhancements for Elastic Observability:
- ES|QL for Elastic Observability: Now in tech preview, Elasticsearch Query Language (ES|QL) transforms, enriches, and simplifies data investigations. Read about how ES|QL integrates with Elastic AI Assistant, easily creates alerts, and creates contextual insights with a single query.
- Universal Profiling with Elastic APM: Correlate application performance issues with underlying system functions in APM without having to switch context. This helps SREs increase visibility and reduce time to resolution.
- New capabilities added to the SLO tech preview enhancing operational experience, which include adding dashboards as a panel, new error rate charts, the ability to partition by APM indicators, and more.
Elastic Observability 8.11 is available now on Elastic Cloud — the only hosted Elasticsearch® offering to include all of the new features in this latest release. You can also download the Elastic Stack and our cloud orchestration products, Elastic Cloud Enterprise and Elastic Cloud for Kubernetes, for a self-managed experience.
What else is new in Elastic 8.11? Check out the 8.11 announcement post to learn more >>
ES|QL for Observability
AI Assistant ES|QL enhancements
The Elastic AI Assistant for Observability now includes an ES|QL function that allows users to use natural language to explain a query and have the AI Assistant provide the ES|QL query syntax, explain what the query does, and provide a prompt to run the requested query.
ES|QL Observability alerts
The new ES|QL alerting rule type has been seamlessly integrated into the Elasticsearch rule and is now available within Observability. This rule type provides new and advanced functionalities from the robust ES|QL language, enabling complex alerting scenarios and use cases. Furthermore, users have the capability to preview and analyze the results of their ES|QL query prior to finalizing and saving the rule. In case the query returns an empty result, no alerts will be generated.
In the example below, we're using an ES|QL query, to find domains in raw, unparsed Nginx logs. We're interested in domains where the error rate is higher than 10%. This query helps us identify problematic domains. We incorporate this query into our ES|QL alerting rule to notify us when such issues occur.
ES|QL query:
from high-cardinality-data-fake_stack.nginx_proxy-* | grok message "%{DATA:log_date} %{IP:client_ip} - %{DATA:user} admin-console.%{DATA:domain} to: %{DATA:host.name}:%{DATA:http_port}: \"%{DATA:request_method} %{DATA:request_path} %{DATA:http_version}\" %{NUMBER:status_code} %{NUMBER:bytes} \"%{DATA:url}\" \"%{GREEDYDATA:user_agent}\"" | eval good = to_double(to_long(status_code) < 500), bad = to_double(to_long(status_code) >= 500) | stats total_bad = sum(bad), total_good = sum(good) by domain| eval error_rate = (total_bad / (total_bad + total_good)) | WHERE error_rate > 0.1 | drop total_bad, total_good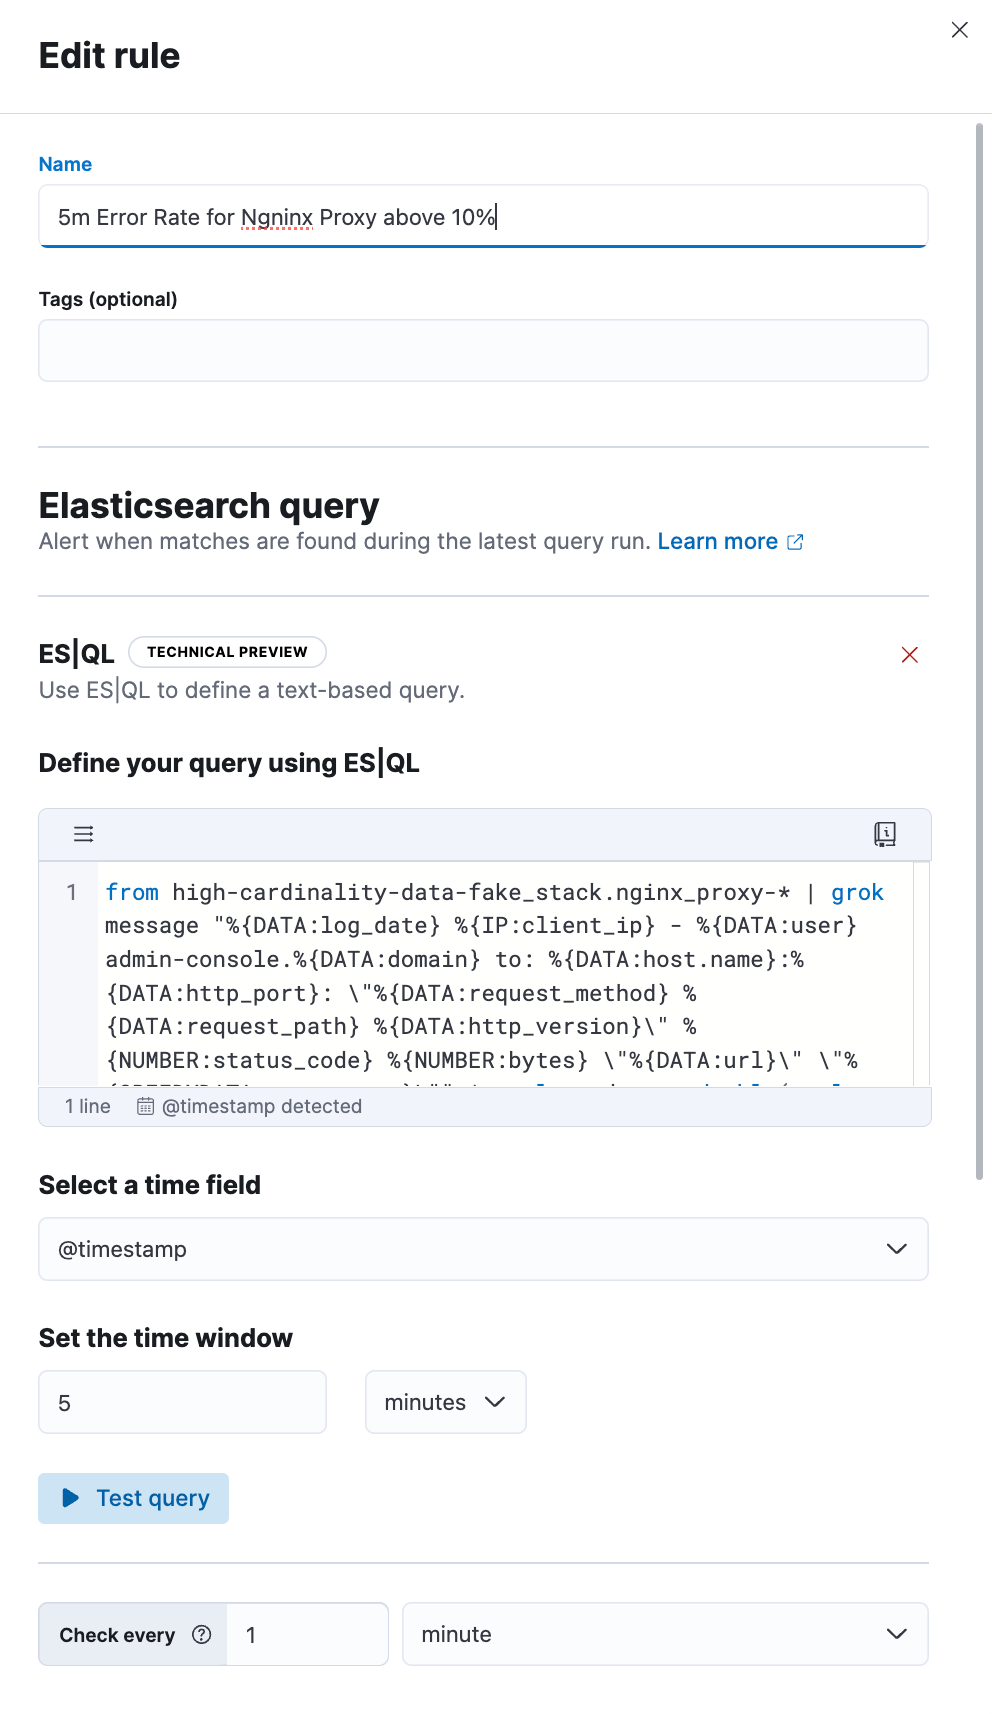
Better together: Universal Profiling and APM integration
We are excited to announce that we have added the ability for users to quickly correlate application performance issues with underlying system functions without needing to switch context from APM to Universal Profiling.
This integration provides a number of benefits, including:
- Reduced time to resolution: DevOps and SREs can now troubleshoot and pinpoint performance and errors in production code down to specific parts of the code, and third-party libraries that need modifying and/or upgrading, etc. This is all done in the APM services view without needing to switch context.
- Improved visibility: Universal Profiling provides unprecedented code visibility into the runtime behavior of all applications running on a host. It profiles every line of code on the host(s) running your services, including not only your application code but also the kernel and third-party libraries. This can help you to identify suboptimal libraries and other processes or services on the same host that could impact a specific service's performance.
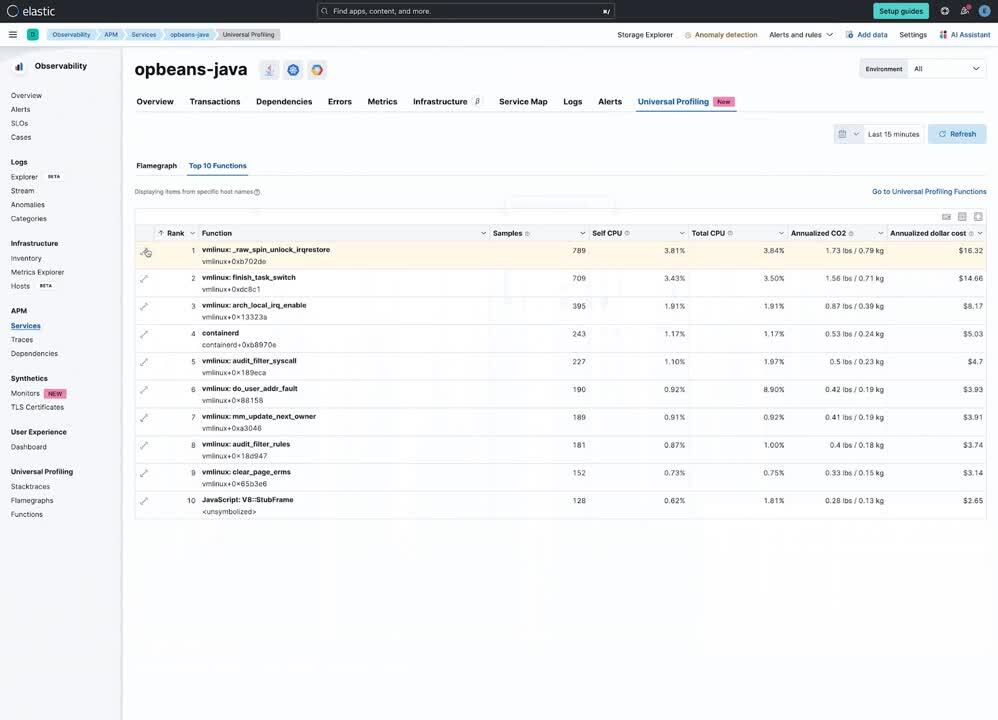
Suppose you are running a containerized Java service on host. Using APM, you notice that the performance of your Java service is degrading over time. From within the APM services page, Universal Profiling is used to identify the specific function calls that are consuming the most CPU time. You find that one of the functions that is taking the most time is a call to a library that is used to connect to a Redis.
You investigate further and find that the library is old, and it is not using the most efficient way to connect to the Redis. You make the necessary changes to the library and the performance of your Java service improves significantly.
In addition to identifying suboptimal libraries, Universal Profiling can also be used to detect other processes or services on the same host that could impact a specific service's performance. For example, you may have a process that is unrelated to the service in question that is using a lot of CPU resources, which could have a knock-on effect on your service.
By integrating Universal Profiling with APM, DevOps and SREs can gain even deeper insights into the runtime behavior of their code and identify and troubleshoot performance bottlenecks more quickly and efficiently.
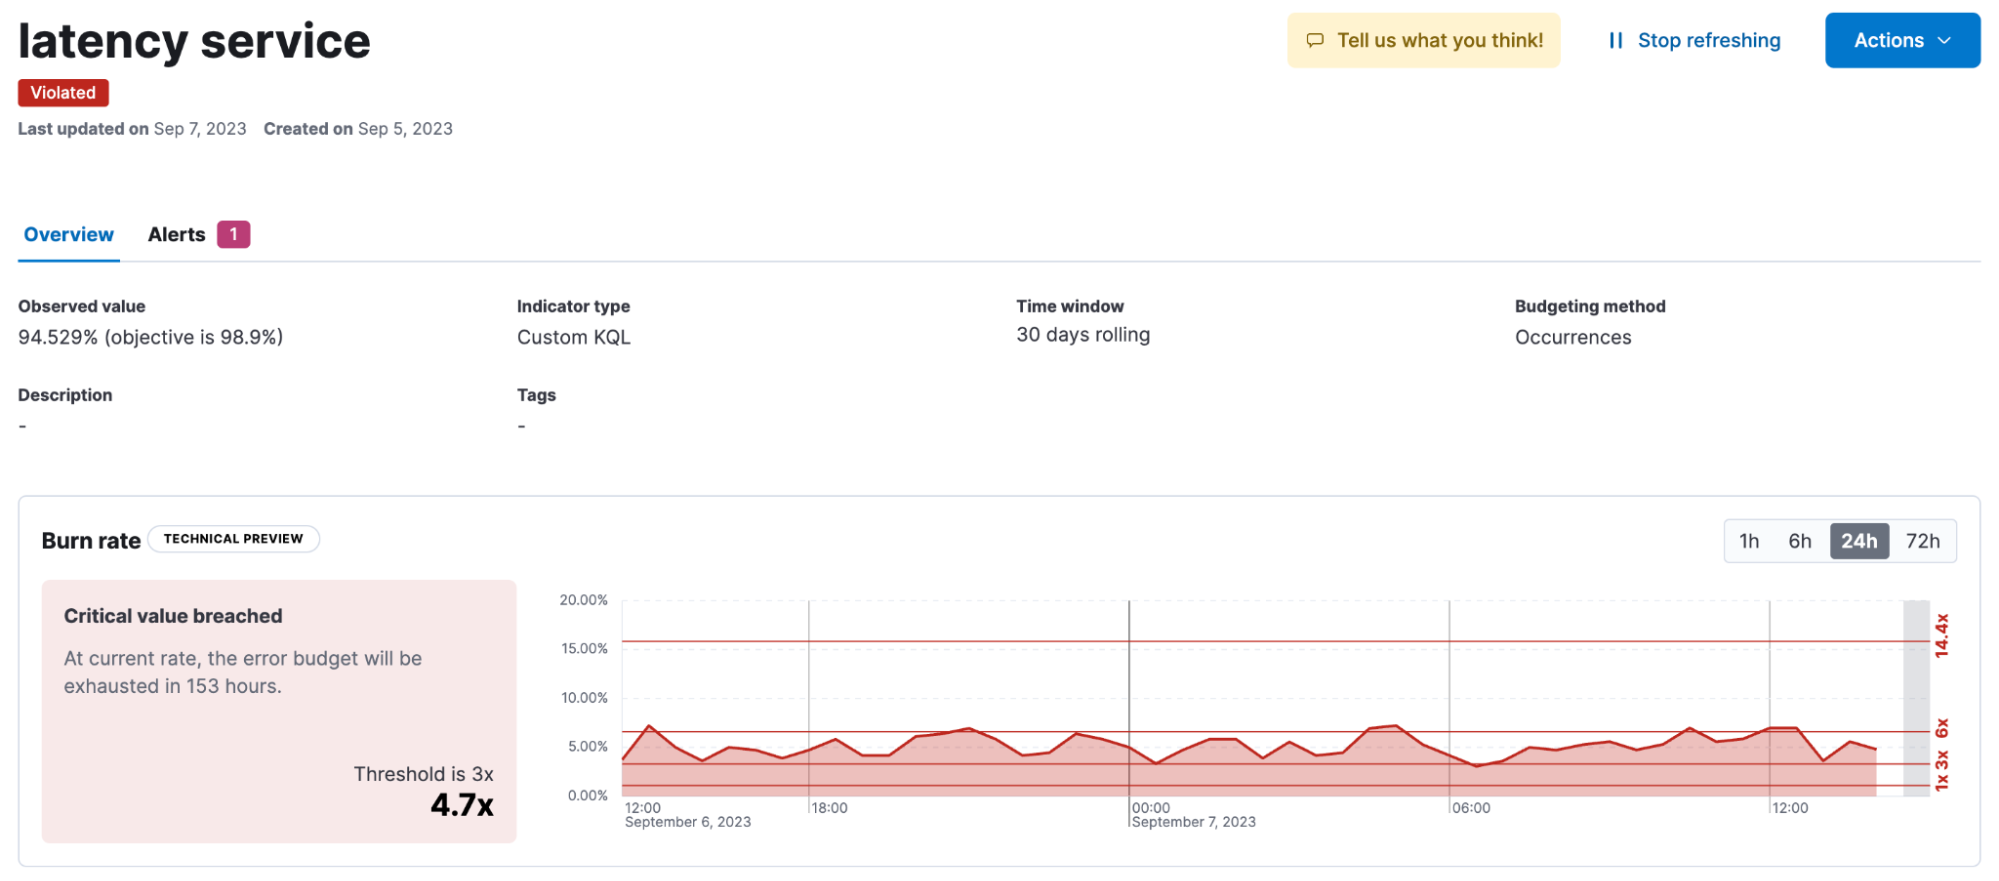
New enhancements to SLOs
Service Level Objectives (SLOs) has several enhancements and performance improvements included in version 8.11. The performance of SLO summary calculations has been improved with enhancements that allow for faster calculations of data queried over cross cluster search.
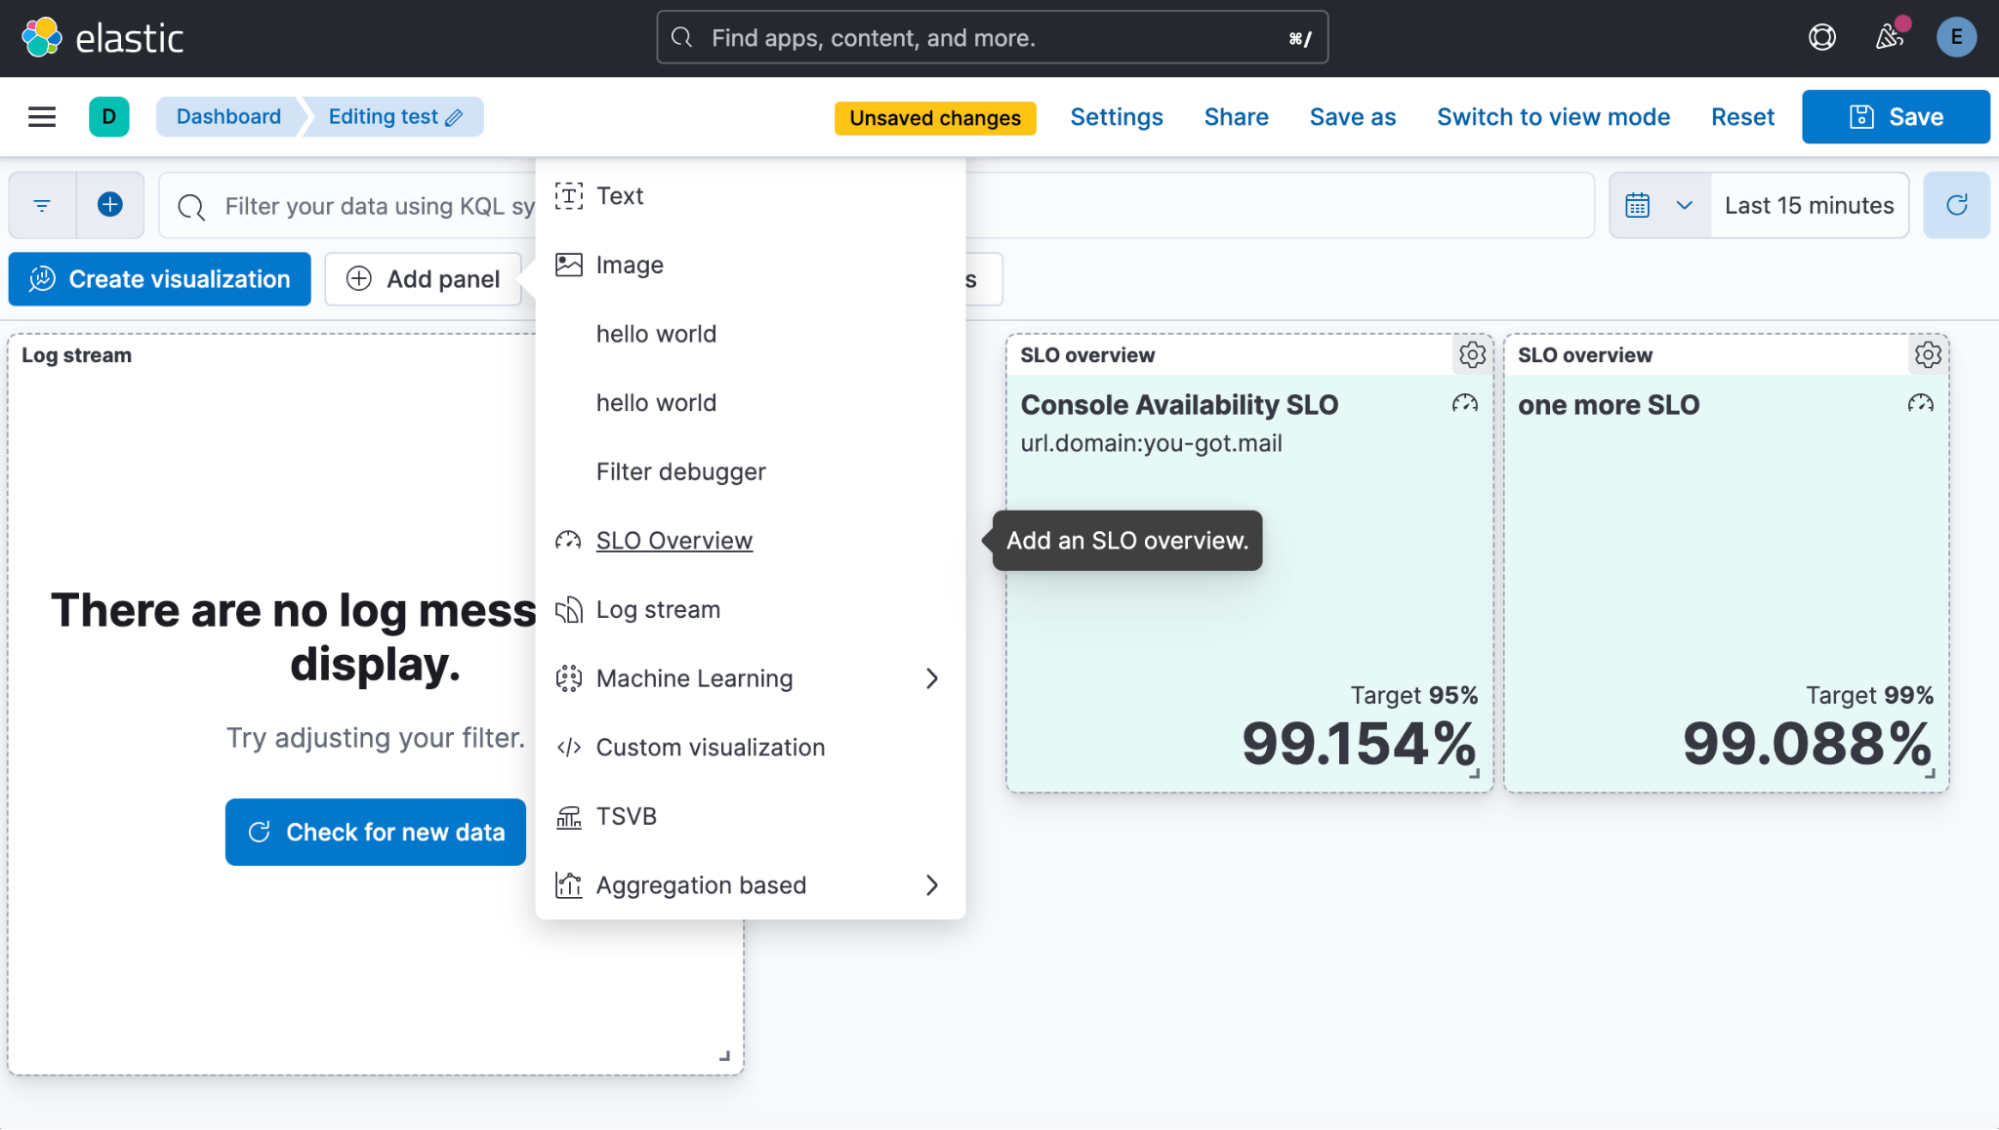
Users are now able to add SLO overviews to dashboards, which will allow them to view SLO status along with other related visualizations.
SLO details now include a new error rate chart with burn rate indicators to help users visualize the recent history of the SLO and how quickly it is changing.
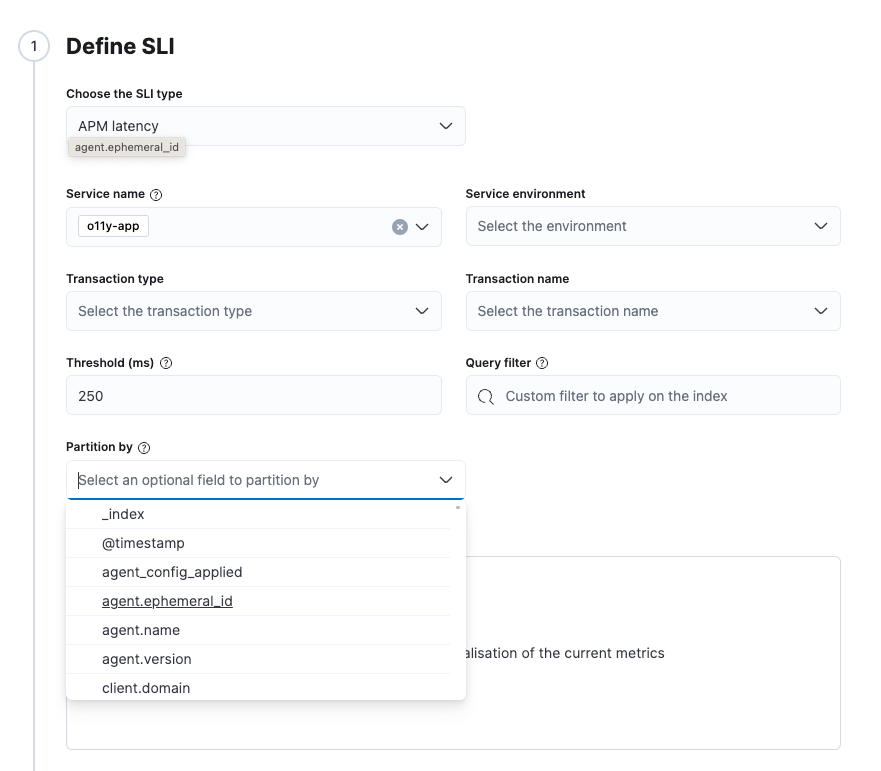
In 8.11, the SLIs for APM latency and error rates include the ability to group across the indicator type and partition for each individual indicator in the group.
Try it out
Read about these capabilities and more in the release notes.
Existing Elastic Cloud customers can access many of these features directly from the Elastic Cloud console. Not taking advantage of Elastic on cloud? Start a free trial.
The release and timing of any features or functionality described in this post remain at Elastic's sole discretion. Any features or functionality not currently available may not be delivered on time or at all.
Share
- Share on Twitter
Share on Twitter
- Share on LinkedIn
Share on LinkedIn
- Share on Facebook
Share on Facebook
- Share by Email
Share by Email
- Print this page
Print