What your Elastic App Search analytics are telling you
At Elastic, we love data. It’s the backbone of what we do: search. And that data takes many forms. A knowledge base article showing how to reset your cable box — data. Logs from your network — data. IP addresses accessing your secure network — data. A video tutorial on how adults can use TikTok — data.
The list goes on. But behind each piece of data is a story. And a person. Or a customer.
As your search volume grows, the need for high-performance analytics and reporting becomes even more important so you can continue to enhance and refine the user experience.
In this blog, we’ll look at ways data inside Elastic App Search is presented. And more importantly, how you can take decisive action to create modern search experiences that become more relevant and personalized as a result of that deep analytical insight.
We’ll limit this blog’s scope by looking at the three most popular and often-used areas of App Search analytics: query analytics, click analytics, and recent queries.
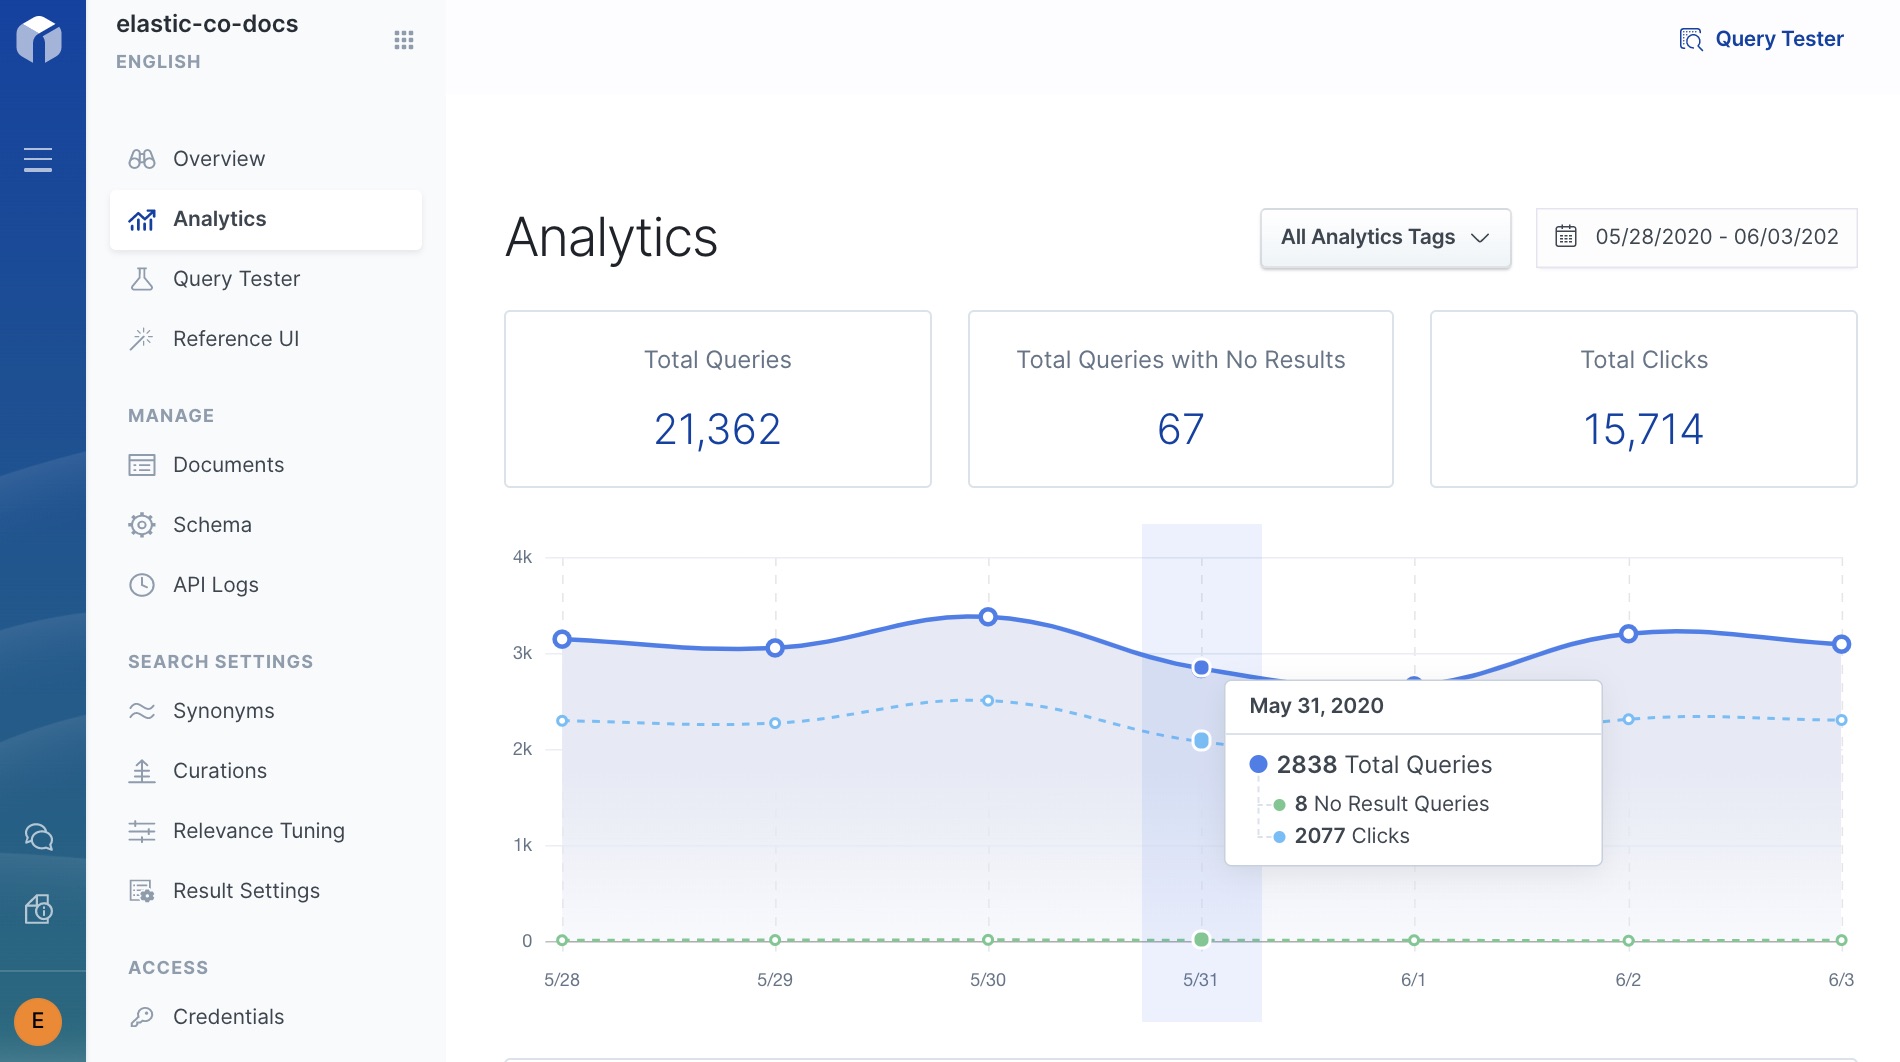
Query analytics
This dashboard provides quick-glance insights into the more frequent queries, and, more importantly, the queries with no results. The obvious benefit here is the potential to identify and close the gaps in your content. This can be crucial for customer support sites where data like this could give early indications of support content that needs to be created to fill the “no results” gap and increase self-service success.
After selecting a date range, top queries are displayed showing the exact search term(s) used, the number of queries produced by that term, and how many total clicks occurred on that term(s).
The insights become apparent when you see the Top Queries with No Results dashboard. This means your customers, partners, and prospects are looking for something on your site and not finding it. You’re likely spending lots of marketing dollars to get traffic to your site, but now this is becoming a missed opportunity for conversion or customer satisfaction (CSAT).
Knowing the data is nice. But being able to arm your admins and content analysts with actionable data to create new content separates you from the pack. So let’s look at how to address this issue.
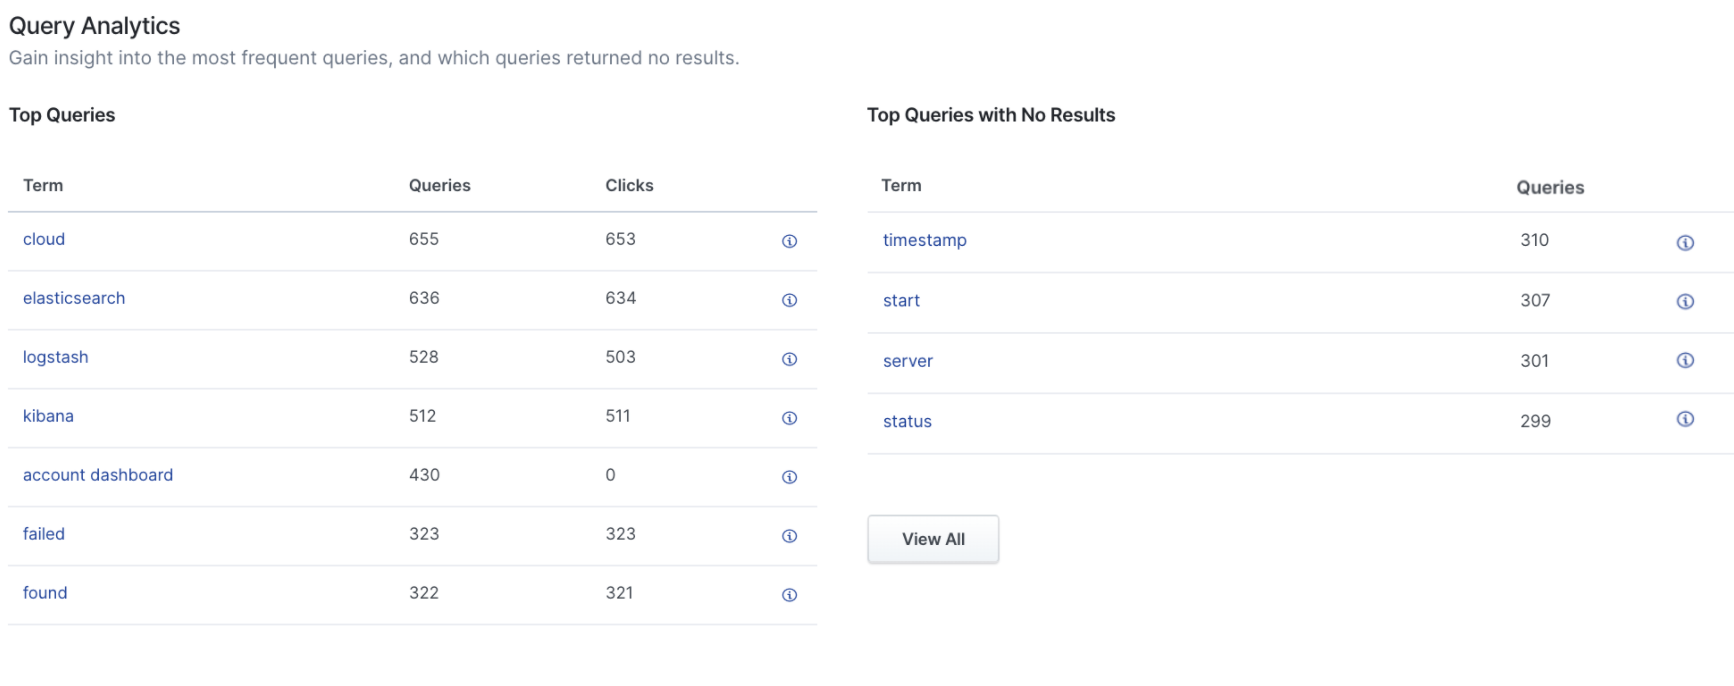
In this example, we see “account dashboard” is a very popular query, but hasn't received any clicks. But since we know that “account dashboard” could also mean “account profile” or “account settings,” we can use the synonym feature to fix this issue to increase click performance.
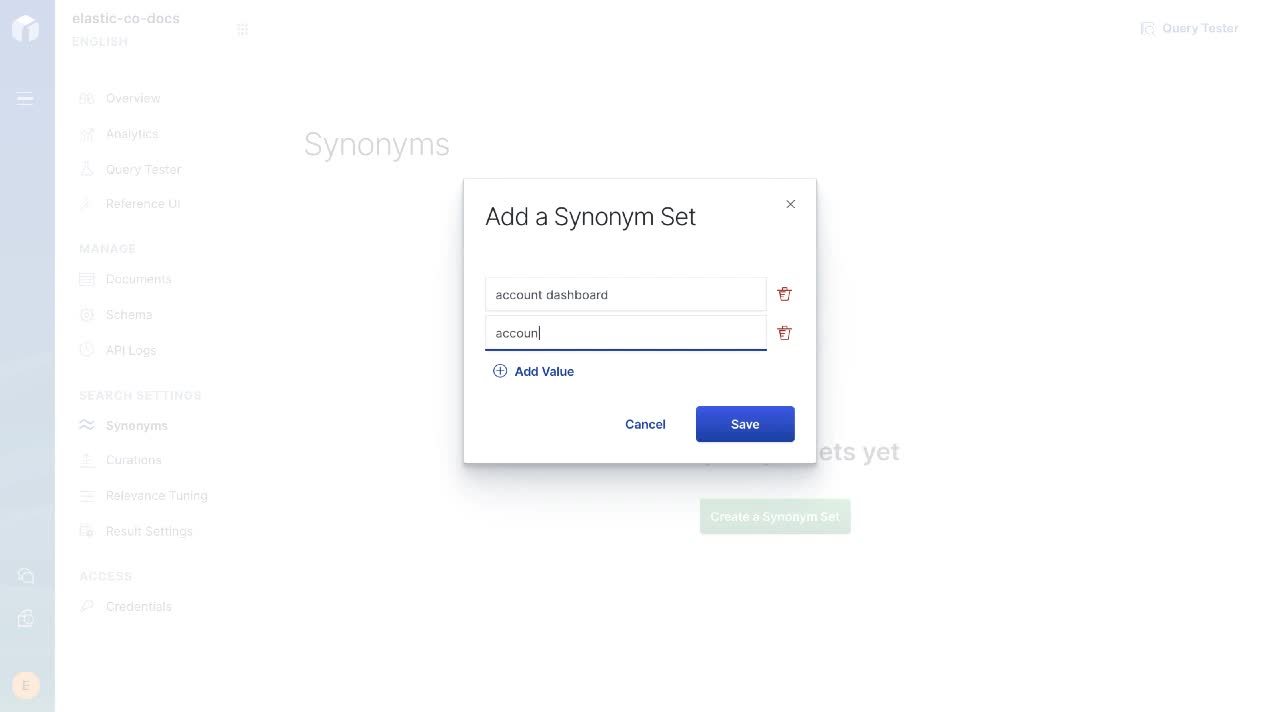
We create a synonym set where “account dashboard” also is associated with the terms “account profile” and “account settings.” That’s it! Now when a user queries for any of those terms, content will be returned — eliminating frustration for them and producing better click-through results for you.
Click Analytics
Speaking of click-throughs, Click Analytics is the next area within App Search analytics we’ll investigate. This set of dashboards display in real time which queries generated the most and fewest clicks.
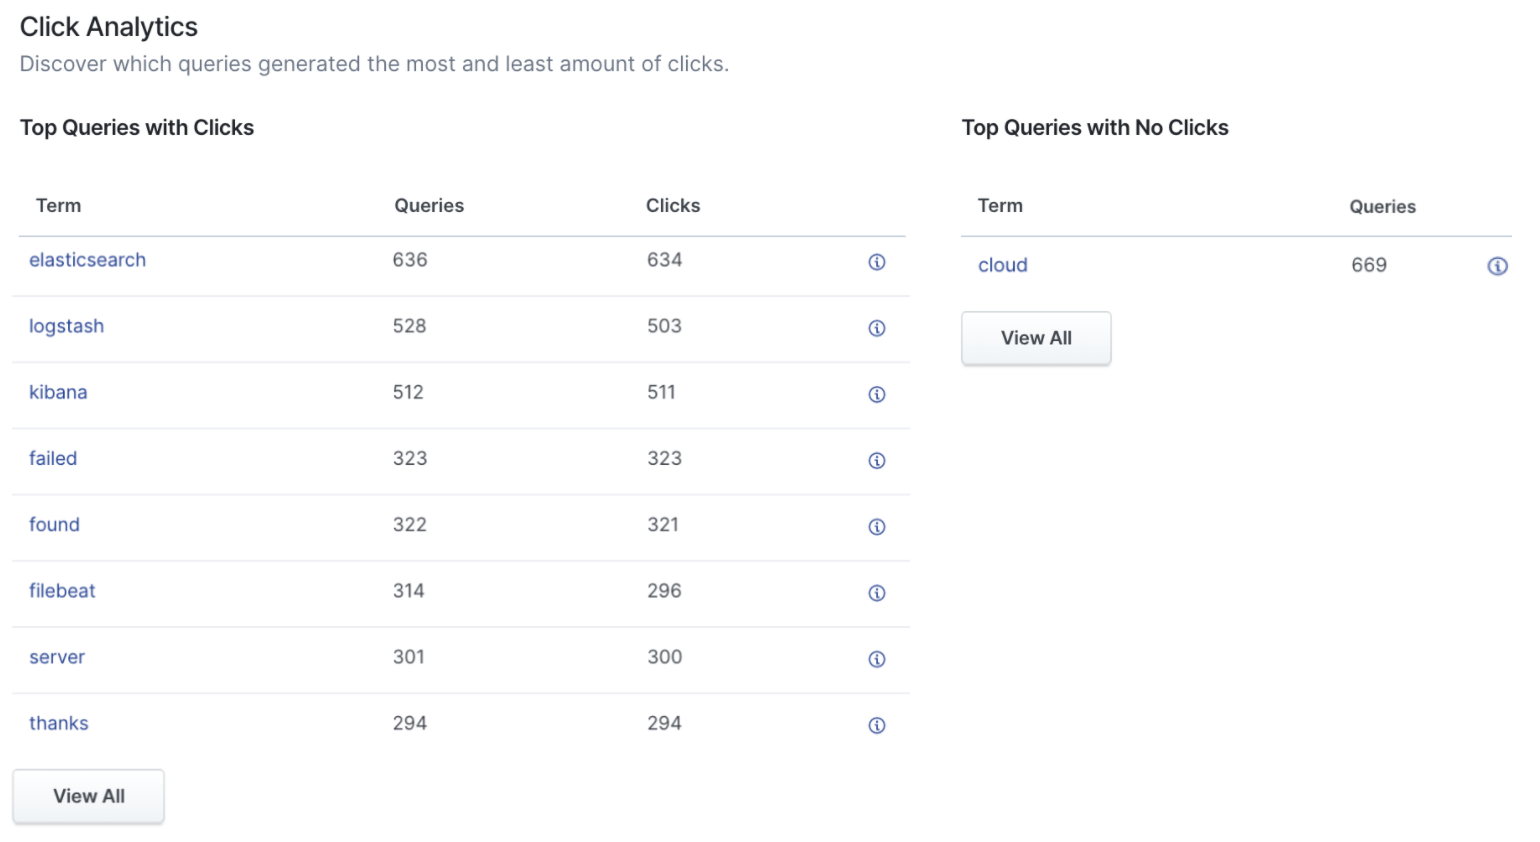
In this example, we see “cloud” is very popular with our users but isn’t generating clicks. This is a major issue since this (fictitious) company relies heavily on cloud products to drive their business.
Let’s address this issue using the Curations tool.
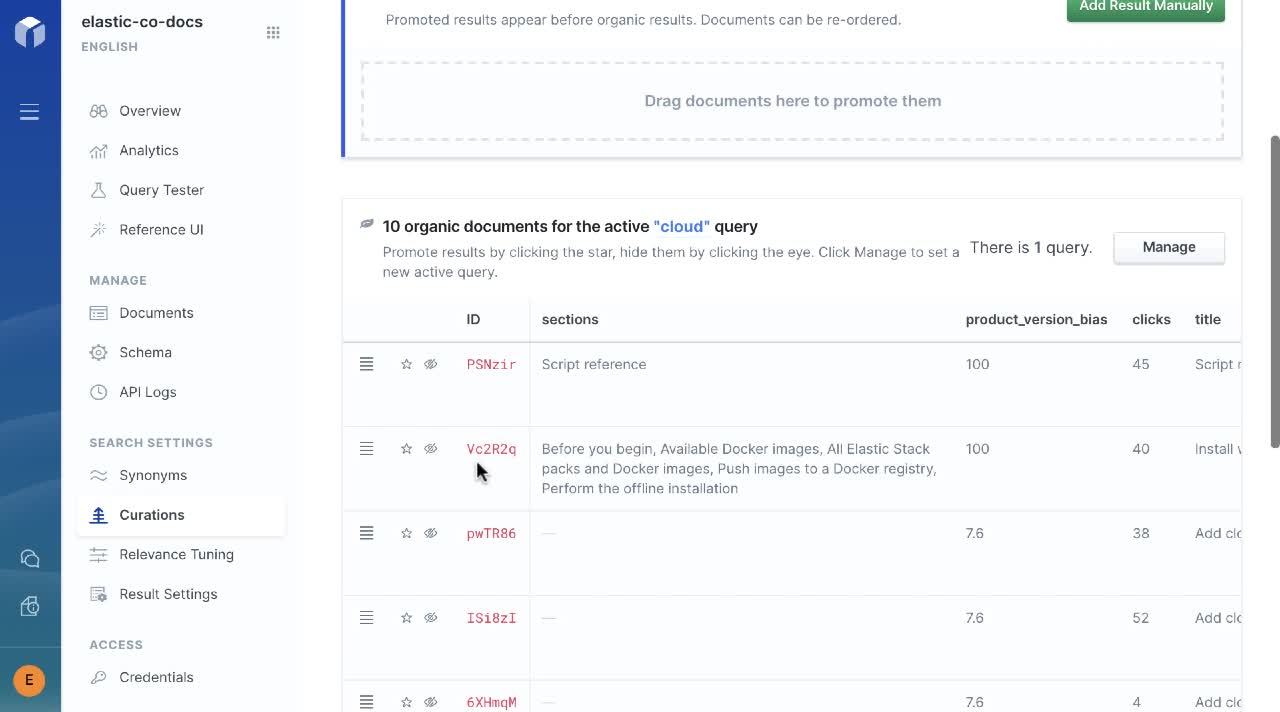
With Curations, users can promote search results before organic results and reorder the results on the page. Think of this as “manual override.” Users can overrule the Elasticsearch relevance engine built into App Search and curate the results unique to their needs.
Curations are helpful when you want more eyeballs on new products, product releases, or even sponsored results.
Recent Queries
The Recent Queries dashboard provides a snapshot view of queries happening right now on your site. With App Search, you can create multiple engines and meta engines (think of these as tools for cross-engine search) where your content is indexed. Recent Queries provides a near real-time look by engine or meta engine so you’re always looking at the most granular data.
Elastic App Search users have found Recent Queries to be an early warning sign for issues that may need addressing. For example, if “error code: 505” is rising to the top of Recent Queries, this may foretell error messages across your product that need a knowledge base article created quickly.
The power of Elasticsearch without the complexity
App Search is built on top of the Elastic Stack, so it inherits the speed, scale, and relevance millions of users rely on every day. But we’ve removed the complexity of customizing and tuning. In its place are easy-to-use sliders and drop-downs to make App Search more approachable and user friendly for admins, analysts, and content owners.
Getting started
Can’t get enough of the analytics talk? Sign up for a 14-day free trial of App Search or download the self-managed version to try it out yourself. Analytics inside App Search come standard across all Elastic subscription levels and regardless of deployment method (Cloud or self-managed). With the 7.7 release, both App Search and Workplace Search are now available as a single download.
Additional resources: