Pushing boundaries with Elastic Maps 7.10
Elastic Maps added several exciting features with the release of Kibana 7.10 that let you do even more with your location data. From making it easier to upload files with latitude and longitude fields to being able to trigger an alert when something moves across a boundary, there are a host of jaw droppingly cool new things to check out. I’ll be providing a good overview in this blog, but to see the real magic, I’d suggest:
- Watching me demonstrate these features in real time during our Elastic Maps webinar
- Trying it out for yourself by spinning up a free trial of Elasticsearch Service on Elastic Cloud
Now onto the good stuff!
Automatic ingest of latitude and longitude fields in file uploads
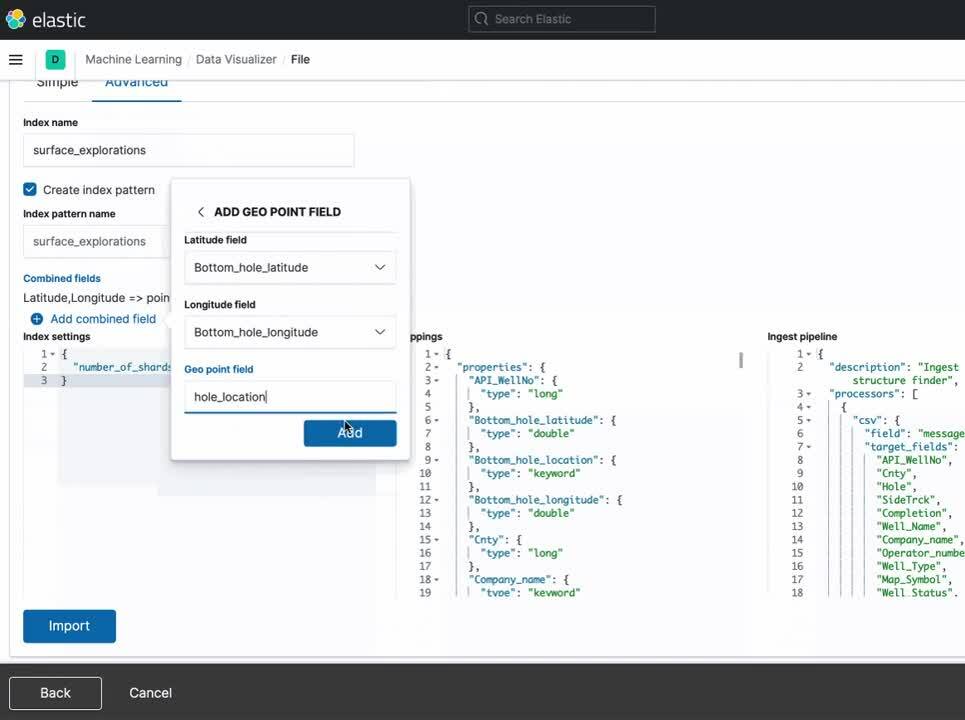
One of the most common formats for working with location data is a CSV, be it a download from an open data portal or a position log from a sensor. A hurdle new users sometimes face, is figuring out how to turn the latitude and longitude from their CSV into a geo_point. Elastic Maps needs a geo_point or geo_shape field type to work with documents that include point location data.
In 7.10, new users, experienced users, and geospatial analysts can rejoice! We enhanced the file ingest process so that lat/lon fields from files are automatically mapped for you and assigned the correct data type. What does this mean? Using the file upload interface for CSV data within the Machine Learning app, when a dataset includes fields named latitude and longitude, the ingest process will automatically combine the fields into a geo_point location field. No need to worry if your fields have unrecognized names -- you can use a simple interface to add the new field yourself. No hand-typed JSON required.
Vector tiles give you more data with more responsiveness
In 7.10, you also have the option within Elastic Maps to render layers using vector tiles. Vector tiles are a modern technique for delivering large amounts of data. The benefit is that your map will load faster and interacting with your data will feel fast and fluid. Using vector tiles allows you to extend what is possible in the Elastic Maps app.For example, with clusters and grids there is a new “super fine” option, allowing you to see even more detail in your dataset. Also, the document limit imposed by Elasticsearch is now per tile. If you are accustomed to working with 10,000 documents in total, now you can work with 10,000 documents per tile! The number of tiles will vary depending on zoom level; but the impact is the same — more data for you to explore and analyze.
Easy to author, build, and edit maps
Dashboards are in their most powerful form when they have the right context and level of interactivity. In 7.10, it’s now easier to add and edit Elastic Maps in a Kibana dashboard. In the flow of building a dashboard, you can now add a map panel that is new or existing, edit said map, and return to your dashboard using Save and Return. You can also add more ways to explore geographic context using drilldowns, which are now supported with Elastic Maps.
That’s not all. We have added an option to automatically fit the data on your map on screen. This option lets the data drive exploration of the map, triggered by filters and data refreshes.
Transition Notice: Region maps and coordinate maps migrate to the Elastic Maps app
Looking to the future, in 8.0, Kibana will migrate region map and coordinate map visualizations to Elastic Maps. Our goal is to provide a superior user experience with features that are only available in the Elastic Maps app, such as adding multiple layers and indices, plotting individual documents, symbolizing features from data values, rendering vector tiles from Elastic Maps Service, and more. We want all of our users to have access to these features and avoid confusion about which application to use when viewing geospatial data.
When the time comes, we’ll make it easy to automatically migrate region maps and coordinate maps to Elastic Maps with the 8.0 upgrade assistant. To get a preview of this migration, 7.10 adds a “View in Maps” button to region maps and coordinate maps. Click “View in Maps” to view your region or coordinate map in Elastic Maps and to start using it today.
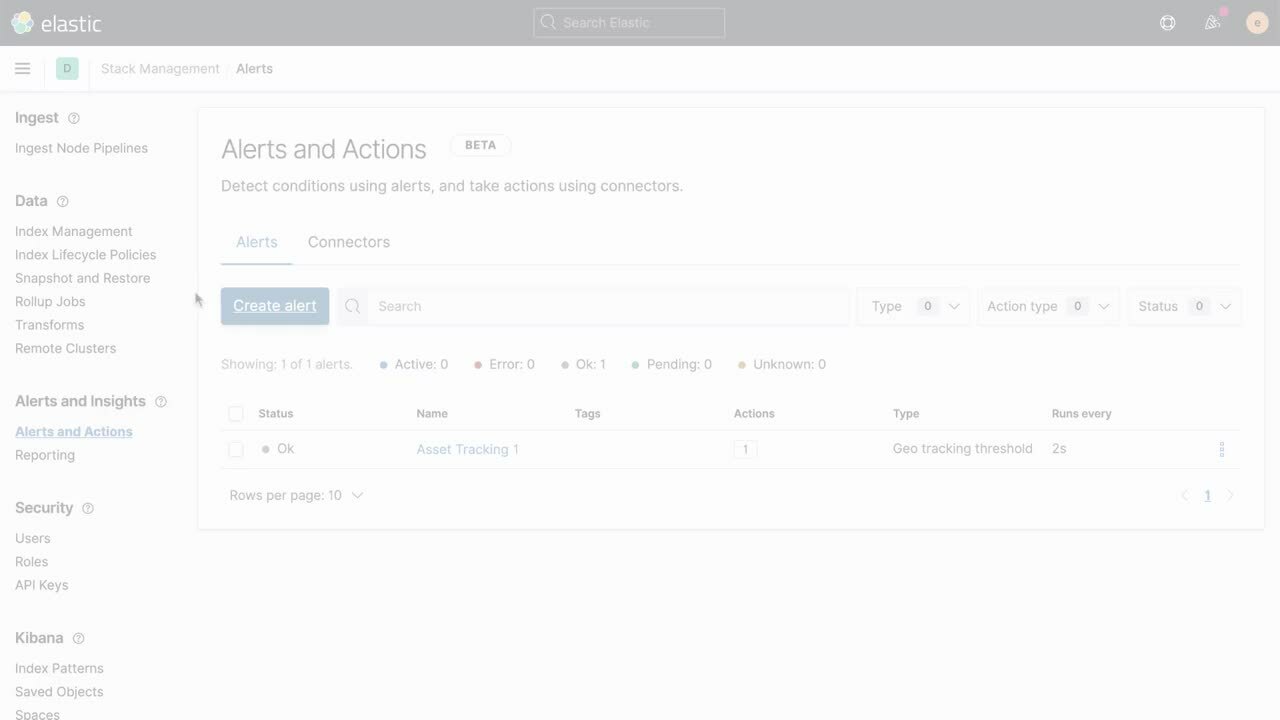
New location-based alerts for Elastic Maps (beta) - your feedback requested
Kibana 7.10 includes a new location-driven alert called “tracking threshold.” This alert allows you to track the location of an entity and trigger an alert action (like add a document to an index or send a Slack notification) when the entity enters a boundary. This beta feature can be turned on by editing your kibana.dev.yml file and adding the following modification:
xpack.trigger_actions_ui.enableGeoTrackingThresholdAlert: true
We are hoping to promote the tracking threshold location alert feature to generally availability in the near term, but a critical part of doing that is getting great user feedback. This feedback is vital to helping us validate feature choices and ensuring that we continue to build useful and productivity-enhancing capabilities for our customers. Feedback for this and anything related to geospatial data and analysis can be sent directly to me at kent.marten@elastic.co
See these new Elastic Maps features in action
Join us on December 10 at 9 a.m. PST for a live webinar where we will be walking through each of these new Elastic Maps features as part of a series of real time demonstrations. (And if you miss the live webinar, feel free to register for the on-demand replay!) Bring your mapping queries as well and ask them as part of the question and answer session.
But you don’t have to wait to get hands on with these new capabilities. It only takes 3 minutes to get up and running with a free trial of Elasticsearch Service on Elastic Cloud. So if you’re excited to test these 7.10 Elastic Maps features out, be sure to take advantage of the best SaaS service for running hosted Elastic Stack.