Drilldowns
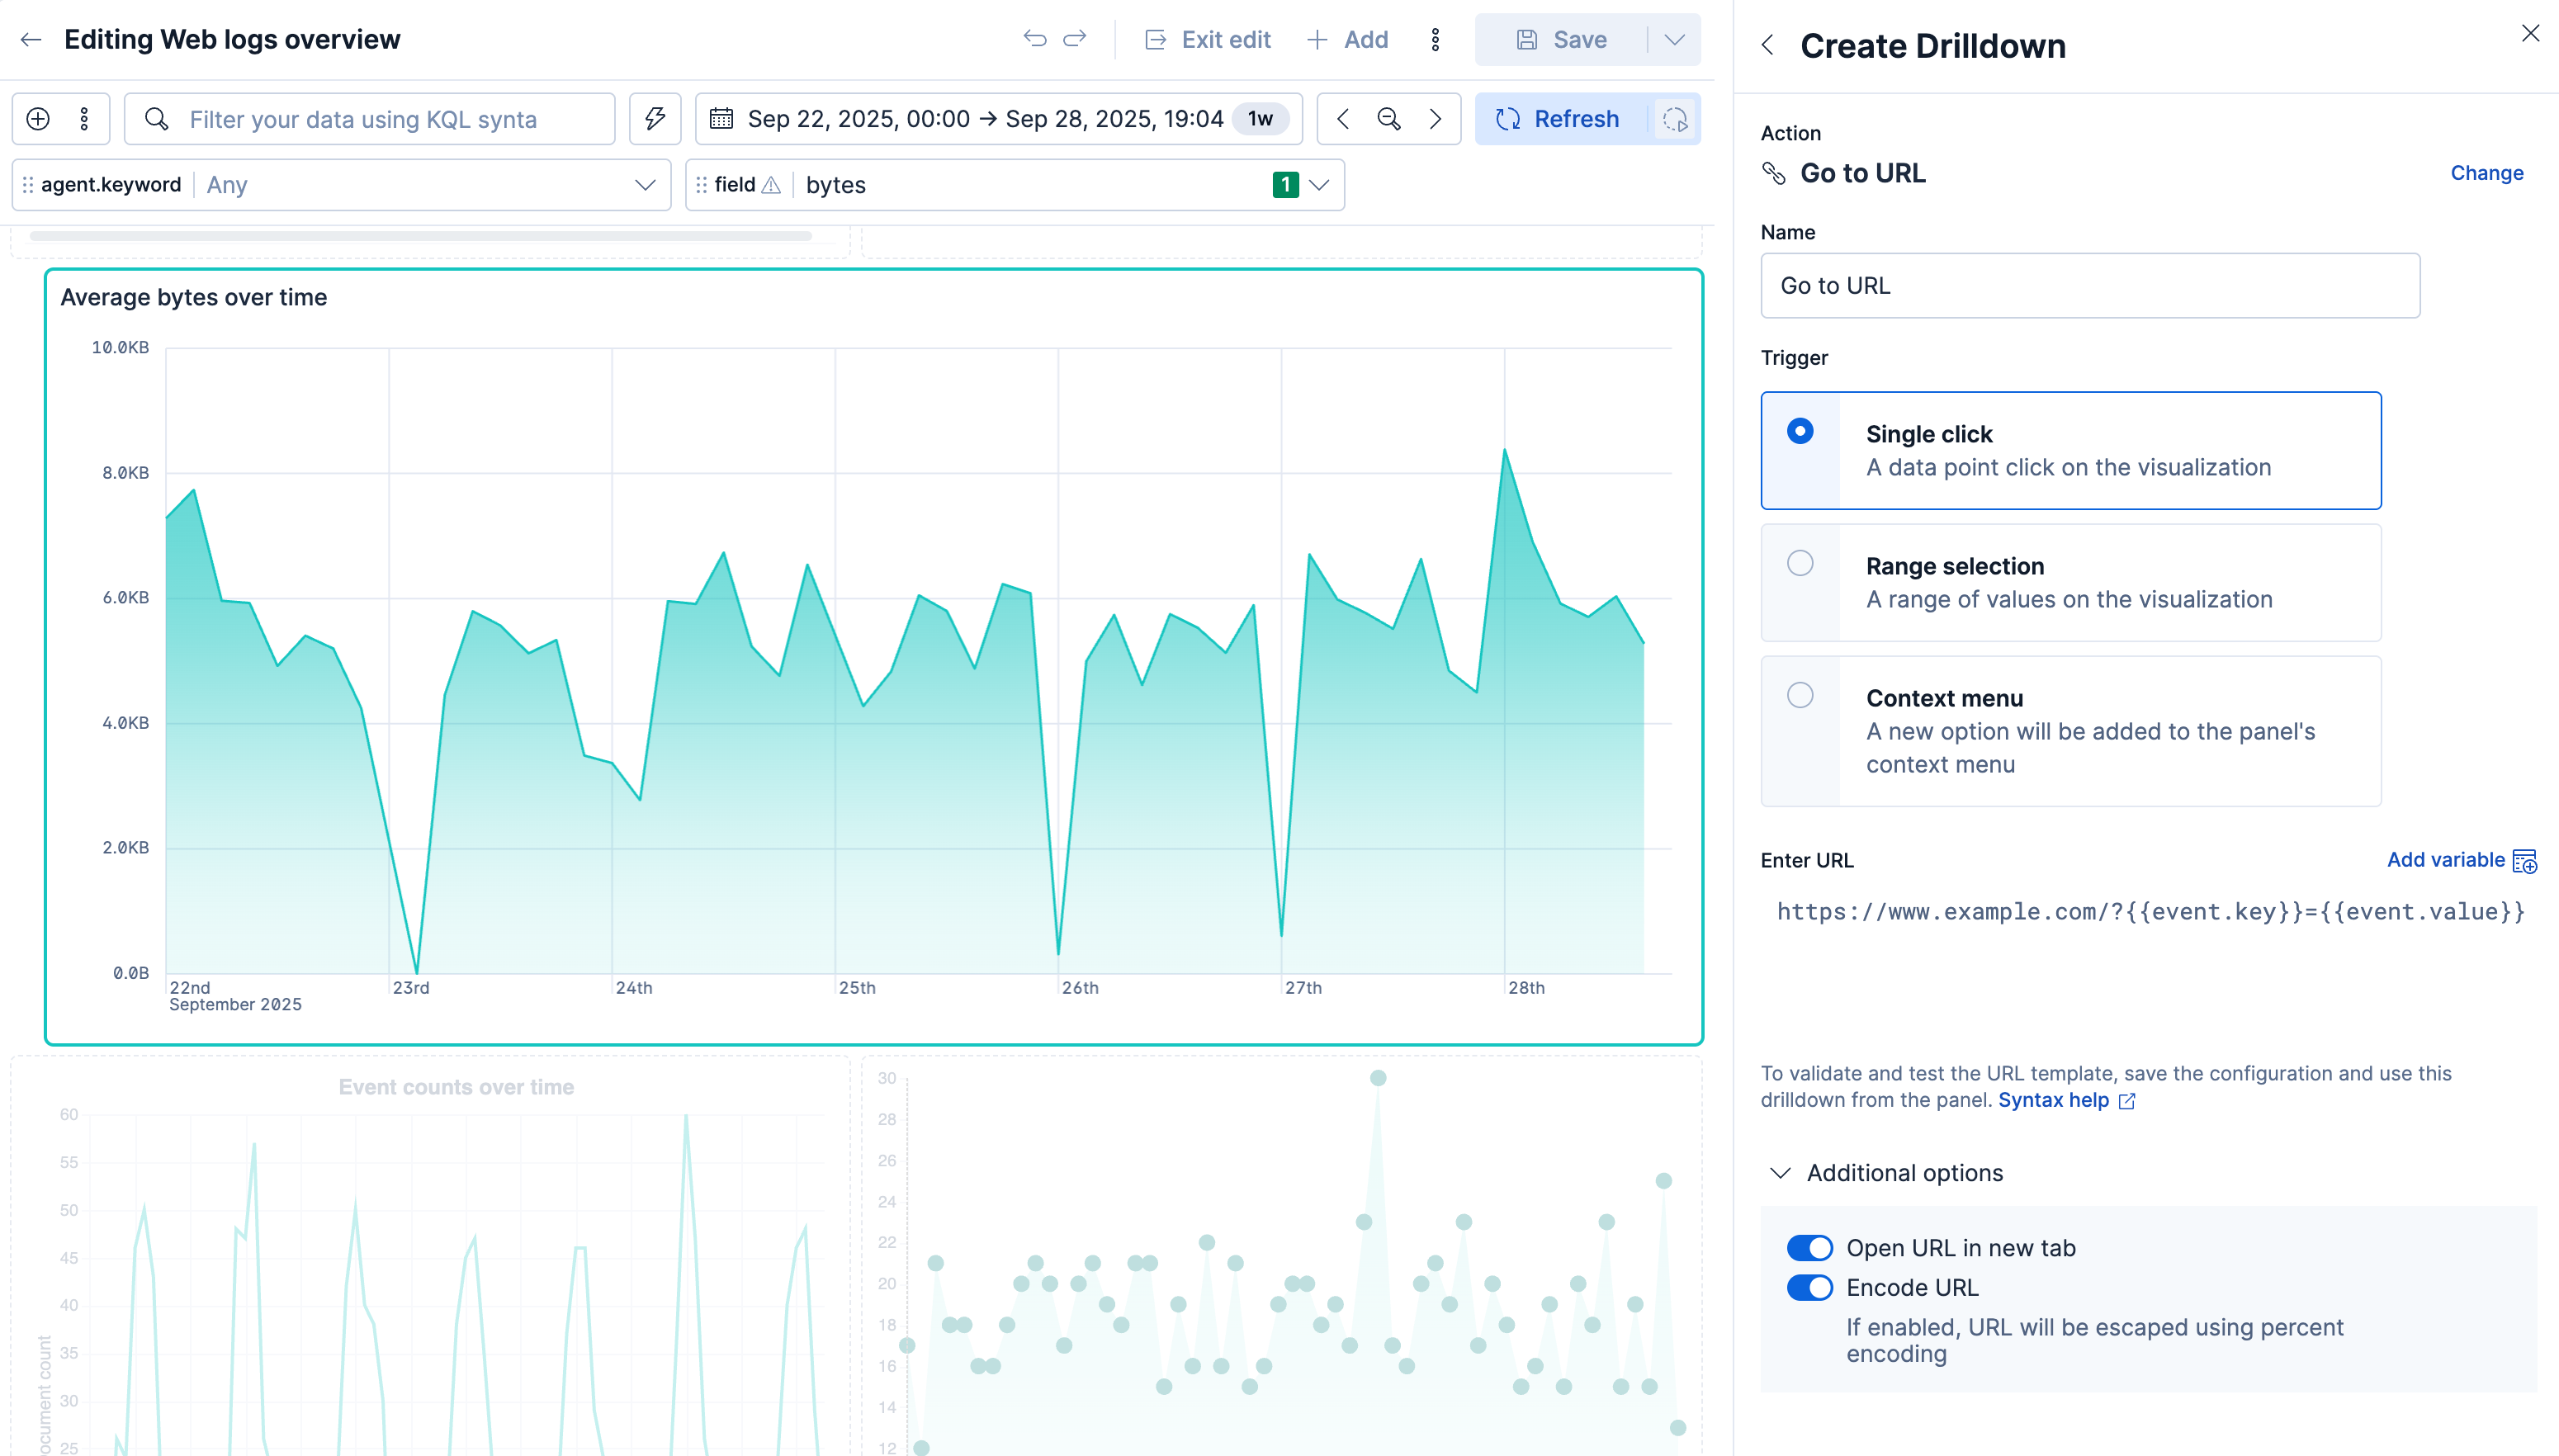
A drilldown is a navigation action on a dashboard panel. When you select a value, it opens a destination you define: another dashboard, a URL, or Discover.
The destination keeps the context of that selection. That includes the value you selected, the filters on the dashboard, and the time range.
Selecting a value can also filter the dashboard you have open, for example when you select a slice or drag a time range. Add a drilldown when you want that same selection to open another view.
You can add three types of drilldown:
- Dashboard: Open another dashboard from a panel. For example, open a host dashboard from a summary dashboard, with a filter for the host name you selected.
- URL: Open a website from a panel. For example, open a search page that includes the host name you selected.
- Discover: Open Discover from a visualization panel. For example, open the documents for one slice of a pie chart.
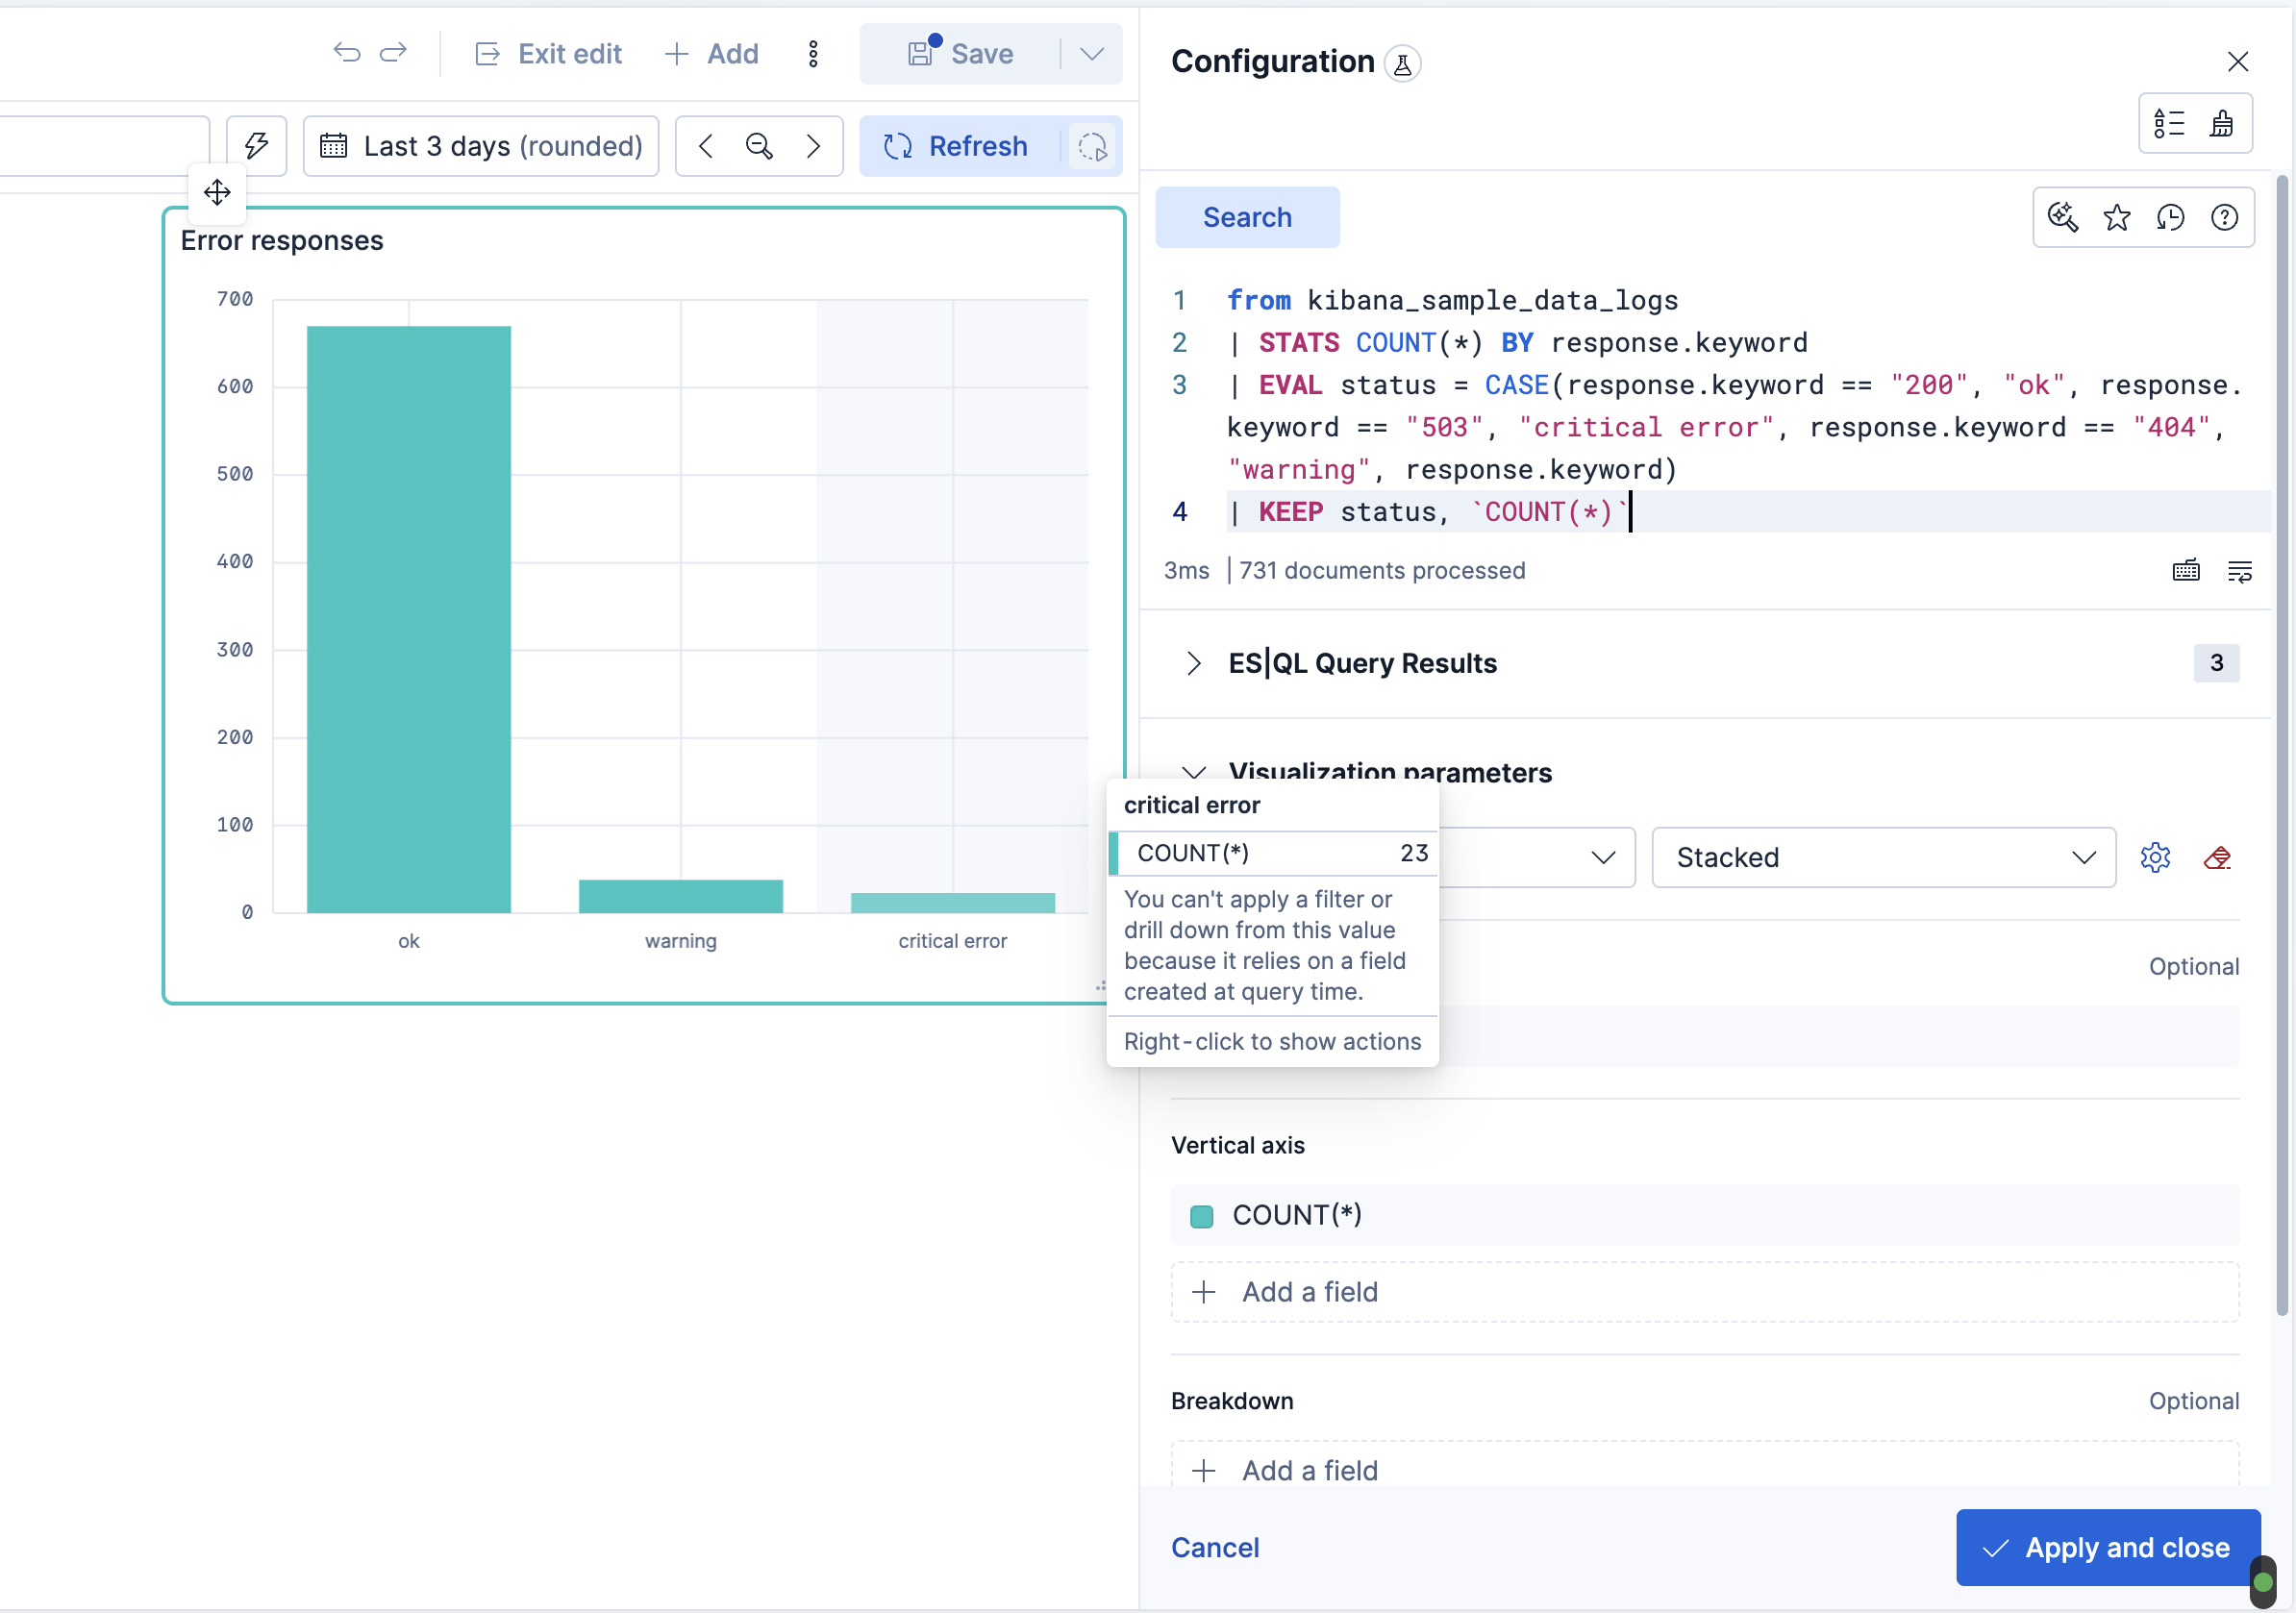
A drilldown uses a value from a field in the data source. You cannot filter or open a drilldown from a value created at query time, because that value has no field in the index. This includes a Lens formula, an aggregation result, and an ES|QL EVAL or STATS result.
ES|QL example
In the following query, status does not exist in the index. The query creates status from response.keyword. For that reason, you cannot filter or open a drilldown from status in the resulting visualization.
FROM kibana_sample_data_logs
| STATS COUNT(*) BY response.keyword
| EVAL status = CASE(
    response.keyword == "200", "ok",
    response.keyword == "503", "critical error",
    response.keyword == "404", "warning"
  )
| KEEP status, `COUNT(*)`
From this version, you can filter and open a drilldown when the query gives an index field a new name.
Assign the new name in the
BYclause ofSTATS.STATS count(*) BY host = hostnameRename the field with the
RENAMEcommand.RENAME hostname AS host
For more information about filter pills, refer to Add pills by interacting with visualizations.