Monitoring Google Cloud with the Elastic Stack and Google Operations
Google Operations suite, formerly Stackdriver, is a central repository that receives logs, metrics, and application traces from Google Cloud resources. These resources can include compute engine, app engine, dataflow, dataproc, as well as their SaaS offerings, such as BigQuery. By shipping this data to Elastic, you’ll get a unified view of the performance of resources across your entire infrastructure from cloud to on-prem.
In this blog, we will set up a pipeline to stream data from Google Operations to the Elastic Stack so you can start monitoring Google Cloud logs alongside your other observability data. For this demo, we'll use the Filebeat Google Cloud module to ship your Google Cloud data to a free trial of Elastic Cloud for analysis. I encourage you to follow along!
High-level data flow
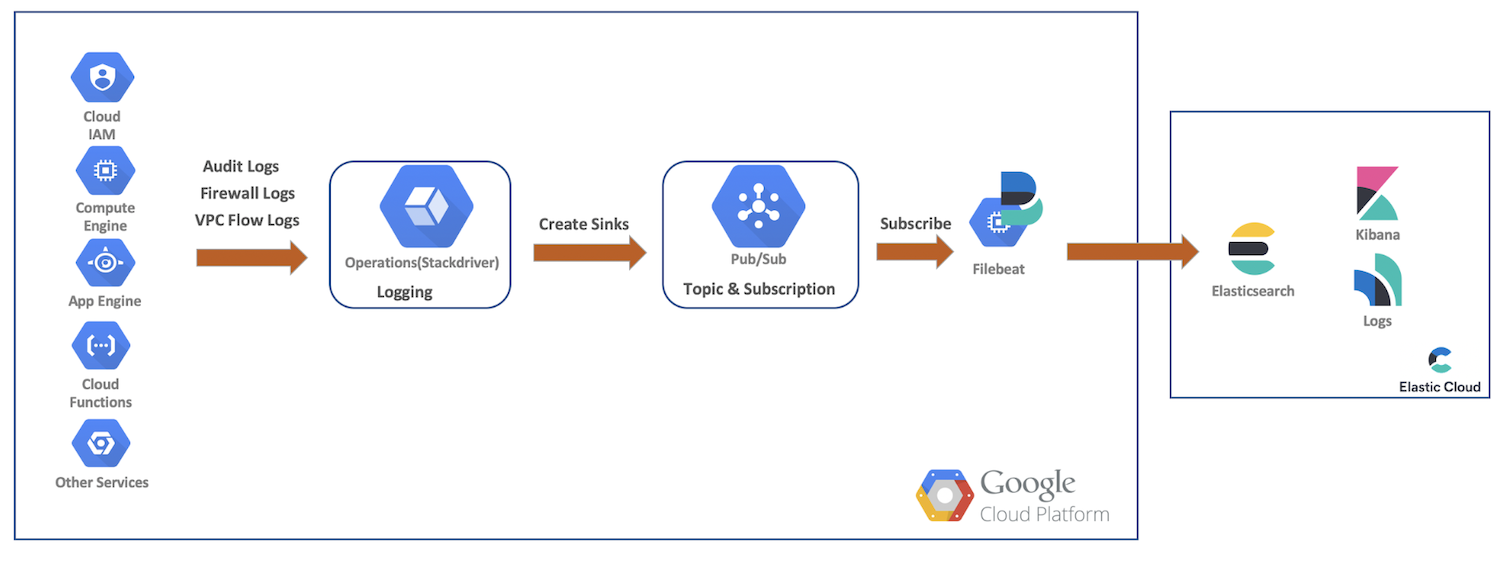
For this demo, we’ll ship audit, firewall, and VPC flow logs from Google Cloud resources to Google Cloud Operations. From there, we’ll create sinks, Pub/Sub topics, subscribe as Filebeat, and ship our data to Elastic Cloud for further analysis with Elasticsearch and Kibana. This diagram provides a high-level flow showing the path the data will take into our cluster:
Google Cloud logging setup and configurations
Google Cloud provides a rich UI to enable logs for services, while the logs get configured in their respective consoles. In these next steps, we'll enable multiple logs, create our sinks and topics, and then set up our service account and credentials.
VPC flow logs
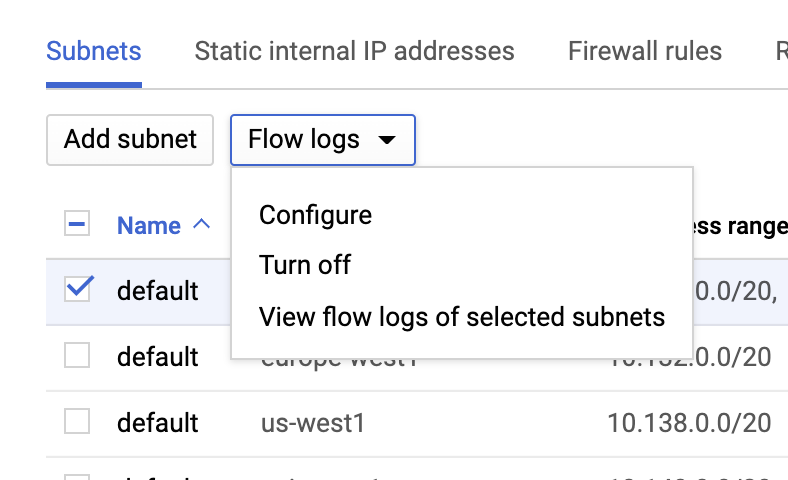
VPC flow logs can be enabled by going to the VPC network page, selecting a VPC, and clicking Configure from the Flow logs dropdown:
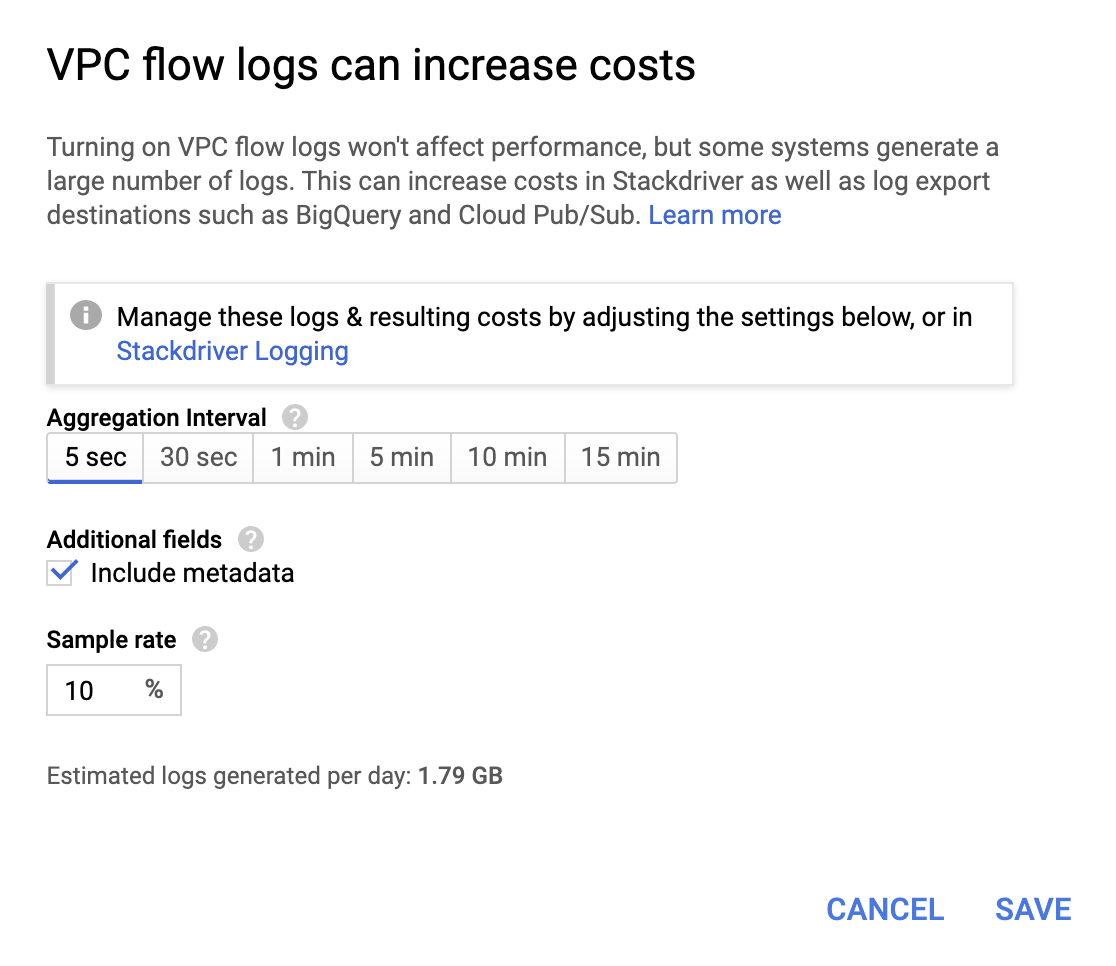
Though they're not very expensive, operations do add to the bill, so choose an aggregation interval and sample rate based on your requirements.
Audit logs
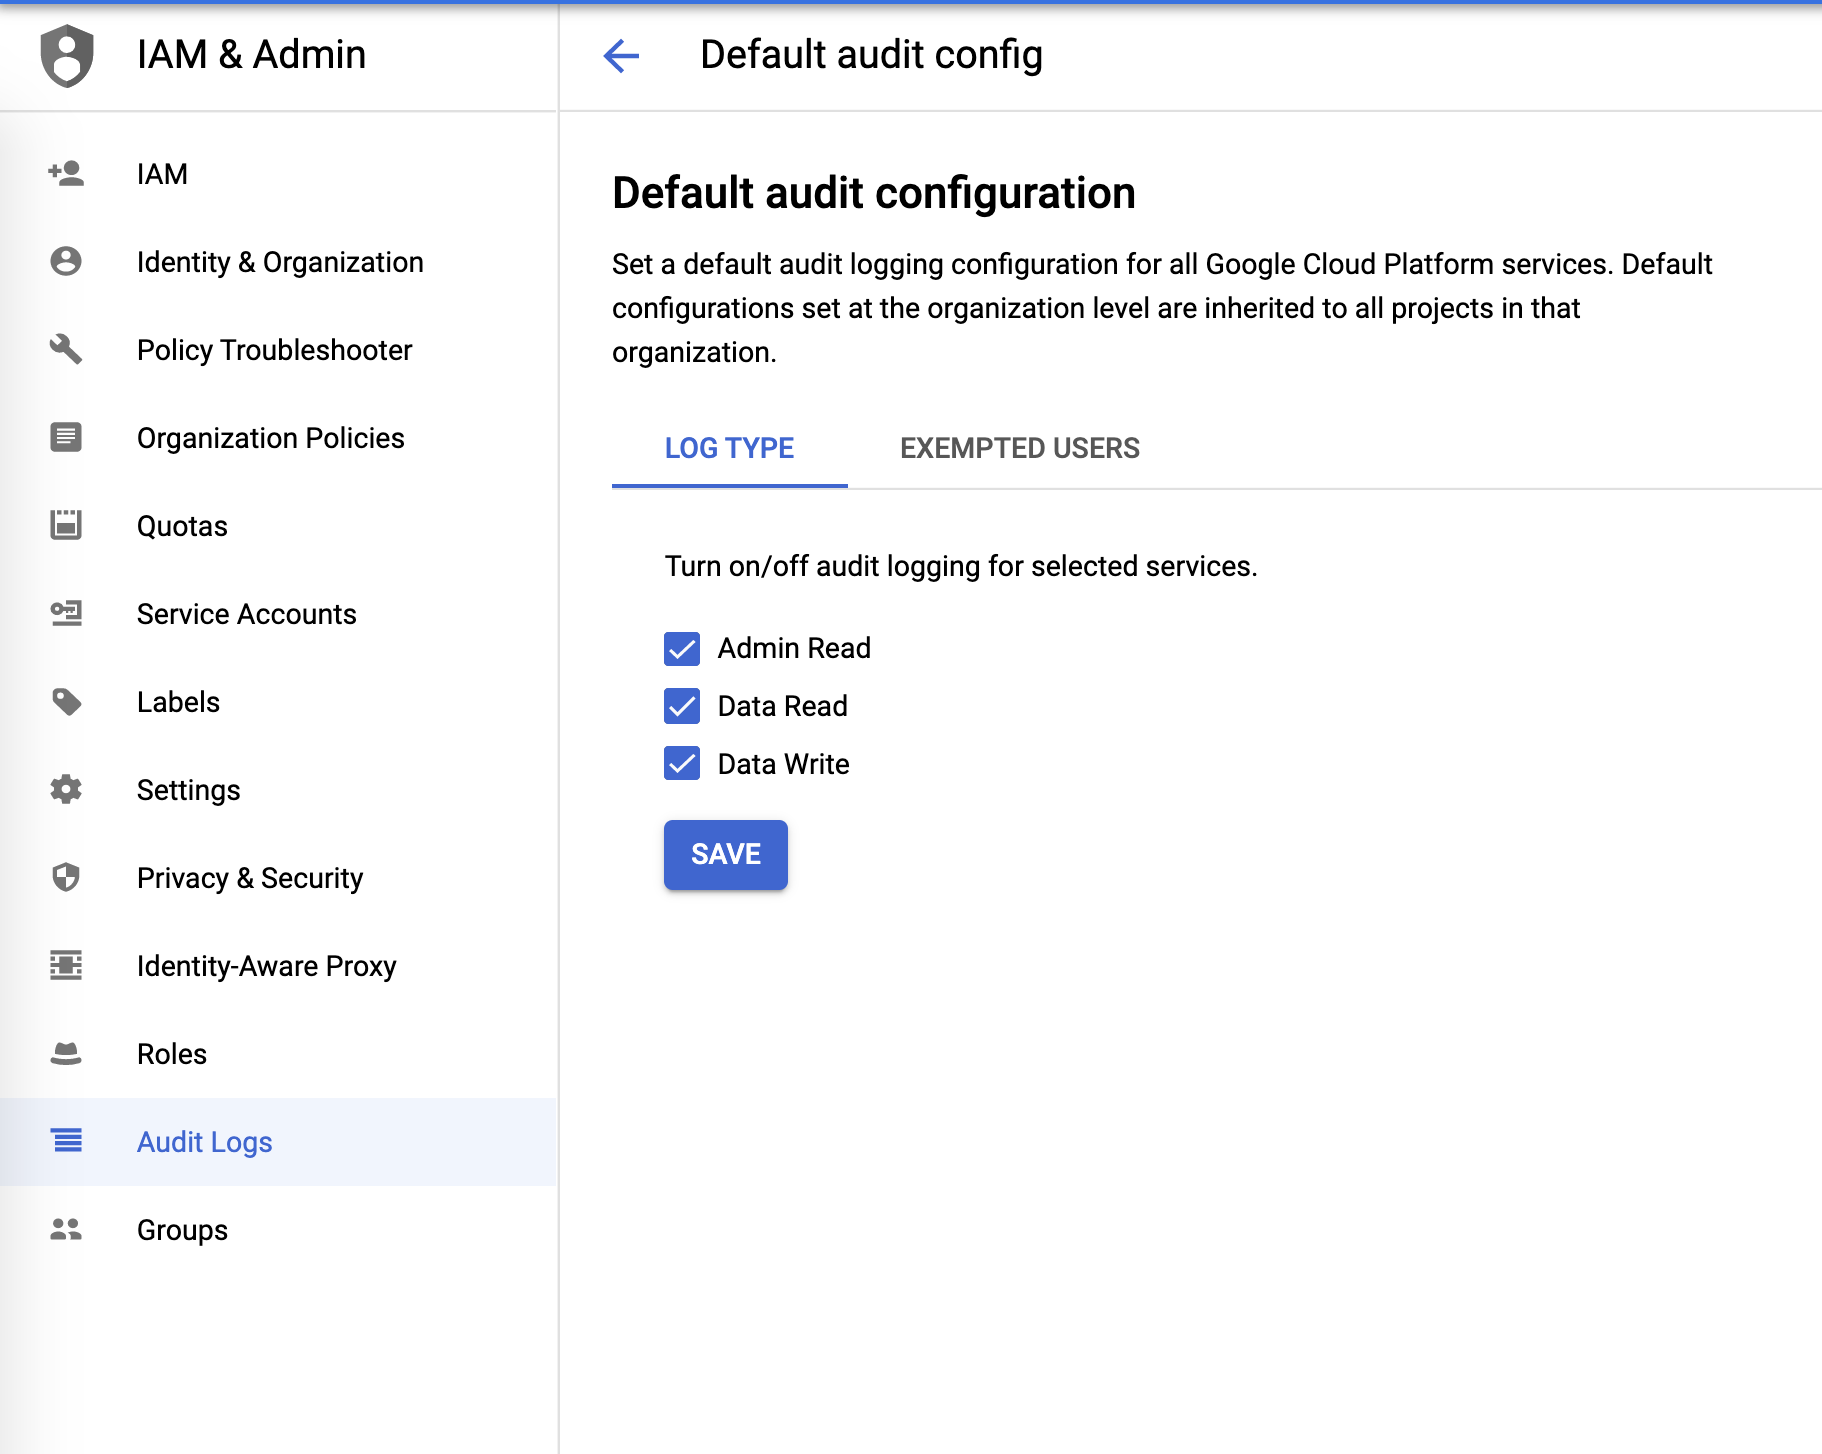
Audit logs can be configured from the IAM & Admin menu:
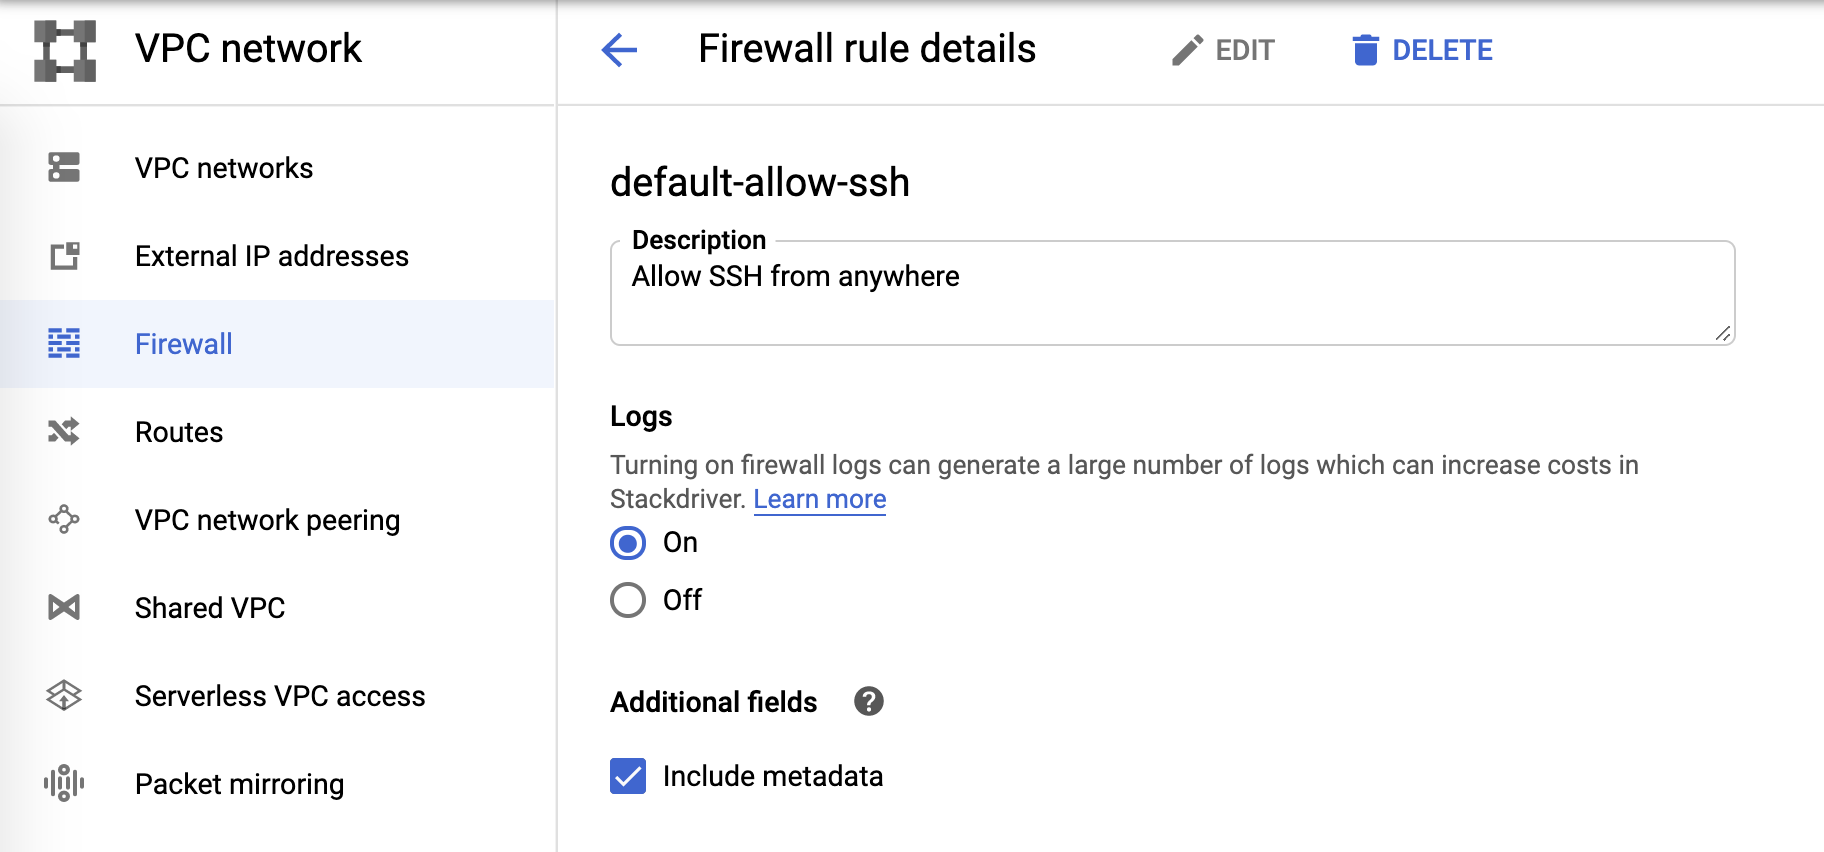
Firewall logs
And, finally, firewall logs can be controlled from firewall rules:
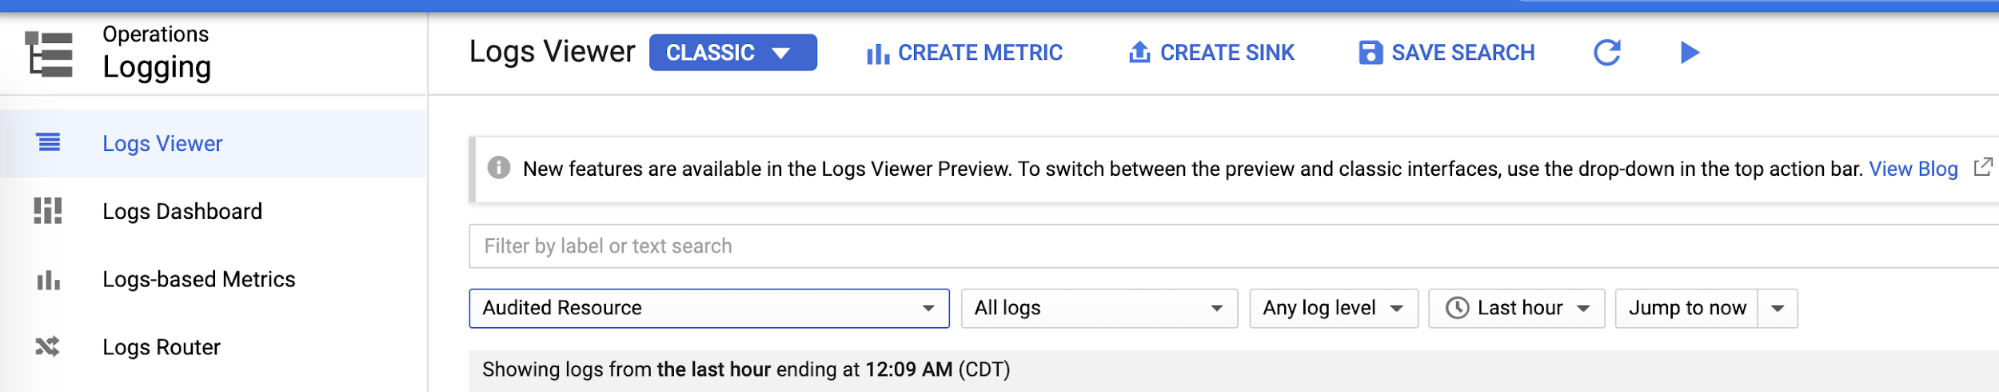
Log sink and Pub/Sub
Once we've configured the individual logging areas we can create sinks for each of the logs from the Logs Viewer:
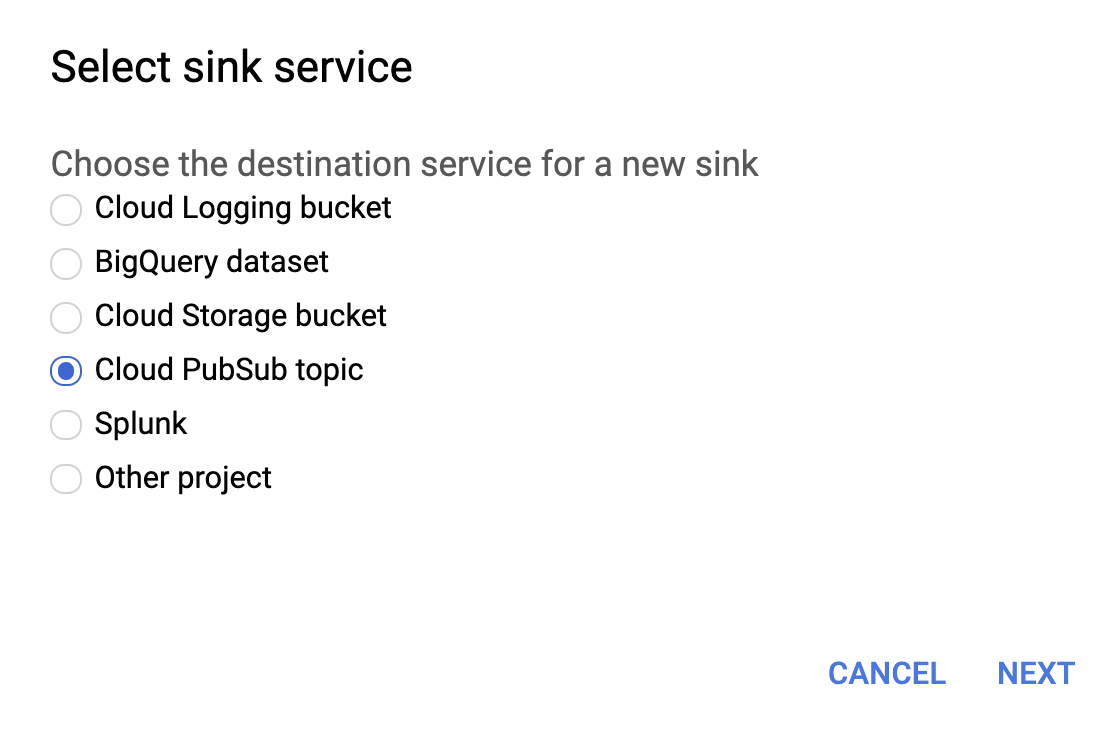
Select Cloud PubSub topic for sink service as shown below.
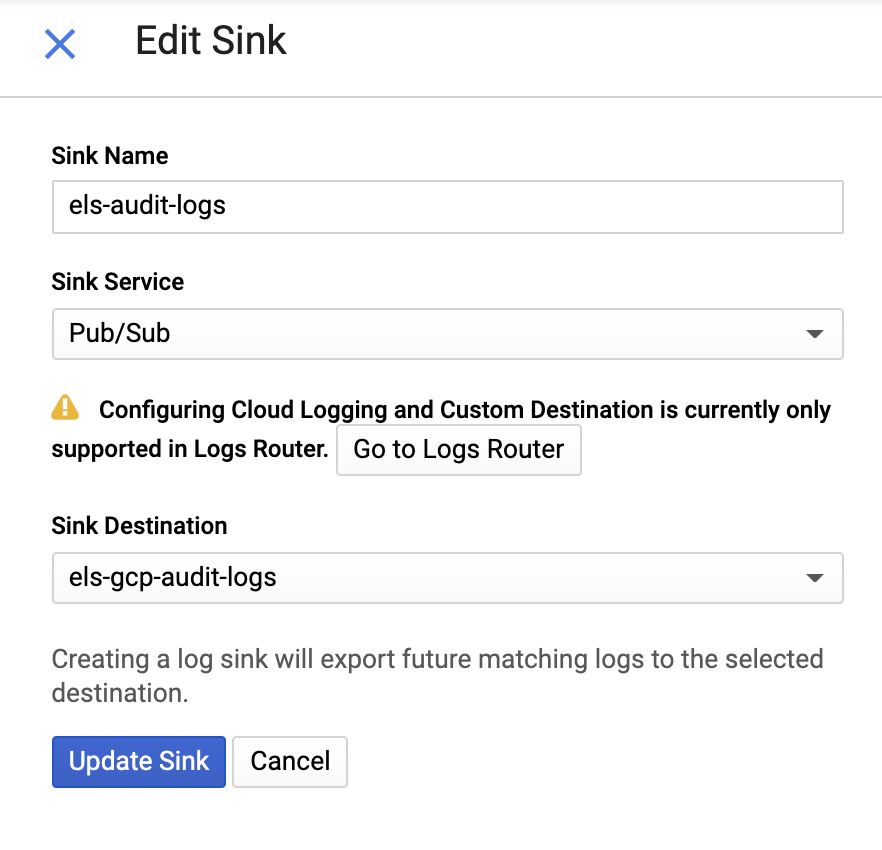
And then provide a name for the sink and a Pub/Sub Topic — you can send it to an existing topic or create a new one:
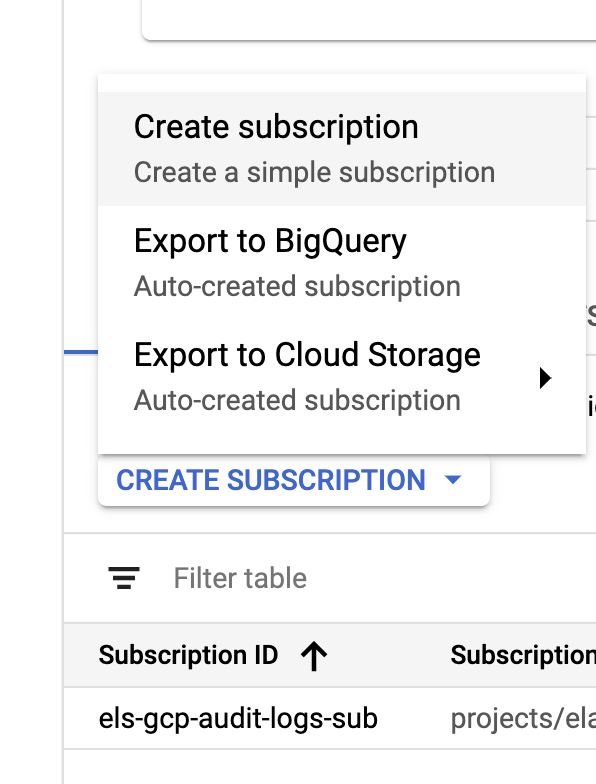
Once our sink and topics are created, it's time to create the Pub/Sub topic subscriptions:
 | 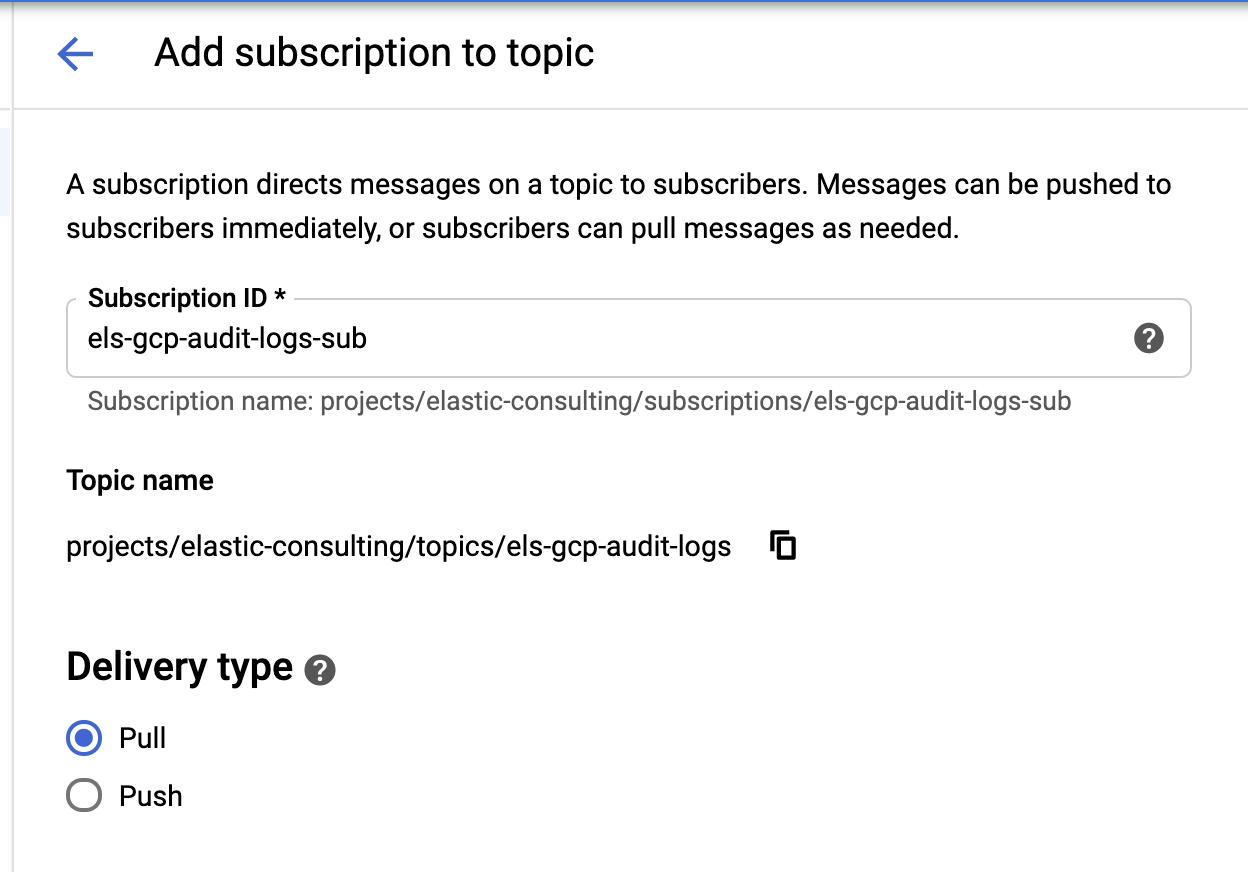 |
Configure the subscription based on your requirements.
Service account and credentials
Last but not least, let's create a service account and credentials file.
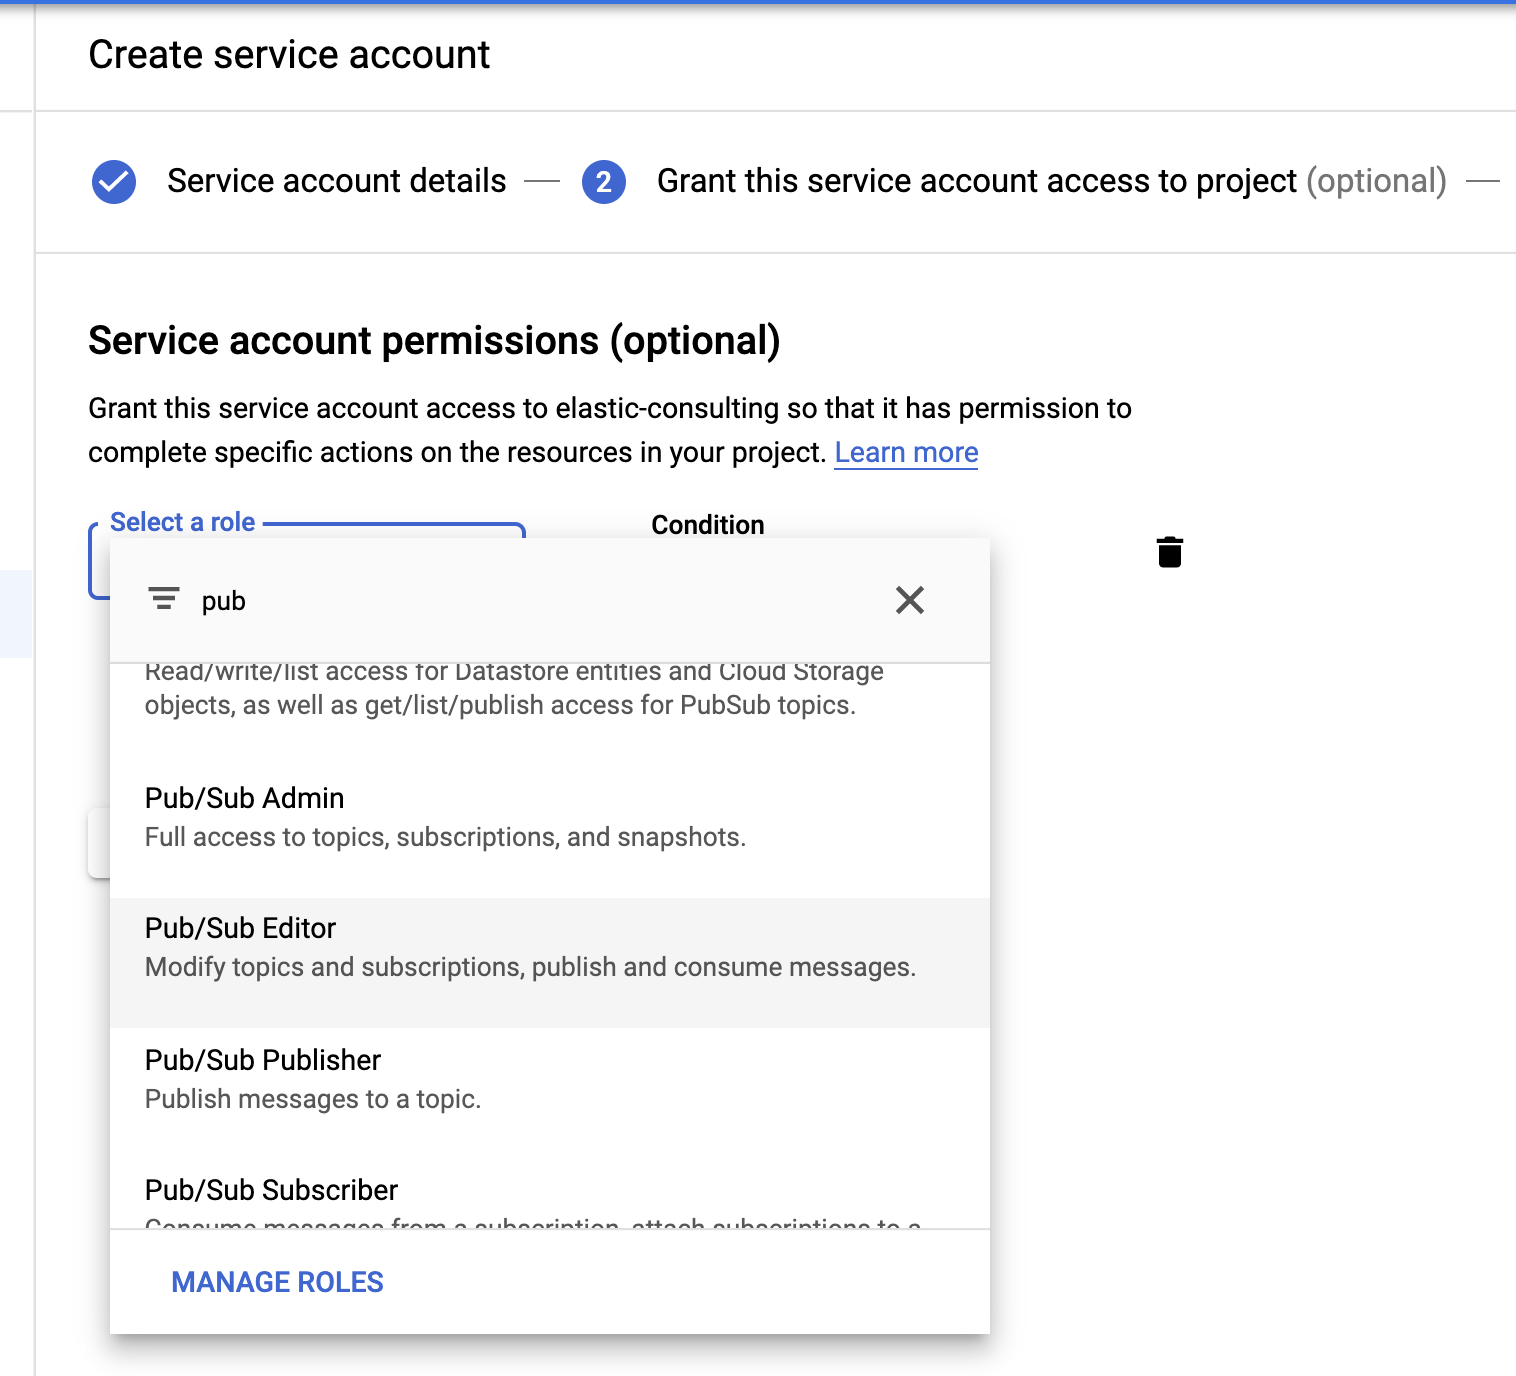
Select the Pub/Sub Editor role; condition is optional and can be used to filter the topics.
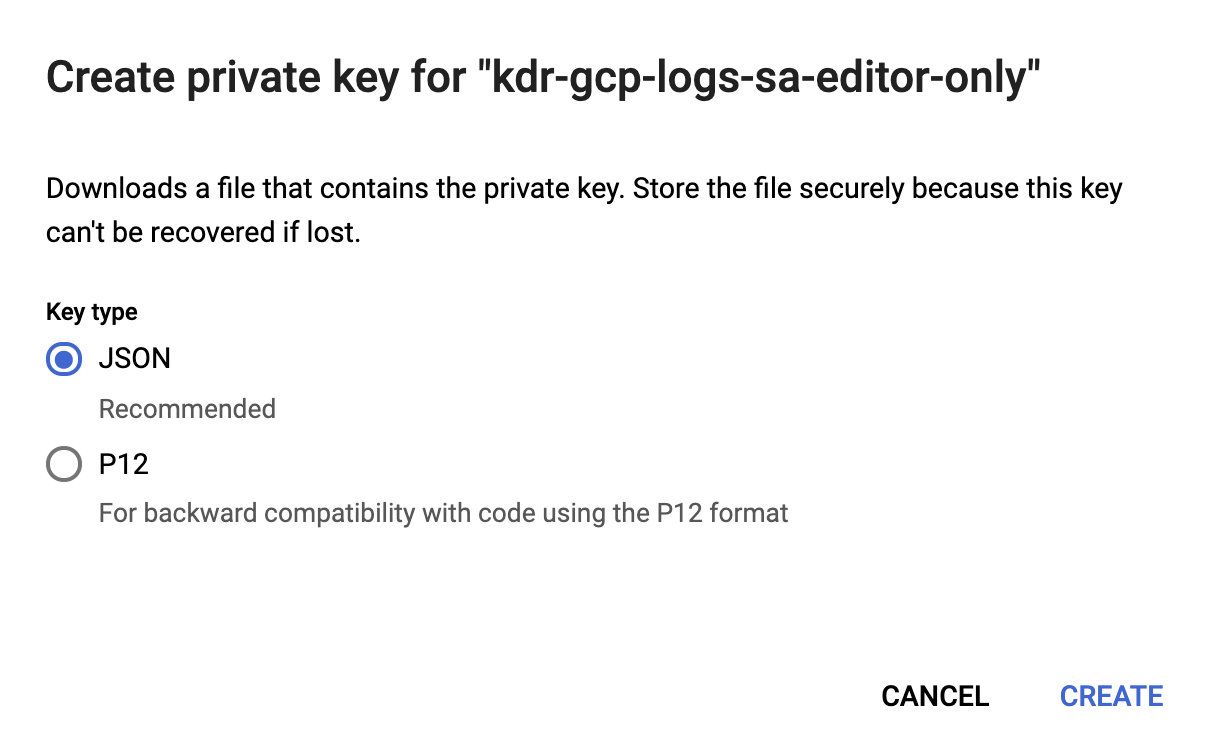
Once the service account is created, we’ll generate a JSON key that will be uploaded to the Filebeat host and stored in the Filebeat config directory, /etc/filebeat. This key will be used by Filebeat to authenticate as the service account.
Now our Google Cloud configuration is complete.
Install and configure Filebeat
Filebeat is used to pick up the logs and ship them to our Elasticsearch cluster. We'll be using CentOS for this blog, but Filebeat can be installed based on your operating system by following these simple steps in our Filebeat documentation.
Enable the Google Cloud module
Once Filebeat is installed, we'll need to enable the googlecloud module:
filebeat modules enable googlecloud
Copy the JSON credentials file that we created earlier to /etc/filebeat/, then modify /etc/filebeat/modules.d/googlecloud.yml file to make it match your Google Cloud setup.
Some of the configurations are done for you; for example, all three modules are listed and all required configurations are keyed in — you just need to update those for values based on your setup.
# Module: googlecloud
# Docs: https://www.elastic.co/guide/en/beats/filebeat/7.9/filebeat-module-googlecloud.html
- module: googlecloud
  vpcflow:
    enabled: true
    # Google Cloud project ID.
    var.project_id: els-dummy
    # Google Pub/Sub topic containing VPC flow logs. Stackdriver must be
    # configured to use this topic as a sink for VPC flow logs.
    var.topic: els-gcp-vpc-flow-logs
    # Google Pub/Sub subscription for the topic. Filebeat will create this
    # subscription if it does not exist.
    var.subscription_name: els-gcp-vpc-flow-logs-sub
    # Credentials file for the service account with authorization to read from
    # the subscription.
    var.credentials_file: /etc/filebeat/kdr-gcp-logs-sa-editor-only.json
  firewall:
    enabled: true
    # Google Cloud project ID.
    var.project_id: els-dummy
    # Google Pub/Sub topic containing firewall logs. Stackdriver must be
    # configured to use this topic as a sink for firewall logs.
    var.topic: els-gcp-firewall-logs
    # Google Pub/Sub subscription for the topic. Filebeat will create this
    # subscription if it does not exist.
    var.subscription_name: els-gcp-firewall-logs-sub
    # Credentials file for the service account with authorization to read from
    # the subscription.
    var.credentials_file: /etc/filebeat/kdr-gcp-logs-sa-editor-only.json
  audit:
    enabled: true
    # Google Cloud project ID.
    var.project_id: els-dummy
    # Google Pub/Sub topic containing audit logs. Stackdriver must be
    # configured to use this topic as a sink for firewall logs.
    var.topic: els-gcp-audit-logs
    # Google Pub/Sub subscription for the topic. Filebeat will create this
    # subscription if it does not exist.
    var.subscription_name: els-gcp-audit-logs-sub
    # Credentials file for the service account with authorization to read from
    # the subscription.
    var.credentials_file: /etc/filebeat/kdr-gcp-logs-sa-editor-only.json
Finally, configure Filebeat to point to your Kibana and Elasticsearch endpoints.
You can set setup.dashboards.enabled: true in your filebeat.yml file to load a prebuilt dashboard for Google Cloud, as per the Kibana and Elasticsearch endpoint documentation.
As a side note, Filebeat offers a wide variety of modules with prebuilt dashboards. We're only looking at the Google Cloud module in this post, but I'd encourage you to explore the other available Filebeat modules to see what might be useful to you.
Start Filebeat
Finally, we can start Filebeat and add in the -e flag so it simply logs output to the console:
sudo service filebeat start -e
Exploring your data in Kibana
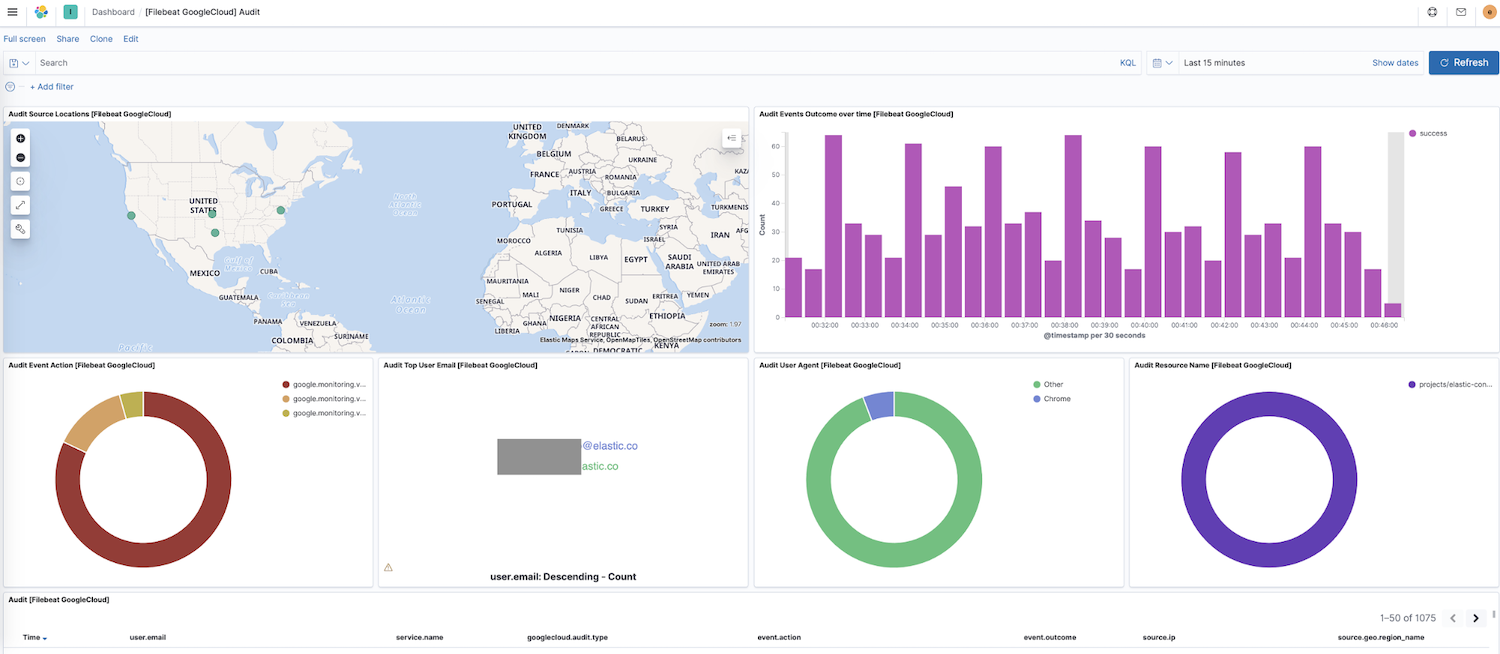
Now that Filebeat is shipping data to your cluster, let's navigate to Dashboard in the Kibana side navigation — if you have dashboards for other modules you can search for google to find the dashboards for our newly enabled module. In this case, we see the Google Cloud "Audit" dashboard.
In this dashboard, you'll see visualizations like a dynamic map of source locations, event outcomes over time, a breakdown of event actions, and more. Exploring your log data is intuitive with these prebuilt, interactive visualizations. If you’re setting up Filebeat for the first time or you’re running an older version of the Elastic Stack (the Google Cloud module went GA in 7.7), you will need to load dashboards by following these instructions.
Additionally, Elastic provides an observability solution with a log monitoring app. Log indices can be configured; default values are filebeat-* and logs-*.
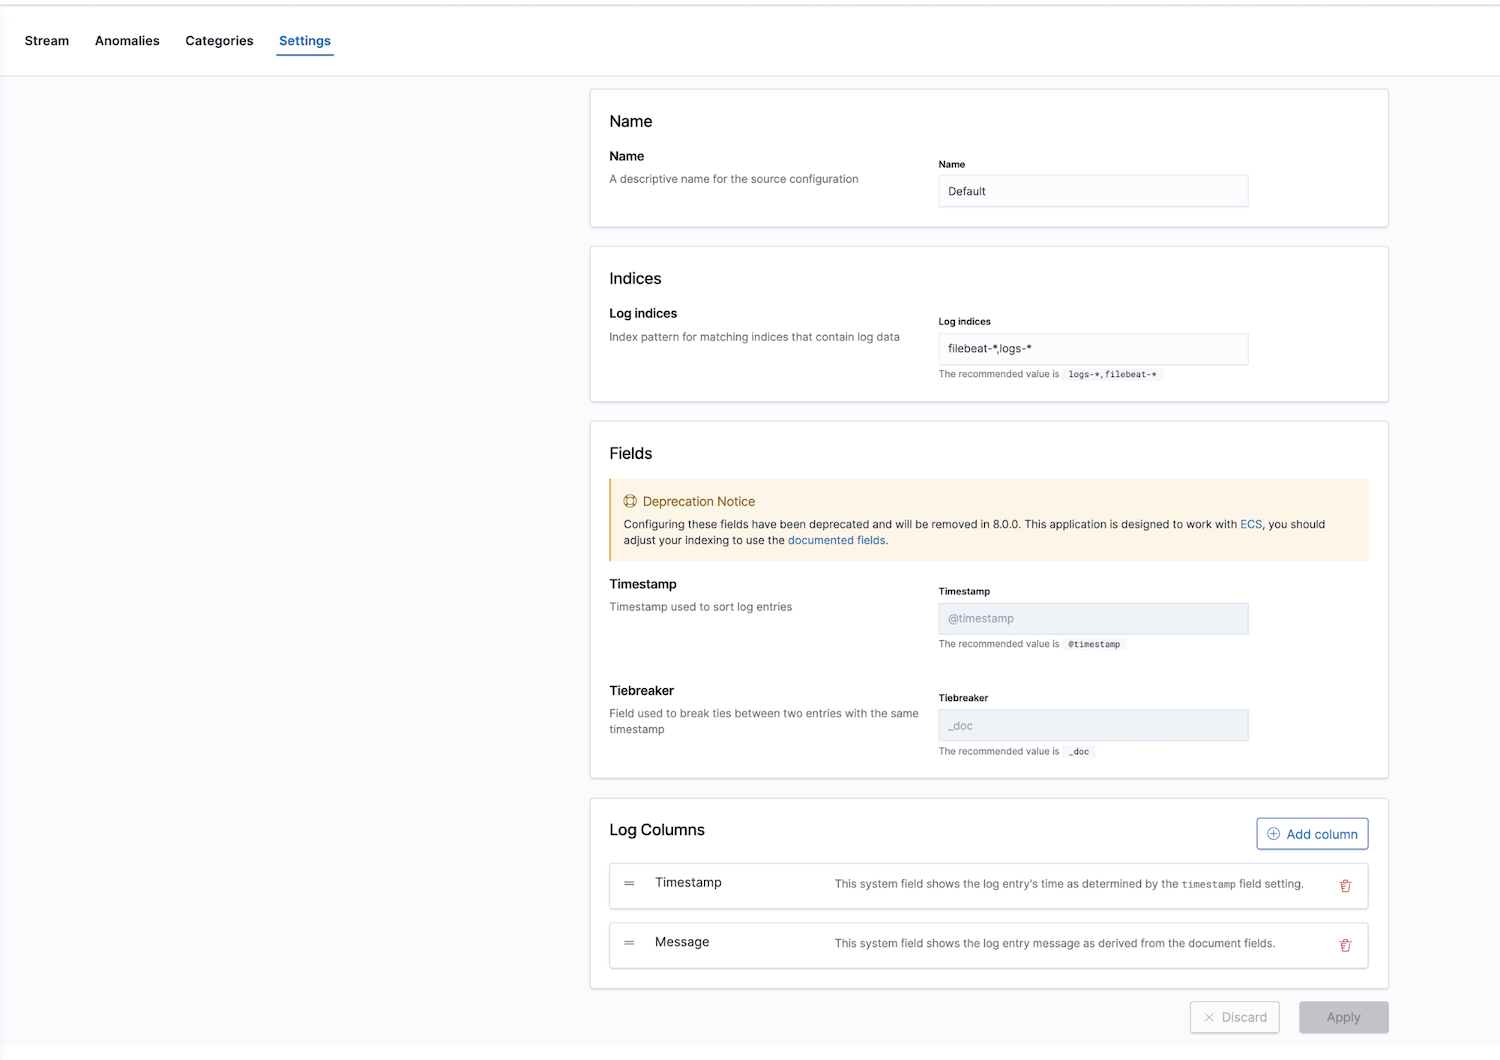
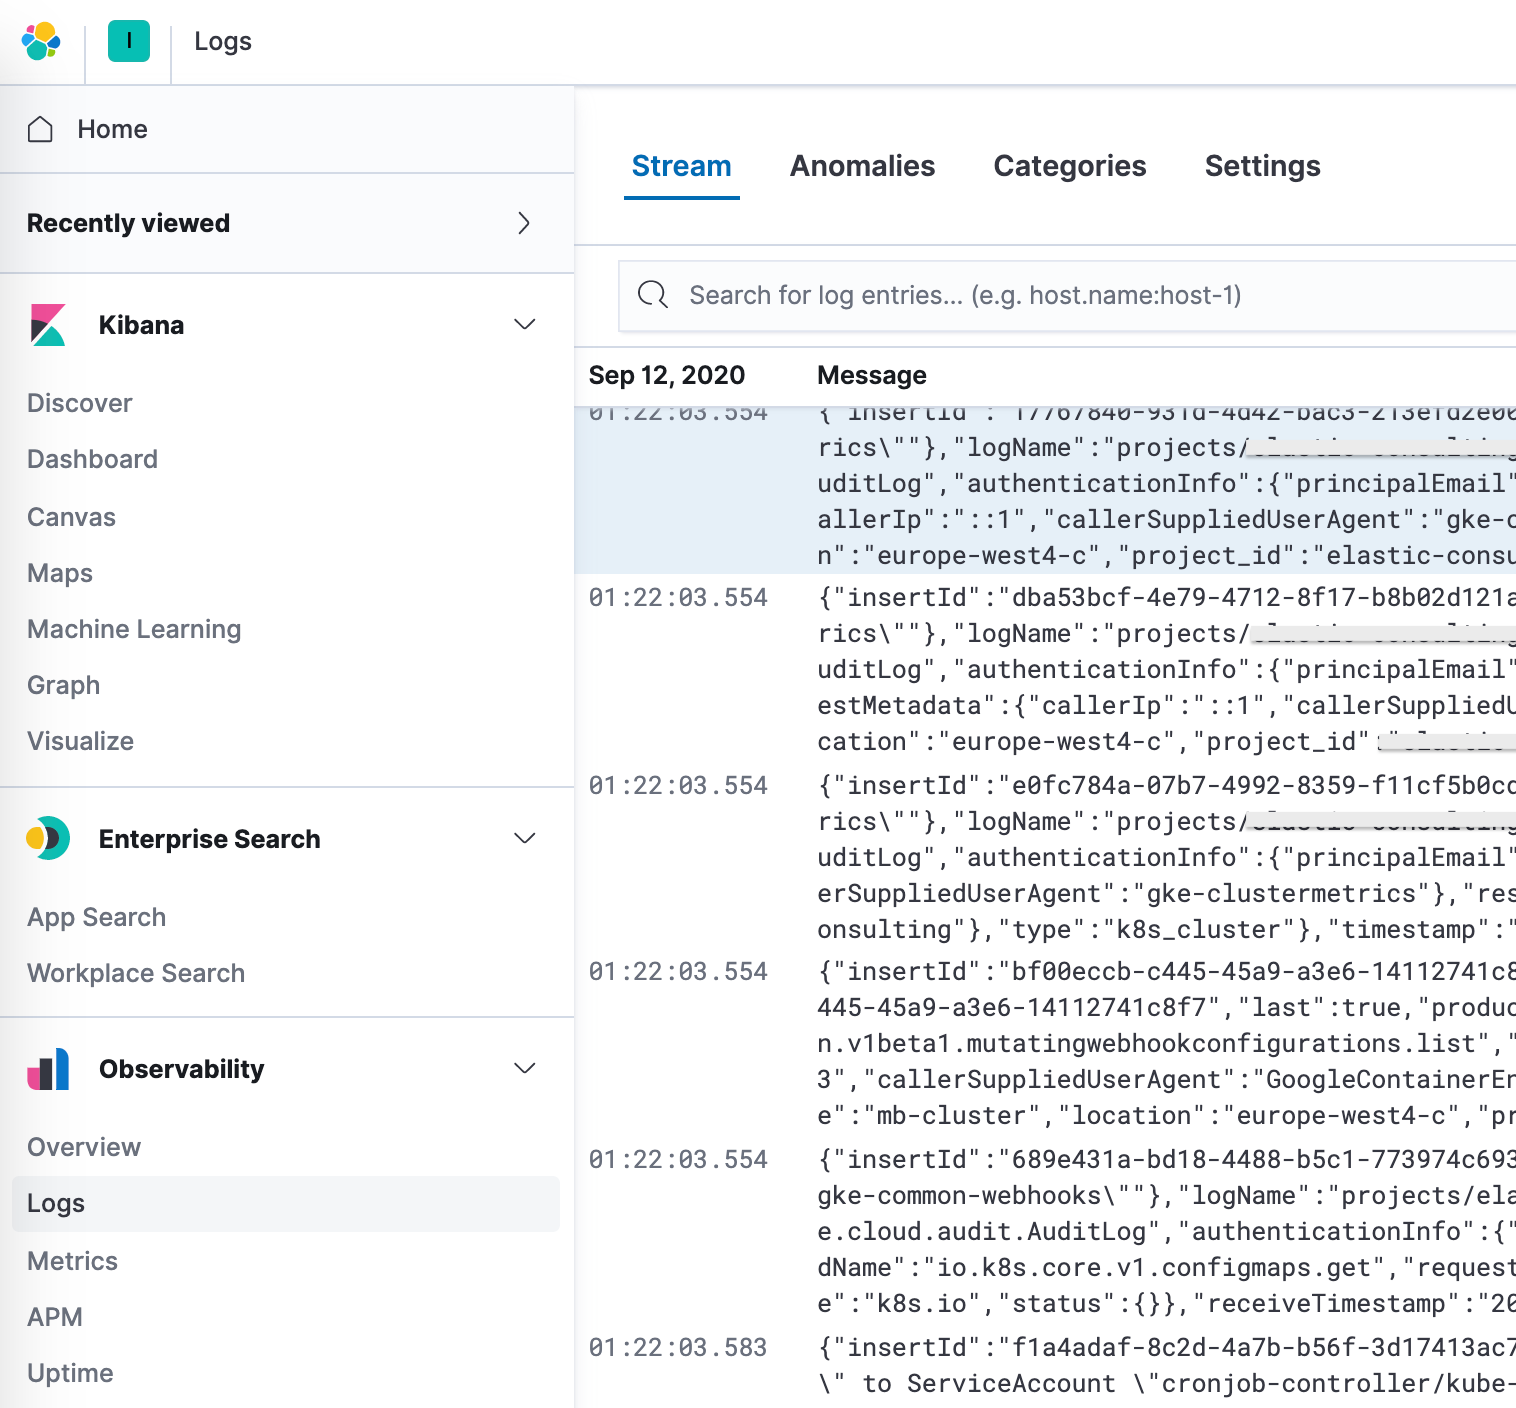
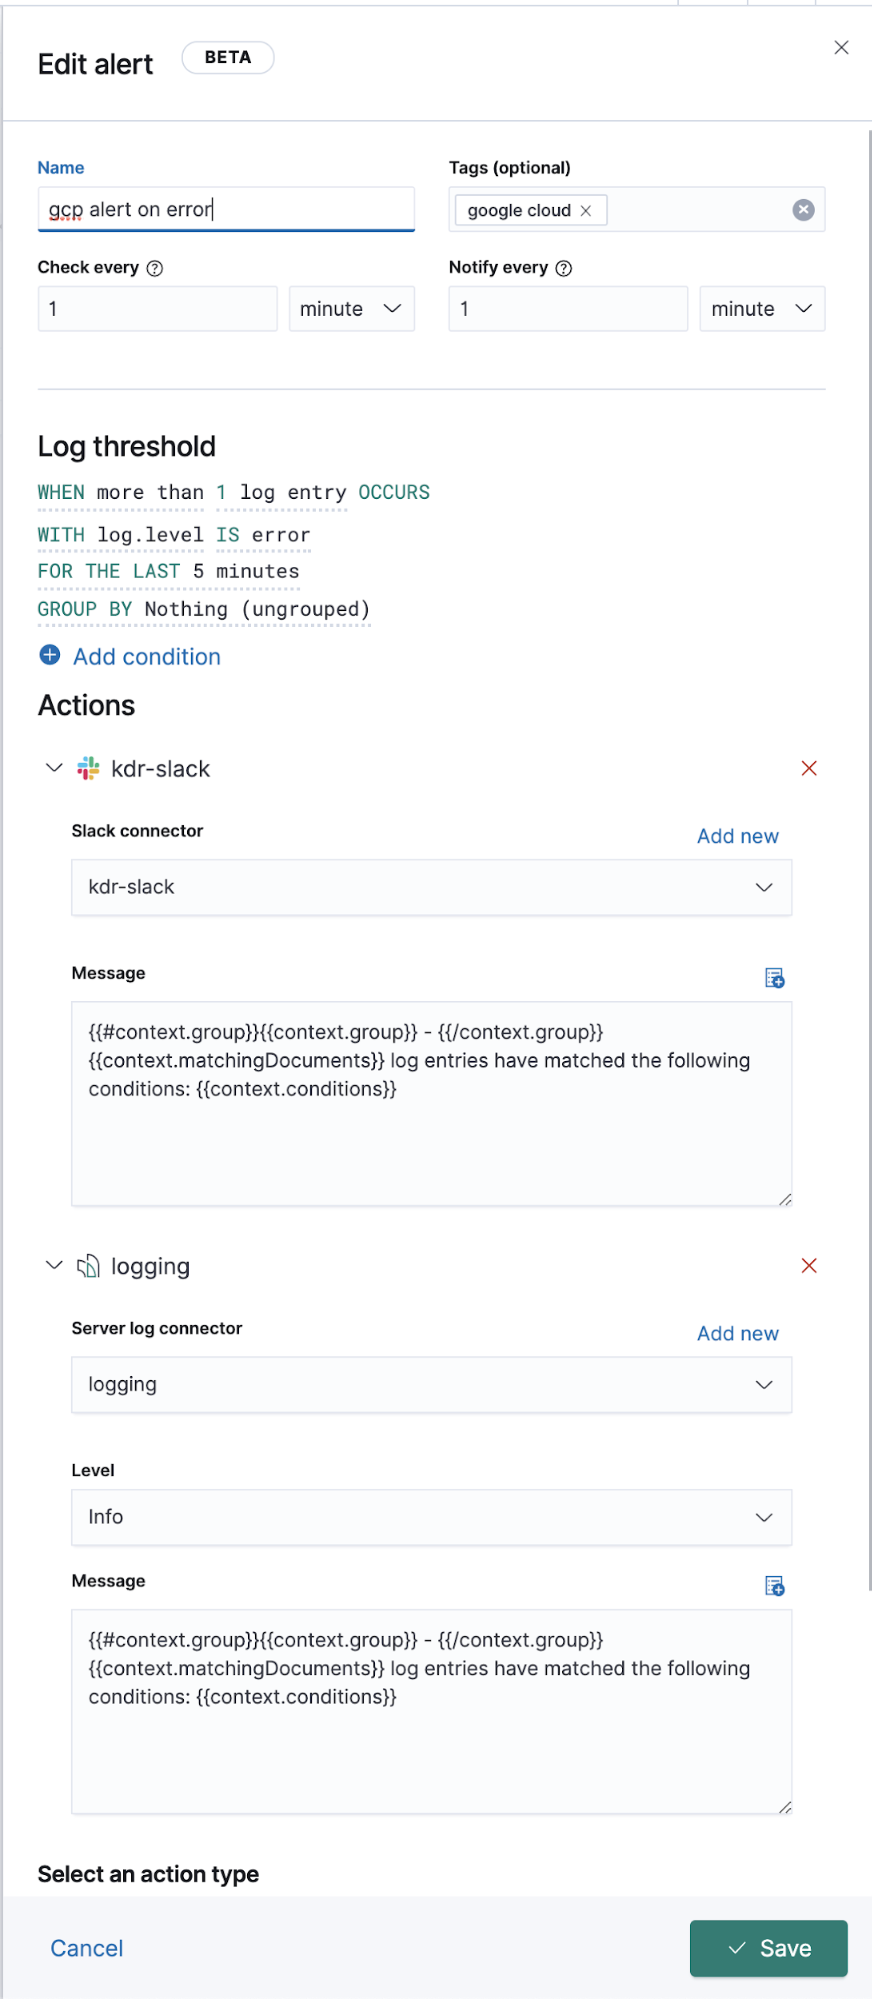
After configuring the correct index patterns in the settings, you can explore your logs in the Logs app, which allows you to view details of the logs and, more importantly, lets you define machine learning jobs for anomalous behaviour, categorize the data, and create an alert.
Extended Google Operations (Stackdriver) logging
Above, we discussed how to ship operations logs for those logs which have Filebeat modules, but what about other logs without a dedicated Filebeat module? Below we will discuss how to ship those to Elastic as well, to view alongside your other log data.
From the Google Cloud setup and configuration point of view, everything, including the flow, remains the same. We create a sink, topic, subscription, sa, and JSON key. The difference lies only in the Filebeat configuration.
In the background, modules run on inputs and preconfigured, source-level parsing, and in some cases, ingest pipelines. Filebeat modules simplify the collection, parsing, and visualization of common log formats, but for Filebeat inputs, additional parsing is required in some cases.
The googlecloud module uses the google-pubsub input under the hood, and supplies some module-specific ingest pipelines. It supports vpcflow, audit, and firewall logs out of the box.
Configuration
Instead of using a Filebeat module, we will subscribe to these topics from a Filebeat input.
Add to your filebeat.yml file:
filebeat.inputs:
- type: google-pubsub
  enabled: true
  pipeline: gcp-pubsub-parse-message-field
  tags: ["gcp-pubsub"]
  project_id: elastic-consulting
  topic: gcp-gke-container-logs
  subscription.name: gcp-gke-container-logs-sub
  credentials_file: /etc/filebeat/kdr-gcp-logs-sa-editor-only.json
In this input we are specifying the topic to pull from and which subscription to be used. We are also specifying the credentials file and an ingest pipeline which we will define next.
Ingest pipelines
An ingest pipeline is a definition of a series of processors that are to be executed in the same order as they are declared.
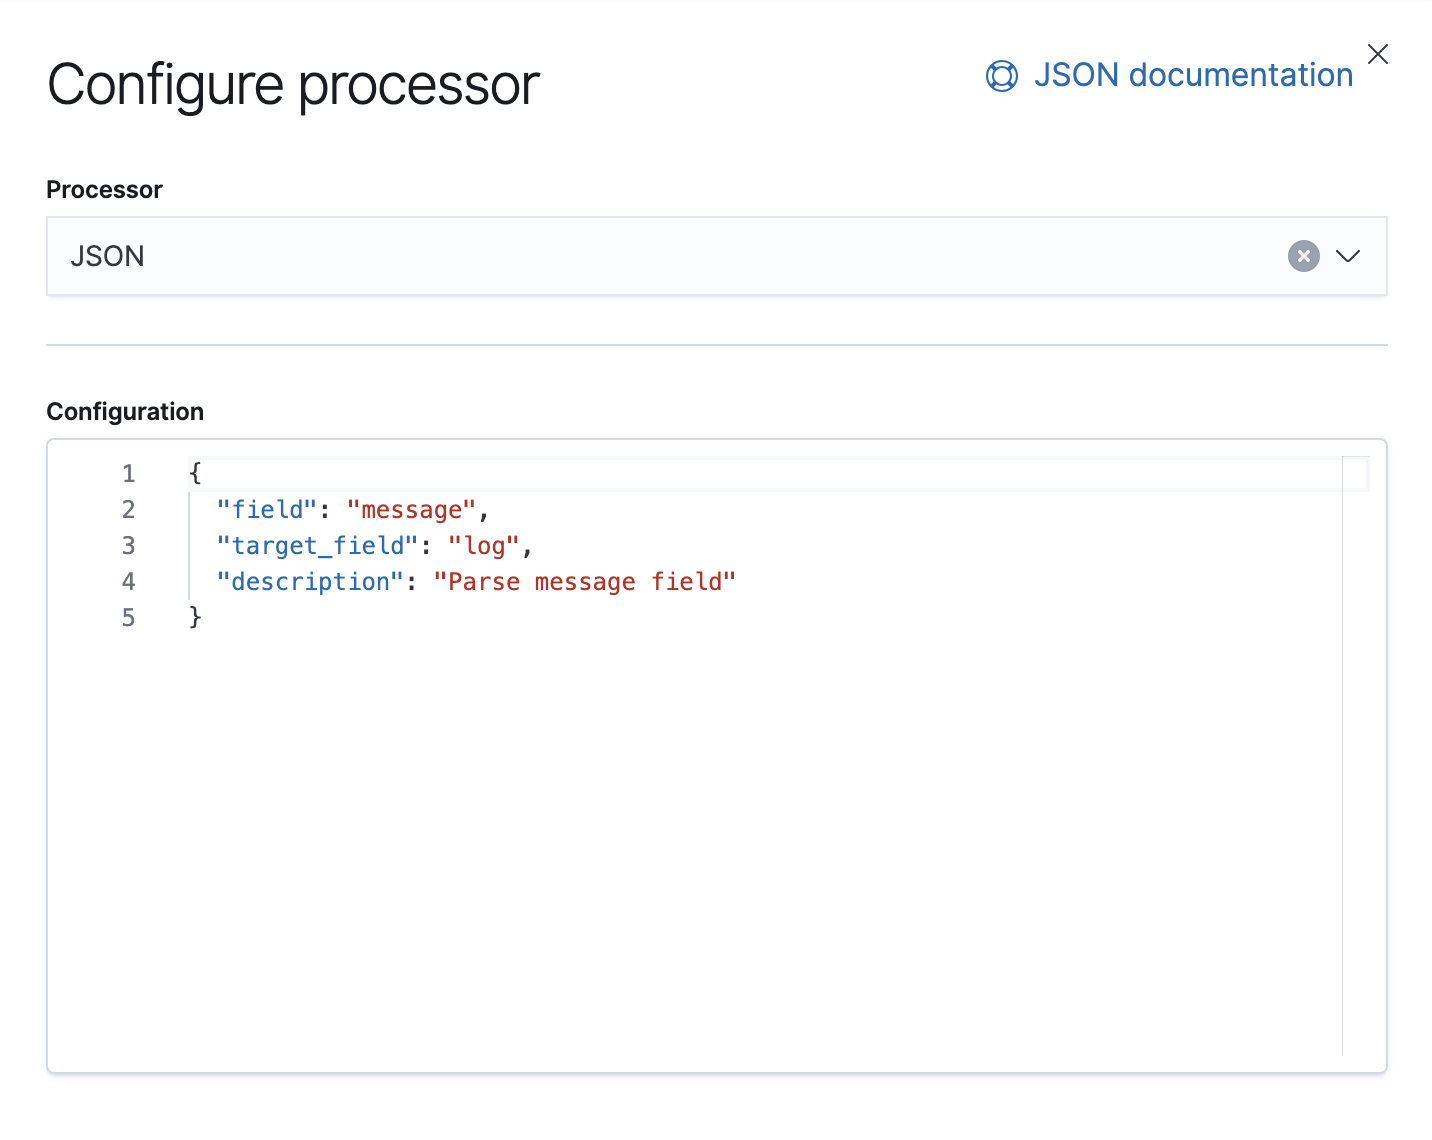
Google Cloud Operations stores logs and message bodies in JSON format, which means that we just need to add a JSON processor in the pipeline to extract data in the message field to individual fields in Elasticsearch.
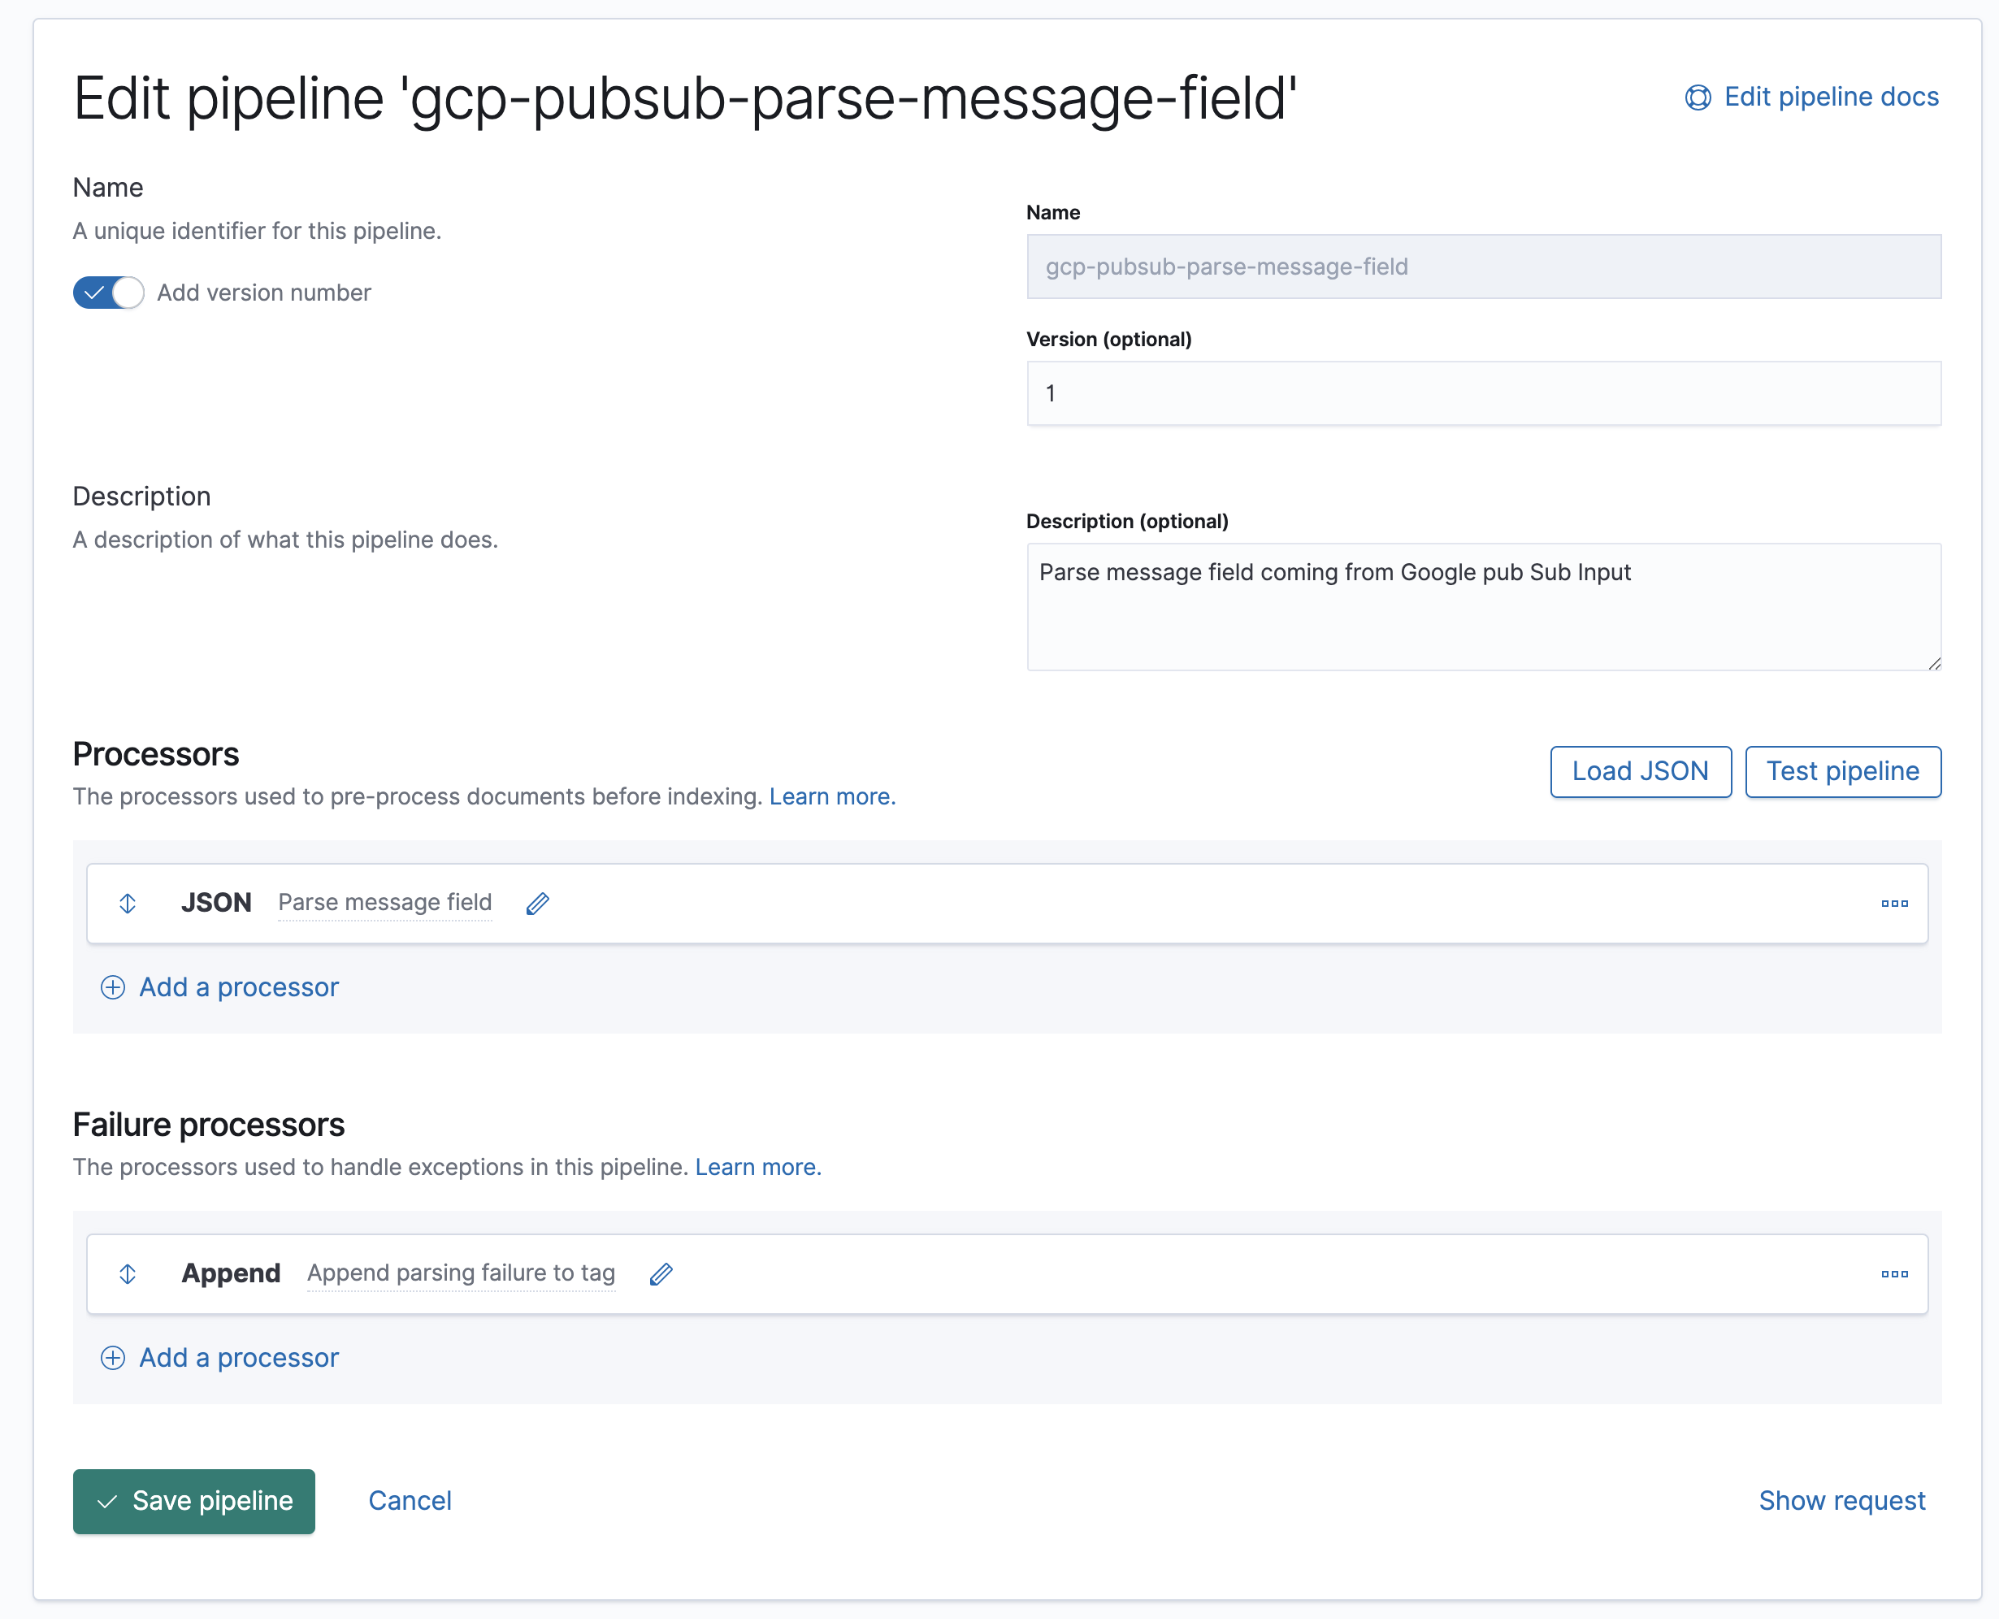
In this pipeline, we have one JSON processor that sources data from the message field in the document and extracts it to a target field called log.
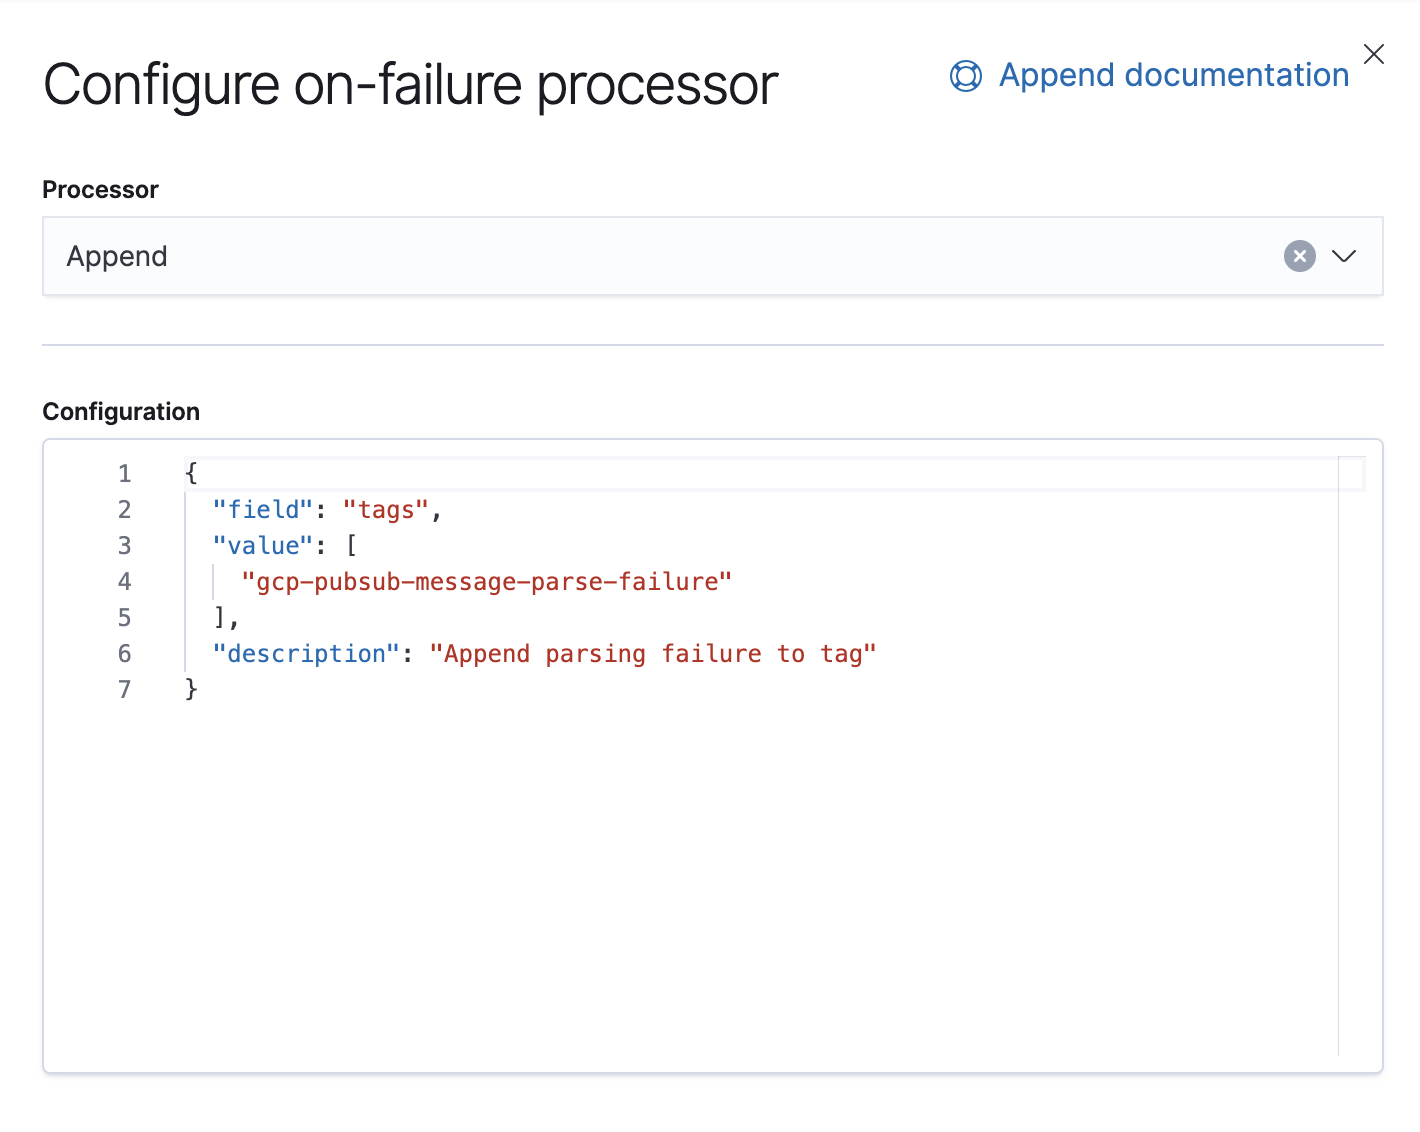
We also have a Failure processor that is there to handle exceptions in this pipeline, in which case we will just append a tag.
Starting with 7.8, ingest pipelines can be built from a UI in Kibana, under Stack Management → Ingest Node Pipelines. If you are on an older version, APIs can be used. Here is the equivalent API for this pipeline.
PUT _ingest/pipeline/gcp-pubsub-parse-message-field
{
  "version": 1,
  "description": "Parse message field coming from Google pub Sub Input",
  "processors": [
    {
      "json": {
        "field": "message",
        "target_field": "log",
        "description": "Parse message field"
      }
    }
  ],
  "on_failure": [
    {
      "append": {
        "field": "tags",
        "value": [
          "gcp-pubsub-message-parse-failure"
        ],
        "description": "Append parsing failure to tag"
      }
    }
  ]
}
We will save this pipeline and as long as we have this same pipeline configured in google-pubsub input, we should start seeing parsed logs in Kibana.
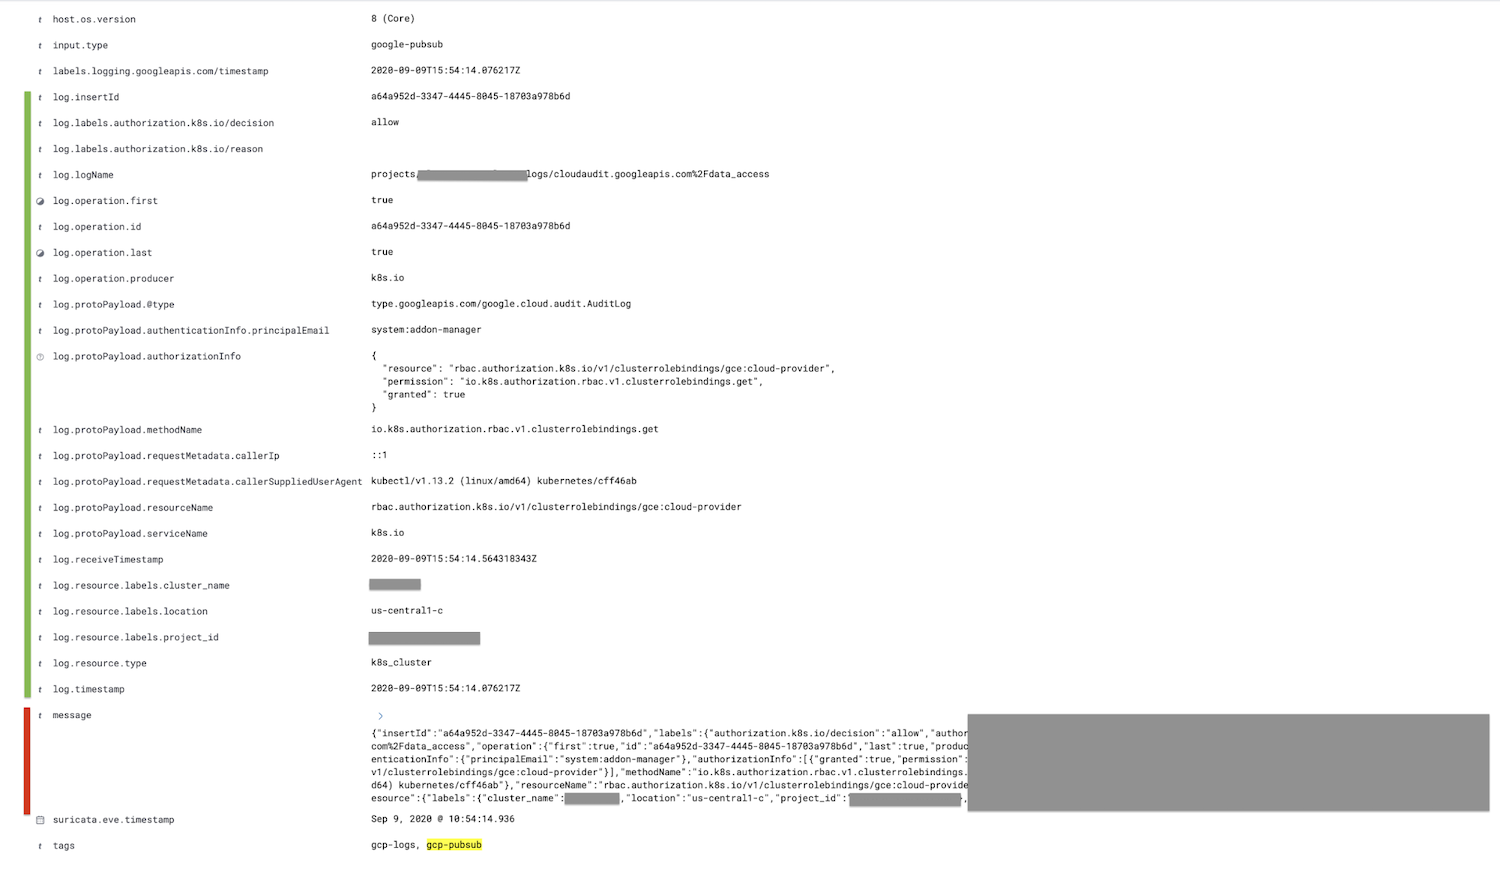
The field marked in red, the message field, is parsed into the log field and all child fields are nested further, shown in green.
Optionally, the message field can be removed after the JSON processor in the ingest pipeline using the remove processor; this will reduce the size of the document.
Wrapping up
That's all for this blog — thanks for following along! If you have questions, start up a conversation in our Discuss forums; we'd love to hear from you. Or learn more about logging and observability with Elastic in our on-demand webinar.
If you want to give this demo a try, sign up for a free trial of Elasticsearch Service on Elastic Cloud or download the latest version to manage it yourself.