Alerting and Actions
editAlerting and Actions
editThis functionality is in beta and is subject to change. The design and code is less mature than official GA features and is being provided as-is with no warranties. Beta features are not subject to the support SLA of official GA features.
Alerting allows you to detect complex conditions within different Kibana apps and trigger actions when those conditions are met. Alerting is integrated with APM, Metrics, SIEM, Uptime, can be centrally managed from the Management UI, and provides a set of built-in actions and alerts for you to use.
To make sure you can access alerting and actions, see the setup and pre-requisites section.
Concepts and terminology
editAlerts work by running checks on a schedule to detect conditions. When a condition is met, the alert tracks it as an alert instance and responds by triggering one or more actions. Actions typically involve interaction with Kibana services or third party integrations. Connectors allow actions to talk to these services and integrations. This section describes all of these elements and how they operate together.
What is an alert?
editAn alert specifies a background task that runs on the Kibana server to check for specific conditions. It consists of three main parts:
- Conditions: what needs to be detected?
- Schedule: when/how often should detection checks run?
- Actions: what happens when a condition is detected?
For example, when monitoring a set of servers, an alert might check for average CPU usage > 0.9 on each server for the two minutes (condition), checked every minute (schedule), sending a warning email message via SMTP with subject CPU on {{server}} is high (action).

The following sections each part of the alert is described in more detail.
Conditions
editUnder the hood, Kibana alerts detect conditions by running javascript function on the Kibana server, which gives it flexibility to support a wide range of detections, anything from the results of a simple Elasticsearch query to heavy computations involving data from multiple sources or external systems.
These detections are packaged and exposed as alert types. An alert type hides the underlying details of the detection, and exposes a set of parameters to control the details of the conditions to detect.
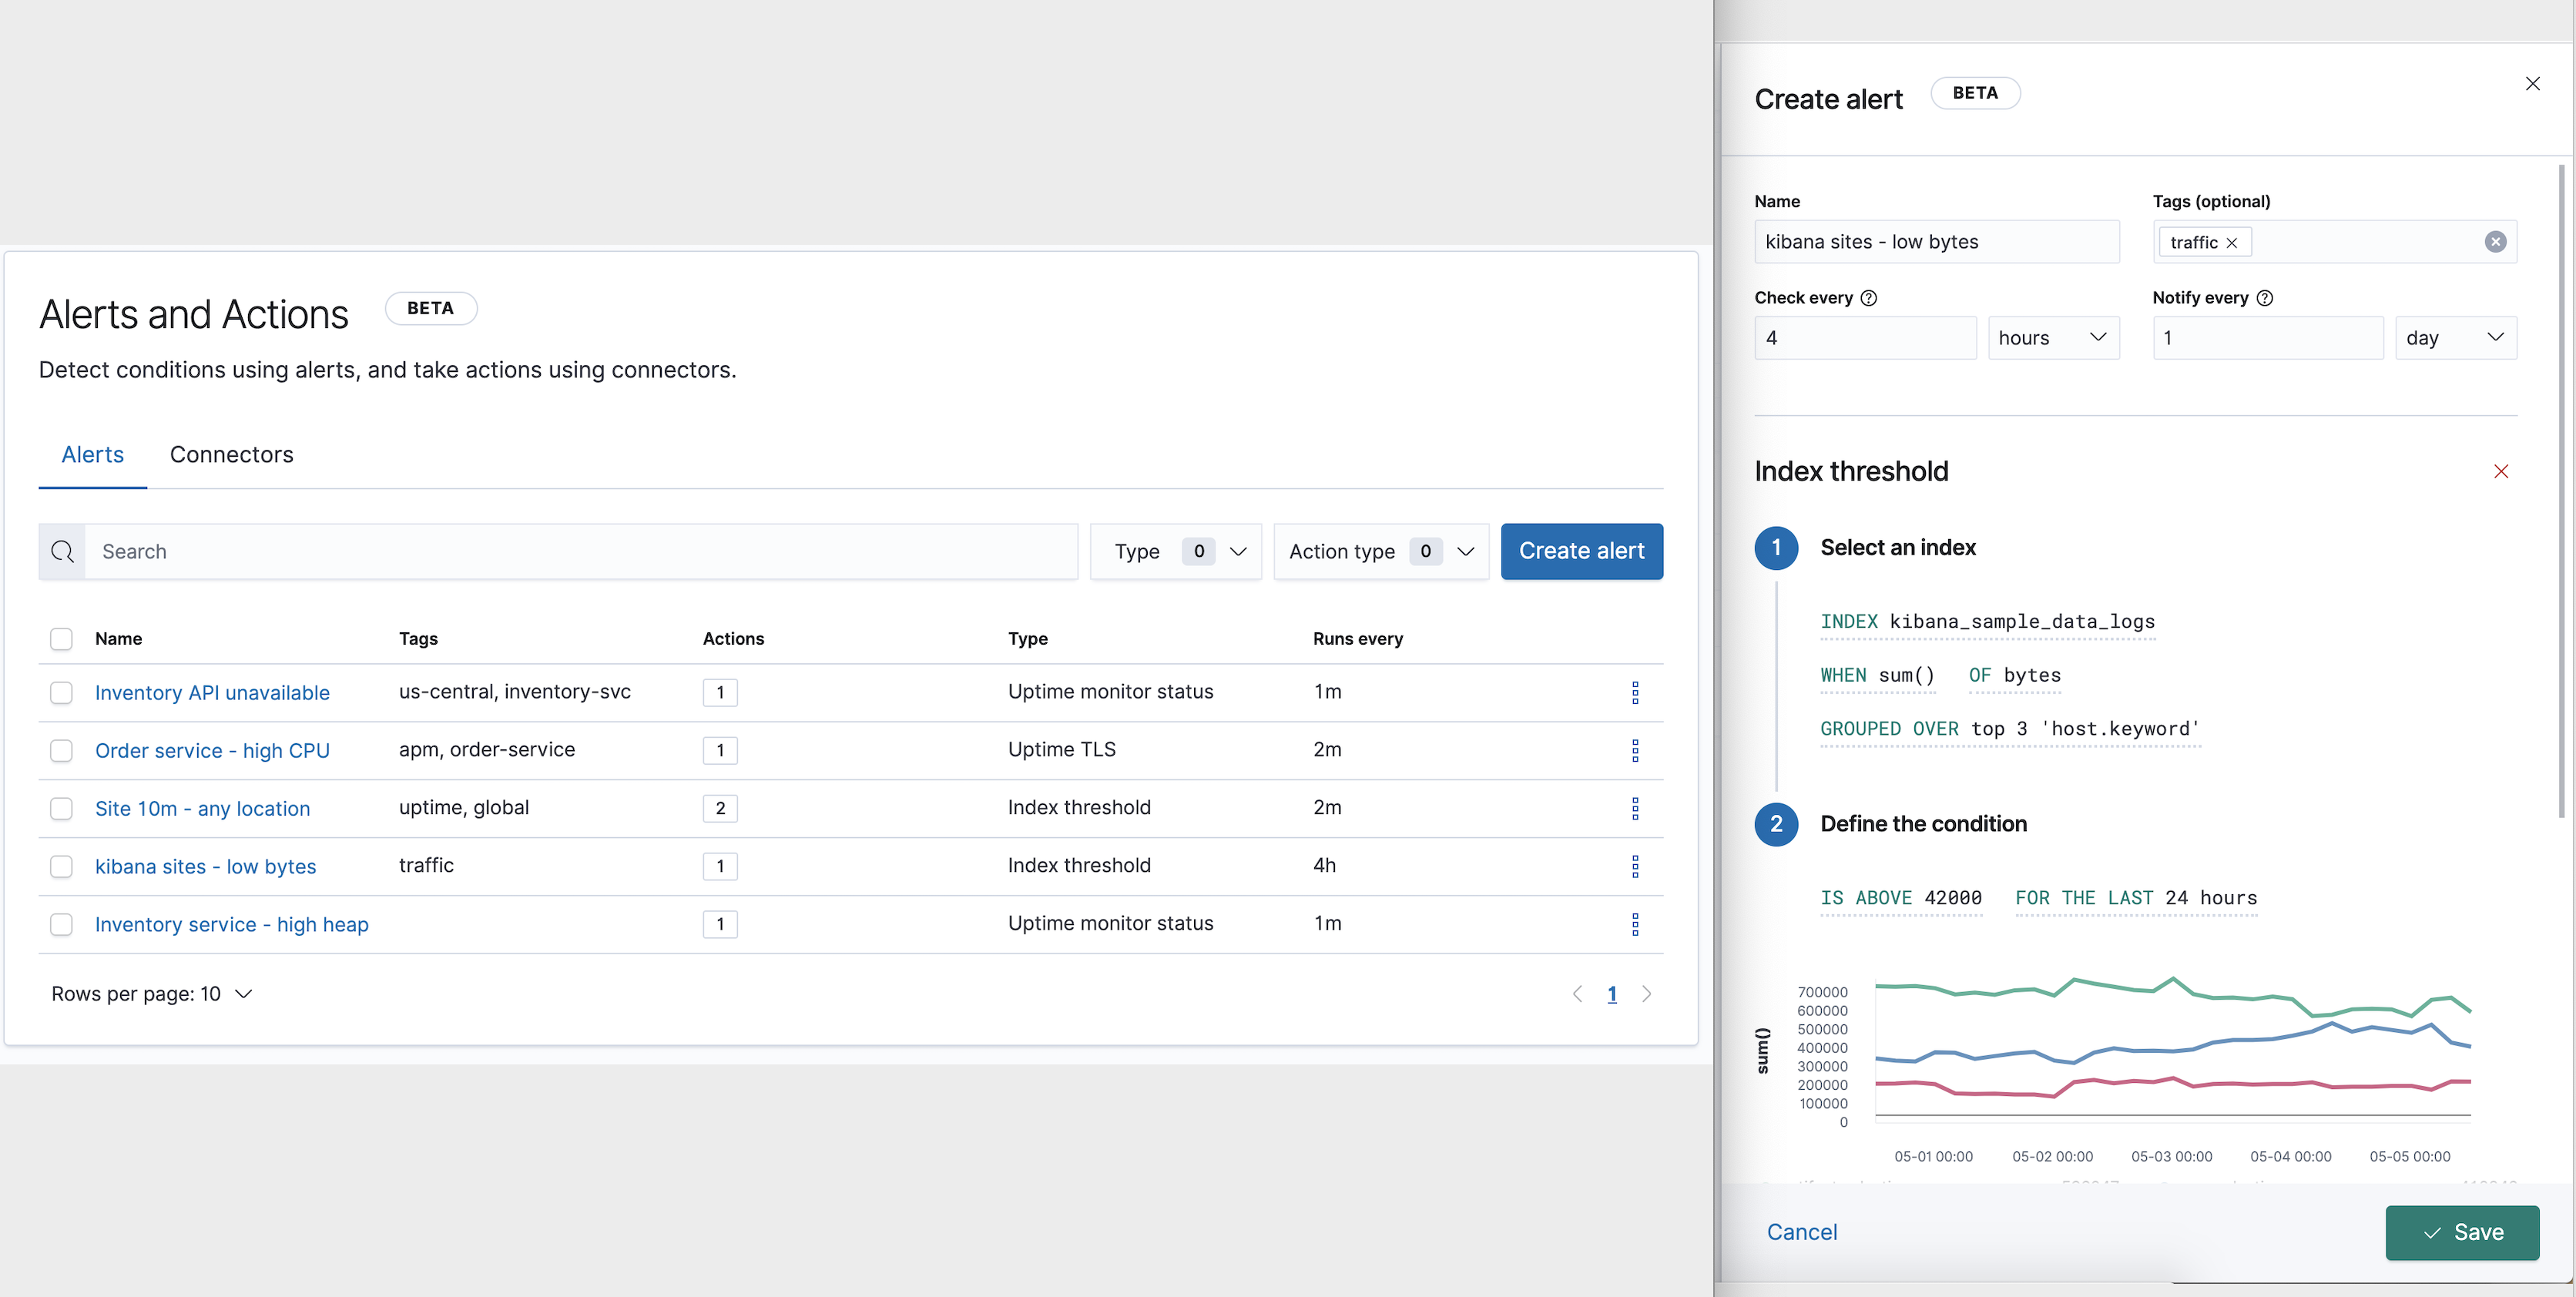
For example, an index threshold alert type lets you specify the index to query, an aggregation field, and a time window, but the details of the underlying Elasticsearch query are hidden.
See Alert types for the types of alerts provided by Kibana and how they express their conditions.
Schedule
editAlert schedules are defined as an interval between subsequent checks, and can range from a few seconds to months.
The intervals of alert checks in Kibana are approximate, their timing of their execution is affected by factors such as the frequency at which tasks are claimed and the task load on the system. See Scale and performance for more information.
Actions
editActions are invocations of Kibana services or integrations with third-party systems, that run as background tasks on the Kibana server when alert conditions are met.
When defining actions in an alert, you specify:
- the action type: the type of service or integration to use
- the connection for that type by referencing a connector
- a mapping of alert values to properties exposed for that type of action
The result is a template: all the parameters needed to invoke a service are supplied except for specific values that are only known at the time the alert condition is detected.
In the server monitoring example, the email action type is used, and server is mapped to the body of the email, using the template string CPU on {{server}} is high.
When the alert detects the condition, it creates an alert instance containing the details of the condition, renders the template with these details such as server name, and executes the action on the Kibana server by invoking the email action type.

See Action and connector types for details on the types of actions provided by Kibana.
Alert instances
editWhen checking for a condition, an alert might identify multiple occurrences of the condition. Kibana tracks each of these alert instances separately and takes action per instance.
Using the server monitoring example, each server with average CPU > 0.9 is tracked as an alert instance. This means a separate email is sent for each server that exceeds the threshold.

Suppressing duplicate notifications
editSince actions are taken per instance, alerts can end up generating a large number of actions. Take the following example where an alert is monitoring three servers every minute for CPU usage > 0.9:
- Minute 1: server X123 > 0.9. One email is sent for server X123.
- Minute 2: X123 and Y456 > 0.9. Two emails are sent, on for X123 and one for Y456.
- Minute 3: X123, Y456, Z789 > 0.9. Three emails are sent, one for each of X123, Y456, Z789.
In the above example, three emails are sent for server X123 in the span of 3 minutes for the same condition. Often it’s desirable to suppress frequent re-notification. Operations like muting and re-notification throttling can be applied at the instance level. If we set the alert re-notify interval to 5 minutes, we reduce noise by only getting emails for new servers that exceed the threshold:
- Minute 1: server X123 > 0.9. One email is sent for server X123.
- Minute 2: X123 and Y456 > 0.9. One email is sent for Y456
- Minute 3: X123, Y456, Z789 > 0.9. One email is sent for Z789.
Connectors
editActions often involve connecting with services inside Kibana or integrations with third-party systems. Rather than repeatedly entering connection information and credentials for each action, Kibana simplifies action setup using connectors.
Connectors provide a central place to store connection information for services and integrations. For example if four alerts send email notifications via the same SMTP service, they all reference the same SMTP connector. When the SMTP settings change they are updated once in the connector, instead of having to update four alerts.

Summary
editAn alert consists of conditions, actions, and a schedule. When conditions are met, alert instances are created that render actions and invoke them. To make action setup and update easier, actions refer to connectors that centralize the information used to connect with Kibana services and third-party integrations.

- Alert: a specification of the conditions to be detected, the schedule for detection, and the response when detection occurs.
- Action: the response to a detected condition defined in the alert. Typically actions specify a service or third party integration along with alert details that will be sent to it.
- Alert instance: state tracked by Kibana for every occurrence of a detected condition. Actions as well as controls like muting and re-notification are controlled at the instance level.
- Connector: centralized configurations for services and third party integration that are referenced by actions.
Differences from Watcher
editKibana alerting and Elasticsearch alerting are both used to detect conditions and can trigger actions in response, but they are completely independent alerting systems.
This section will clarify some of the important differences in the function and intent of the two systems.
Functionally, Kibana alerting differs in that:
- Scheduled checks are run on Kibana instead of Elasticsearch
- Kibana alerts hide the details of detecting conditions through alert types, whereas watches provide low-level control over inputs, conditions, and transformations.
- Kibana alerts tracks and persists the state of each detected condition through alert instances. This makes it possible to mute and throttle individual instances, and detect changes in state such as resolution.
- Actions are linked to alert instances in Kibana alerting. Actions are fired for each occurrence of a detected condition, rather than for the entire alert.
At a higher level, Kibana alerts allow rich integrations across use cases like APM, Metrics, SIEM, and Uptime. Pre-packaged alert types simplify setup, hide the details complex domain-specific detections, while providing a consistent interface across Kibana.
Setup and prerequisites
editIf you are using an on-premises Elastic Stack deployment:
-
In the kibana.yml configuration file, add the
xpack.encryptedSavedObjects.encryptionKeysetting.
If you are using an on-premises Elastic Stack deployment with security:
- You must enable Transport Layer Security (TLS) for communication between Elasticsearch and Kibana. Kibana alerting uses API keys to secure background alert checks and actions, and API keys require TLS on the HTTP interface. A proxy will not suffice.
Security
editTo access alerting in a space, a user must have access to one of the following features:
See feature privileges for more information on configuring roles that provide access to these features.
Space isolation
editAlerts and connectors are isolated to the Kibana space in which they were created. An alert or connector created in one space will not be visible in another.
Authorization
editAlerts, including all background detection and the actions they generate are authorized using an API key associated with the last user to edit the alert. Upon creating or modifying an alert, an API key is generated for that user, capturing a snapshot of their privileges at that moment in time. The API key is then used to run all background tasks associated with the alert including detection checks and executing actions.
If an alert requires certain privileges to run such as index privileges, keep in mind that if a user without those privileges updates the alert, the alert will no longer function.
Restricting actions
editFor security reasons you may wish to limit the extent to which Kibana can connect to external services. Action settings allows you to disable certain Action and connector types and whitelist the hostnames that Kibana can connect with.