Integrating Elasticsearch with ArcSight SIEM - Part 2
Editor's Note (August 3, 2021): This post uses deprecated features. Please reference the map custom regions with reverse geocoding documentation for current instructions.
| Get your ArcSight security data into Elasticsearch and visualized in Kibana in literally minutes with the Logstash ArcSight module. Learn more. |
Editor's Note: Be sure to check out the other posts in this 6-part blog series. Part 1 kicks off the series with getting started content. Part 3 walks you through how to scale the architecture. Part 4 and Part 5 provide examples of setting up alerts for common security threats using the alerting features in X-Pack. Part 6 extends the alerting story with automated anomaly detection using machine learning.
In the first post in the "Integrating the Elastic Stack with ArcSight SIEM" blog series, we demonstrated how to send Common Event Format (CEF) data from an ArcSight connector to the Elastic Stack. We will continue the series with several posts illustrating how to proactively monitor security data in Elasticsearch using X-Pack alerting features.
The X-Pack alerting capability allows users to watch for changes or anomalies in their data and perform necessary actions in response. For those new to the capability, consider exploring the Getting Started Content and Elastic Watcher Lab series.
While we have many existing examples of alerting on data in Elasticsearch, we will focus our examples in this blog series specifically on data in the CEF format. Our hope is that providing these examples tailored for the CEF format will be valuable to users looking to complement their existing ArcSight-based security solutions with the Elastic Stack. The alert configurations ("watches") themselves, however, are applicable to any CEF compliant data with the required fields. The test environment referenced additionally requires no further configuration to integrate with ArcSight - simply forward events to the Logstash TCP port and start enjoying the watches!
Throughout this blog series we will focus on rule-based alerting, starting with a relatively simple use case before progressing to more complex pattern detection. Finally we will explore machine learning-based anomaly detection as we attempt to address the obvious challenges with pure rule-based alerting approaches for more complex pattern detection.
Security analytics watches execute against a constant stream of data in real time. Each watch will execute periodically, accessing the last N seconds and raising an alert if required. Throughout this series we utilise several static historical datasets which cover up to a month period. In order to test, we can’t realistically ingest the data and wait for events to fire over the next month! We have therefore adjusted the watches to execute over the full indexed dataset.
Successful Login From an External IP
Problem: "Alert if a successful SSH login is performed from an External IP"
We start with a simple watch to introduce the concepts of using basic alerting in X-Pack to identify specific patterns in your Elasticsearch data.
For our first use case, we utilise a common source of event data - authentication logs. The sample dataset consists of inbound SSH logs (in the CEF format) from a single honeypot during the month of November 2016. Below is a sample log line in the CEF format. The highlighted fields will be used in the watch definition.
CEF:0|Unix|Unix|5.0|cowrie.login.success|login attempt [root/!root] succeeded|Unknown|destinationUserName=root externalId=15 startTime=Nov 15 2016 19:22:29 destinationHostName=elastic_honeypot destinationAddress=192.168.20.2 deviceReceiptTime=Nov 15 2016 19:22:29 deviceTimeZone=Z transportProtocol=TCP applicationProtocol=SSHv2 destinationServiceName=sshd devicePayloadId=15 message=login attempt [root/!root] succeeded categoryOutcome=success categoryBehaviour=cowrie.login.success sourceTranslatedAddress=192.168.1.105 sourceAddress=192.168.1.105 deviceDirection=1 cs1=0 cs1Label=isError cs2=SSHService ssh-userauth on HoneyPotSSHTransport,2,192.168.1.105 cs2Label=system cs3=!root cs3Label=password cs4=111f70f0 cs4Label=session<span style="font-size: 14px; white-space: normal;">
</span>
The values of cowrie.login.failed and cowrie.login.success for our categoryBehaviour represent a failed and successful login respectively. The field destinationAddress indicates the target server. Note that while our example data is from a single server, the provided watch could be applied to a larger infrastructure with potentially hundreds of servers. To determine if the connection originated from an external IP address, we utilise the field sourceAddresss. Finally, the startTime indicates the time at which the event occurred. This field will be be parsed by our Logstash config file into the @timestamp field.
To ingest this dataset, we use a simple Logstash configuration enabled with the CEF codec. Instructions for downloading and ingesting this dataset, with supporting dashboards, can be found here.
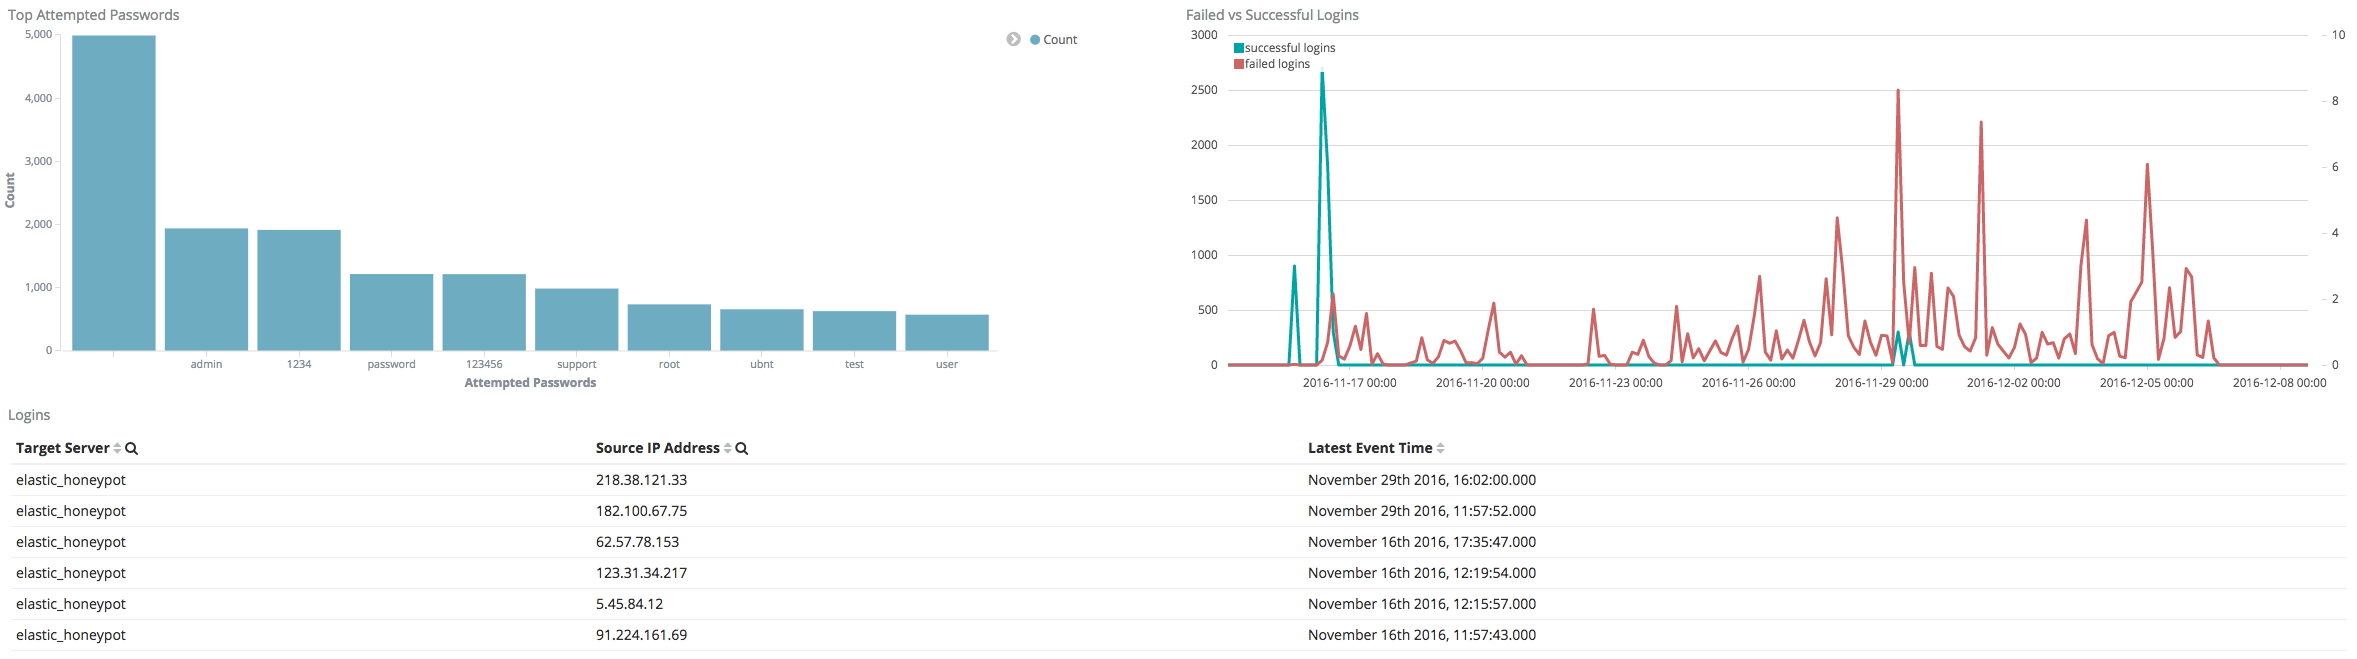
With around 114,000 SSH events, our honeypot attracted quite some attention. As you would expect, this is dominated by failed attempts as attackers iterated through common password lists.
For our simple example, we will alert on a successful login when it originates from an external IP.
A successful login from an external IP can be identified by an indexed CEF event containing the following fields and values:
- categoryBehaviour with a value of cowrie.login.success
- sourceAddress with a value that is NOT in the range 192.168.0.0/16
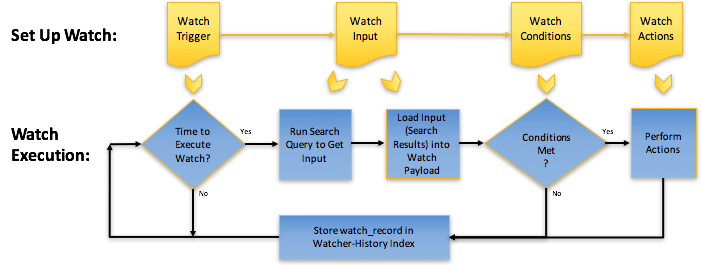
All watches execute periodically based on a schedule defined in the trigger block. We will set our watch to execute every N seconds and evaluate the last N seconds for a match. To filter the last N seconds, we evaluate events with a @timestamp > now-N seconds. We will trigger an alert if even a single match is detected. Finally, in order to provide a useful summary, we use aggregations to indicate the target server, source IP and time in any action output.
We will the apply the same iterative process to construct a watch in future example in this series. First we identify the input and query to capture the relevant data before evaluating the response with a condition to determine whether the watch fires an action. Next we extract the data points of interest through a transformation before finally taking action.
As described in the deployment instructions, we assume that the user is interacting with Elasticsearch and Watcher APIs via the Dev Tools -> Console app in Kibana.
Step 1 - Set Up Watch Trigger and Watch Input
The first step in constructing our watch is to identify the watch execution schedule i.e., how often it should execute and over which time window. This defines the "responsiveness" of our watch and how often we can potentially raise an alert. For this example, we will execute our watch every 10 seconds looking for potential successful remote logins.
We next need to identify the data we wish to evaluate in our watch. This requires an input to load our data into the current execution context. As our SSH events are stored in Elasticsearch we utilise a Search input to load the results from a query. The query itself uses a simple boolean match to identify those documents in the last 10 seconds which indicate a successful login from a remote IP.
{
  "trigger": {
    "schedule": {
      "interval": "10s"
    }
  },
  "input": {
    "search": {
      "request": {
        "indices": [
          "cef-ssh-*"
        ],
        "types": [
          "syslog"
        ],
        "body": {
          "query": {
            "bool": {
              "must_not": [
                {
                  "term": {
                    "sourceAddress": {
                      "value": "192.168.0.0/16"
                    }
                  }
                }
              ],
              "filter": [
                {
                  "term": {
                    "categoryBehaviour": "cowrie.login.success"
                  }
                },
                {
                  "range": {
                    "@timestamp": {
                      "gte": "now-10s"
                    }
                  }
                }
              ]
            }
          },
          "size": 100,
          "_source": [
            "destinationHostName",
            "sourceAddress",
            "@timestamp"
          ]
        }
      }
    }
  }
}
Some Considerations
The above query requests 100 results only. This limits us to alerting on 100 successful logins every 10 seconds - more than sufficient for most infrastructures! As each document represents a successful login, we restrict the data we report to the destinationHostName, sourceAddress and @timestamp using a _source filter.
For the purposes of testing, we can remove the date filter to execute the query across the entire dataset - thus avoiding the need to execute the watch for every period. For the final watch shown in Step 5 - Put It all together, we restore this filter for completeness.
Step 2 - Setup Watch Condition
The previous step caused the results of the query to be loaded into the execution context as a dictionary. This is accessible through the ctx.payload parameter. We utilise this to evaluate whether an action should be taken through a condition, which determines whether the watch will fire by returning true or false. Here we find a compare condition is sufficient, evaluating whether the number of hits is > 0. In later posts, we utilise the more powerful script condition.
"compare": {
  "ctx.payload.hits.total": {
    "gt": 0
  }
}
Step 3 - Transform Watch Input into Watch Payload
Rather than sending out alerts with the full query response, we can use a transform stage to modify the payload into a more readable structure. This will also be required for Step 4, where we aim to index each matching response document back into Elasticsearch for visualisation purposes. Fortunately, we can achieve this with a simple script transform and one line in Elasticsearch’s native scripting language Painless.
"transform": {
      "script": "return ctx.payload.hits.hits.stream().map(d -> ['@timestamp':d._source['@timestamp'],'sourceAddress':d._source.sourceAddress,'destinationHostName':d._source.destinationHostName]).collect(Collectors.toList());"
}
Example output payload:
[
  {
    "@timestamp": "2016-11-16T17:35:50.000Z",
    "destinationHostName": "elastic_honeypot",
    "source_ip": "62.57.78.153"
  },
  {
    "@timestamp": "2016-11-16T12:15:57.000Z",
    "destinationHostName": "elastic_honeypot",
    "source_ip": "5.45.84.12"
  }
]
Step 4 - Set Up Watch Actions
On detecting successful remote logins we would typically raise an alert through the appropriate medium e.g., a ticketing system for the analyst to investigate. Whilst these are supported in Alerting, for the purposes of example we can simulate this process by indexing a doc for each login to ES using the index action.
Our index action requires the document be placed in the the appropriate "_doc" key, achieved through a simple Painless script.
"index_payload": {
  "transform": {
    "script": "return ['_doc':ctx.payload._value];"
    },
    "index": {
      "index": "cef-ssh-watch-results",
      "doc_type": "watch-result"
    }
}
Step 5 - Put It It All Together
In assembling the above, we need to consider some X-Pack alerting level parameters. As shown below we control how often the watch is executed using a schedule interval. This should be consistent with the range query, which uses the scheduled time to ensure watches do not overlap. Finally, by assuming daily indices for our events we are able to target the query at only the current day’s index for efficiency.
{
  "trigger": {
    "schedule": {
      "interval": "10s"
    }
  },
  "input": {
    "search": {
      "request": {
        "indices": [
          "<cef-ssh-{now/d}>"
        ],
        "types": [
          "syslog"
        ],
        "body": {
          "query": {
            "bool": {
              "must_not": [
                {
                  "term": {
                    "sourceAddress": {
                      "value": "192.168.0.0/16"
                    }
                  }
                }
              ],
              "filter": [
                {
                  "term": {
                    "categoryBehaviour": "cowrie.login.success"
                  }
                },
                {
                  "range": {
                    "@timestamp": {
                      "gte": "{{ctx.trigger.scheduled_time}}||-10s"
                    }
                  }
                }
              ]
            }
          },
          "size": 100,
          "_source": [
            "destinationHostName",
            "sourceAddress",
            "@timestamp"
          ]
        }
      }
    }
  },
  "condition": {
    "compare": {
      "ctx.payload.hits.total": {
        "gt": 0
      }
    }
  },
  "transform": {
    "script": "return ctx.payload.hits.hits.stream().map(d -> ['@timestamp':d._source['@timestamp'],'sourceAddress':d._source.sourceAddress,'destinationHostName':d._source.destinationHostName]).collect(Collectors.toList());"
  },
  "actions": {
    "index_payload": {
      "transform": {
        "script": "return ['_doc':ctx.payload._value];"
      },
      "index": {
        "index": "cef-ssh-watch-results",
           "doc_type": "watch-result"
      }
    }
  }
}
To insert the watch, use the PUT API as described here. Alternatively, remove the date filter and execute the watch across the dataset using the inline execution API. This will result in an indexed document for up to 100 successful logins that exist in the dataset. Using the dashboard from earlier, we can add a table visualization populated with the latest successful remote login to each server.
Final Thoughts
In our next post we will learn how to scale the architecture we discussed in Part 1 before we look at detecting and alerting on more complex patterns with X-Pack alerting features.
Interesting in learning more? Check out other posts in the Elasticsearch + ArcSight series.
- Part 1 - How to send Common Event Format data from ArcSight to Elasticsearch
- Part 2 - How to proactively monitor security data in Elasticsearch with X-Pack alerting features
- Part 3 - Scaling your ArcSight and Elasticsearch architecture
- Part 4 - Detecting Successful SSH Brute Force Attacks
- Part 5 - Detecting Unusual Process using Rules Based Alerts
- Part 6 - Using Machine Learning to Detect Rare (unusual) Processes on a Server