Infrastructure and Logs UI: New ways for Ops to interact with Elasticsearch
With version 6.5 of the Elastic Stack, we released two new ways to interact with your data: the Infrastructure and Logs UIs. These are both in beta in 6.5, but more about that later when I will ask for your input. For each of these, I would like to talk a little about the motivation, the user experience, and the configuration of the UI. Let’s start with the Logs UI.
Logs UI
Motivation
I have heard this so many times: “Just give me the logs, I don’t need anything fancy, everything I need to know is written in the logs, I just want to read them”. We hear you. The choice is yours:
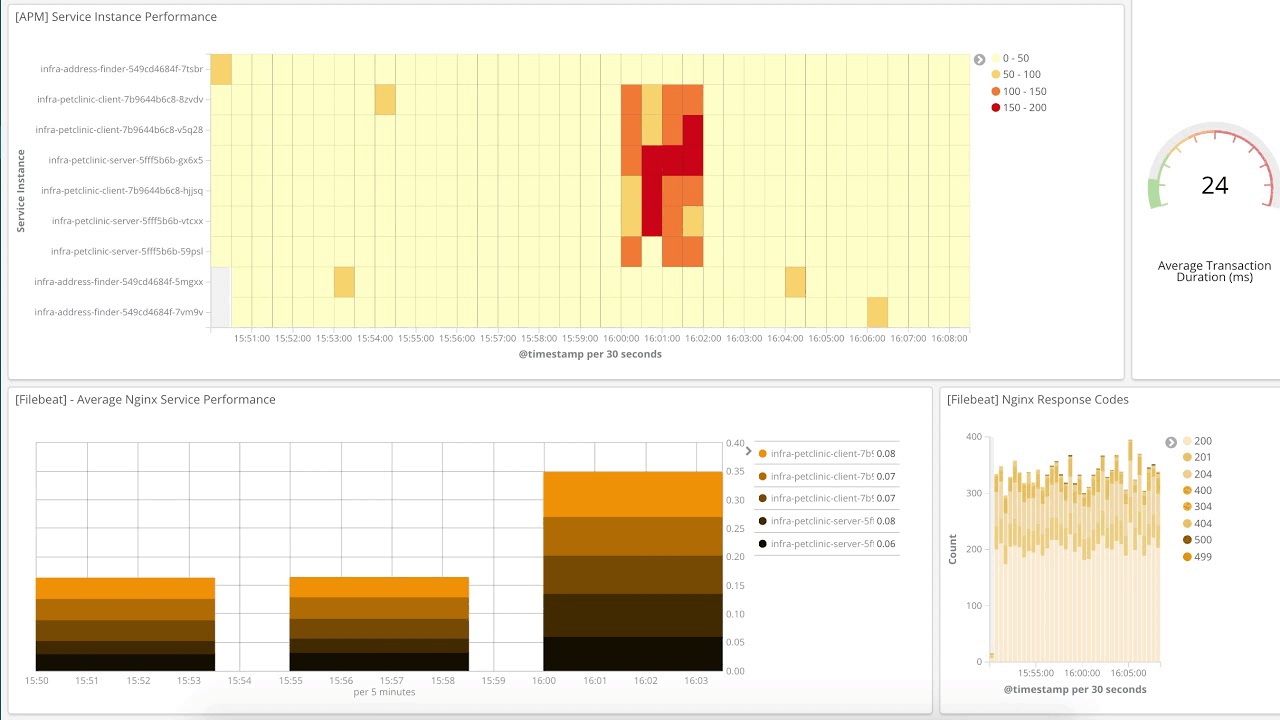
A souped up tail -f with the most recent at the bottom experience; a visual experience with tables, charts, tag clouds, etc; or a tabular view. You should be able to work the way that is best suited to you, and the openness of the Elastic Stack supports that.
| 
| 
|
User Experience
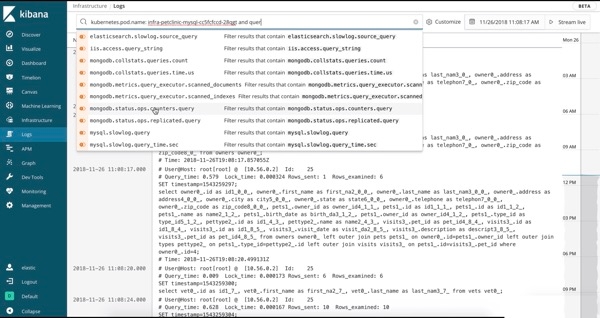
Using the Logs UI is similar to tailing a log file, but with all of your logs from all of your systems available in one console. The logs stream in, and the bottom of the view is the most recent record, just like a tail -f. By default, the Logs UI shows you all of the records from all of the logs that meet the configuration criteria (more on that in the next section). When you are working an issue and decide that you don’t want all your logs, from all of your services, all together (streaming by faster than anyone could possibly read), then just change the interaction by typing in the search bar up top. For example, if I only want to see 404 errors from the Apache httpd pods with the Kubernetes label tier = “frontend”, I just start typing in the search bar and let the autocomplete help me find the right logs:
Compare this to popping open a terminal, authenticating with your k8s provider, figuring out which pods you want and running kubectl logs -f … | grep 404 (or in the non-container world finding the host names, sshing in, tailing the logs, etc.). We want to make your life easier and give you your data in the way you want to see it.
Configuration
The Logs UI docs are in the usual place, but I will highlight some of the configuration options here. Here is the default configuration you can paste these in to config/kibana.yml and then modify from the defaults:
xpack.infra.sources.default.logAlias: "filebeat-*"
xpack.infra.sources.default.fields.timestamp: "@timestamp"
xpack.infra.sources.default.fields.message: ['message', '@message']
Configuration is pretty simple, out of the box the lines that show up in the Logs UI are the message field of every index that matches the filebeat-* alias. So, what if you want to add in all of your Logstash indices? Simply modify the xpack.infra.sources.default.logAlias in config/kibana.yml entry like so and restart Kibana:
#xpack.infra.sources.default.logAlias: "filebeat-*"
xpack.infra.sources.default.logAlias: "filebeat-*,logstash-*"
Don’t forget to restart Kibana. Reopen the Logs UI and click on Stream Live and you should see all of your Logstash and Filebeat logs streaming into the Logs UI.
Note: If you prefer to use Elasticsearch aliases then just set xpack.infra.sources.default.logAlias to the name of the alias and then update the alias as you need to. Here is the equivalent using an alias of logs
Create the alias:
curl -X POST "localhost:9200/_aliases" -H 'Content-Type: application/json' -d'
{
    "actions" : [
        { "add" : { "indices" : ["logstash-*", "filebeat-*"], "alias" : "logs" } }
    ]
}
'
Update config/kibana.yml:
#xpack.infra.sources.default.logAlias: "filebeat-*"
xpack.infra.sources.default.logAlias: "logs"
Infrastructure UI
Motivation
I see three basic maturity levels of managing infrastructure:
- Finding out that something is broken, then opening a monitoring system to dig in.
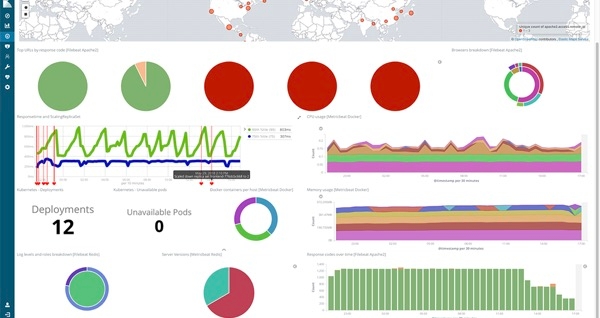
- Charting key indicators for all of the systems on a big dashboard and watching that, then digging in to the problems.
- Automating Ops with machine learning discovering normal behavior, detecting emerging issues, and alerting Ops.
The Infrastructure UI is designed to get Ops to the “charting key indicators on a big dashboard” stage. It's safe to say that we all need to get to the “automated with machine learning stage”; you can read more about Elastic machine learning, and if you watch the video at the end of this post you will see a workflow that starts with an alert from a machine learning job and moves along from there through APM and distributed tracing, the Infrastructure, and Logs UIs. Having all of the logs, metrics, APM, and distributed tracing all together in Elasticsearch allows you to use all of the analysis and visualization tools across all of your data.
User Experience
Three types of devices are supported today: hosts, Kubernetes (k8s) pods, and Docker containers. The power of the Infrastructure UI is that you can see the state of key indicators for a very large number of devices. At high volume, you have colored squares with no text until you drill into an interesting subset by using the search bar or clicking on a group. You can also launch into the logs for a device or display a metric dashboard.
I mentioned “key indicators”; at the moment this is the list, and they all come from Metricbeat:
Hosts: CPU, Memory, Load, Inbound Traffic, Outbound Traffic, and Log Rate
Kubernetes: CPU, Memory, Inbound Traffic, Outbound Traffic
Docker: CPU, Memory, Inbound Traffic, Outbound Traffic
Grouping enables you to zoom into the list of devices. If you support a particular application that is deployed with Kubernetes then the Namespace group is for you. If you think that an issue is related to a particular Node being overloaded then you might want to subdivide further by grouping by both Namespace and Node. Here is the list of groupings at the moment (and you can use up to two per device type):
Hosts: Availability Zone, Machine Type, Project ID, Cloud Provider
Kubernetes: Namespace, Node
Docker: Host, Availability Zone, Machine Type, Project ID, Provider
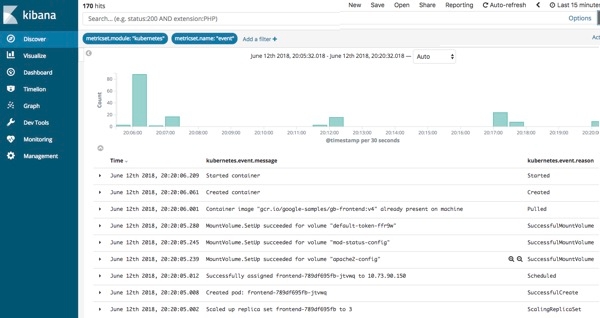
If none of the above groupings support the way you want to interact with your data, then use the search bar. Just start typing and the Kibana Query Language (KQL) autocomplete feature will guide you. I provided an example in the GIF of the Logs UI up top, as I started typing kubernetes Kibana offered labels and then tier, and then provided the possible choices based on what was indexed into Elasticsearch.
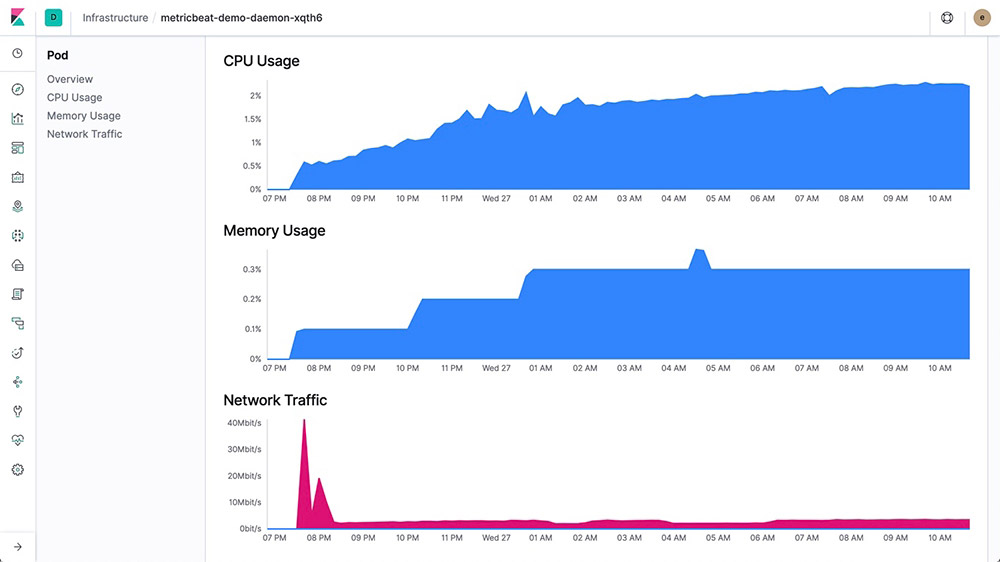
Once you group the resources you can drill into a group by clicking on it, this allows you to see more detail on that group. If a particular host, pod, or container interests you, then drill into the logs or metrics for it. Here is a portion of the metric view of a host:
Configuration
There is very little configuration to be done for the Infrastructure UI. Just deploy Metricbeat and enable the System module. If you are running containers, then also enable the Kubernetes and Docker modules.
Unless you have modified the default index pattern (metricbeat-*) you are done. If you need to customize things the Infrastructure UI docs will have the details, and I am including the key options here:
xpack.infra.sources.default.metricAlias: "metricbeat-*"
xpack.infra.sources.default.fields.host: "beat.hostname"
xpack.infra.sources.default.fields.container: "docker.container.name"
xpack.infra.sources.default.fields.pod: "kubernetes.pod.name"
Have your say
Both of these are beta UIs, and we would love your feedback (and keep the feedback coming even after they become generally available). Please tell us how you prefer to interact with your data. Are the groupings in this beta release of the Infrastructure UI sufficient to support the way that your team is organized? What would be better? Do we have the right metrics driving the colors? Do you need a different way to filter the logs in the Logs UI? When you launch into the metrics view from the Infrastructure UI are you seeing the metrics that you care about?
Head over to the Kibana Discuss forum and let us know what you like, dislike, need, etc. The developers read and respond to these discussions and love to hear from you. You can also open an issue, submit a PR, or keep an eye on either on GitHub.
Jump in and give it a try
Our live demo system has logs and metrics that you can search, visualize, and interact with. Head over and click on the Infrastructure tile to launch the Infrastructure UI:
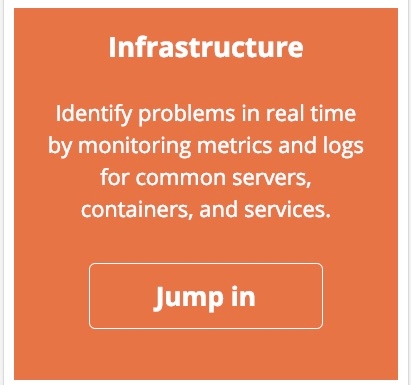
You can switch to the Kubernetes or Docker views, group the objects using the UI, or narrow the view with the search bar. Left click on a host, pod, or container and launch the Logs UI for that object. While you are at demo.elastic.co, have a look at some of the dashboards and visualizations. You can navigate to different areas from the landing page.
Watch a demo
Here is a video that shows the workflow of these UIs (also machine learning and APM with distributed tracing!). Thanks again for reading, and for your feedback!