Logs
editLogs
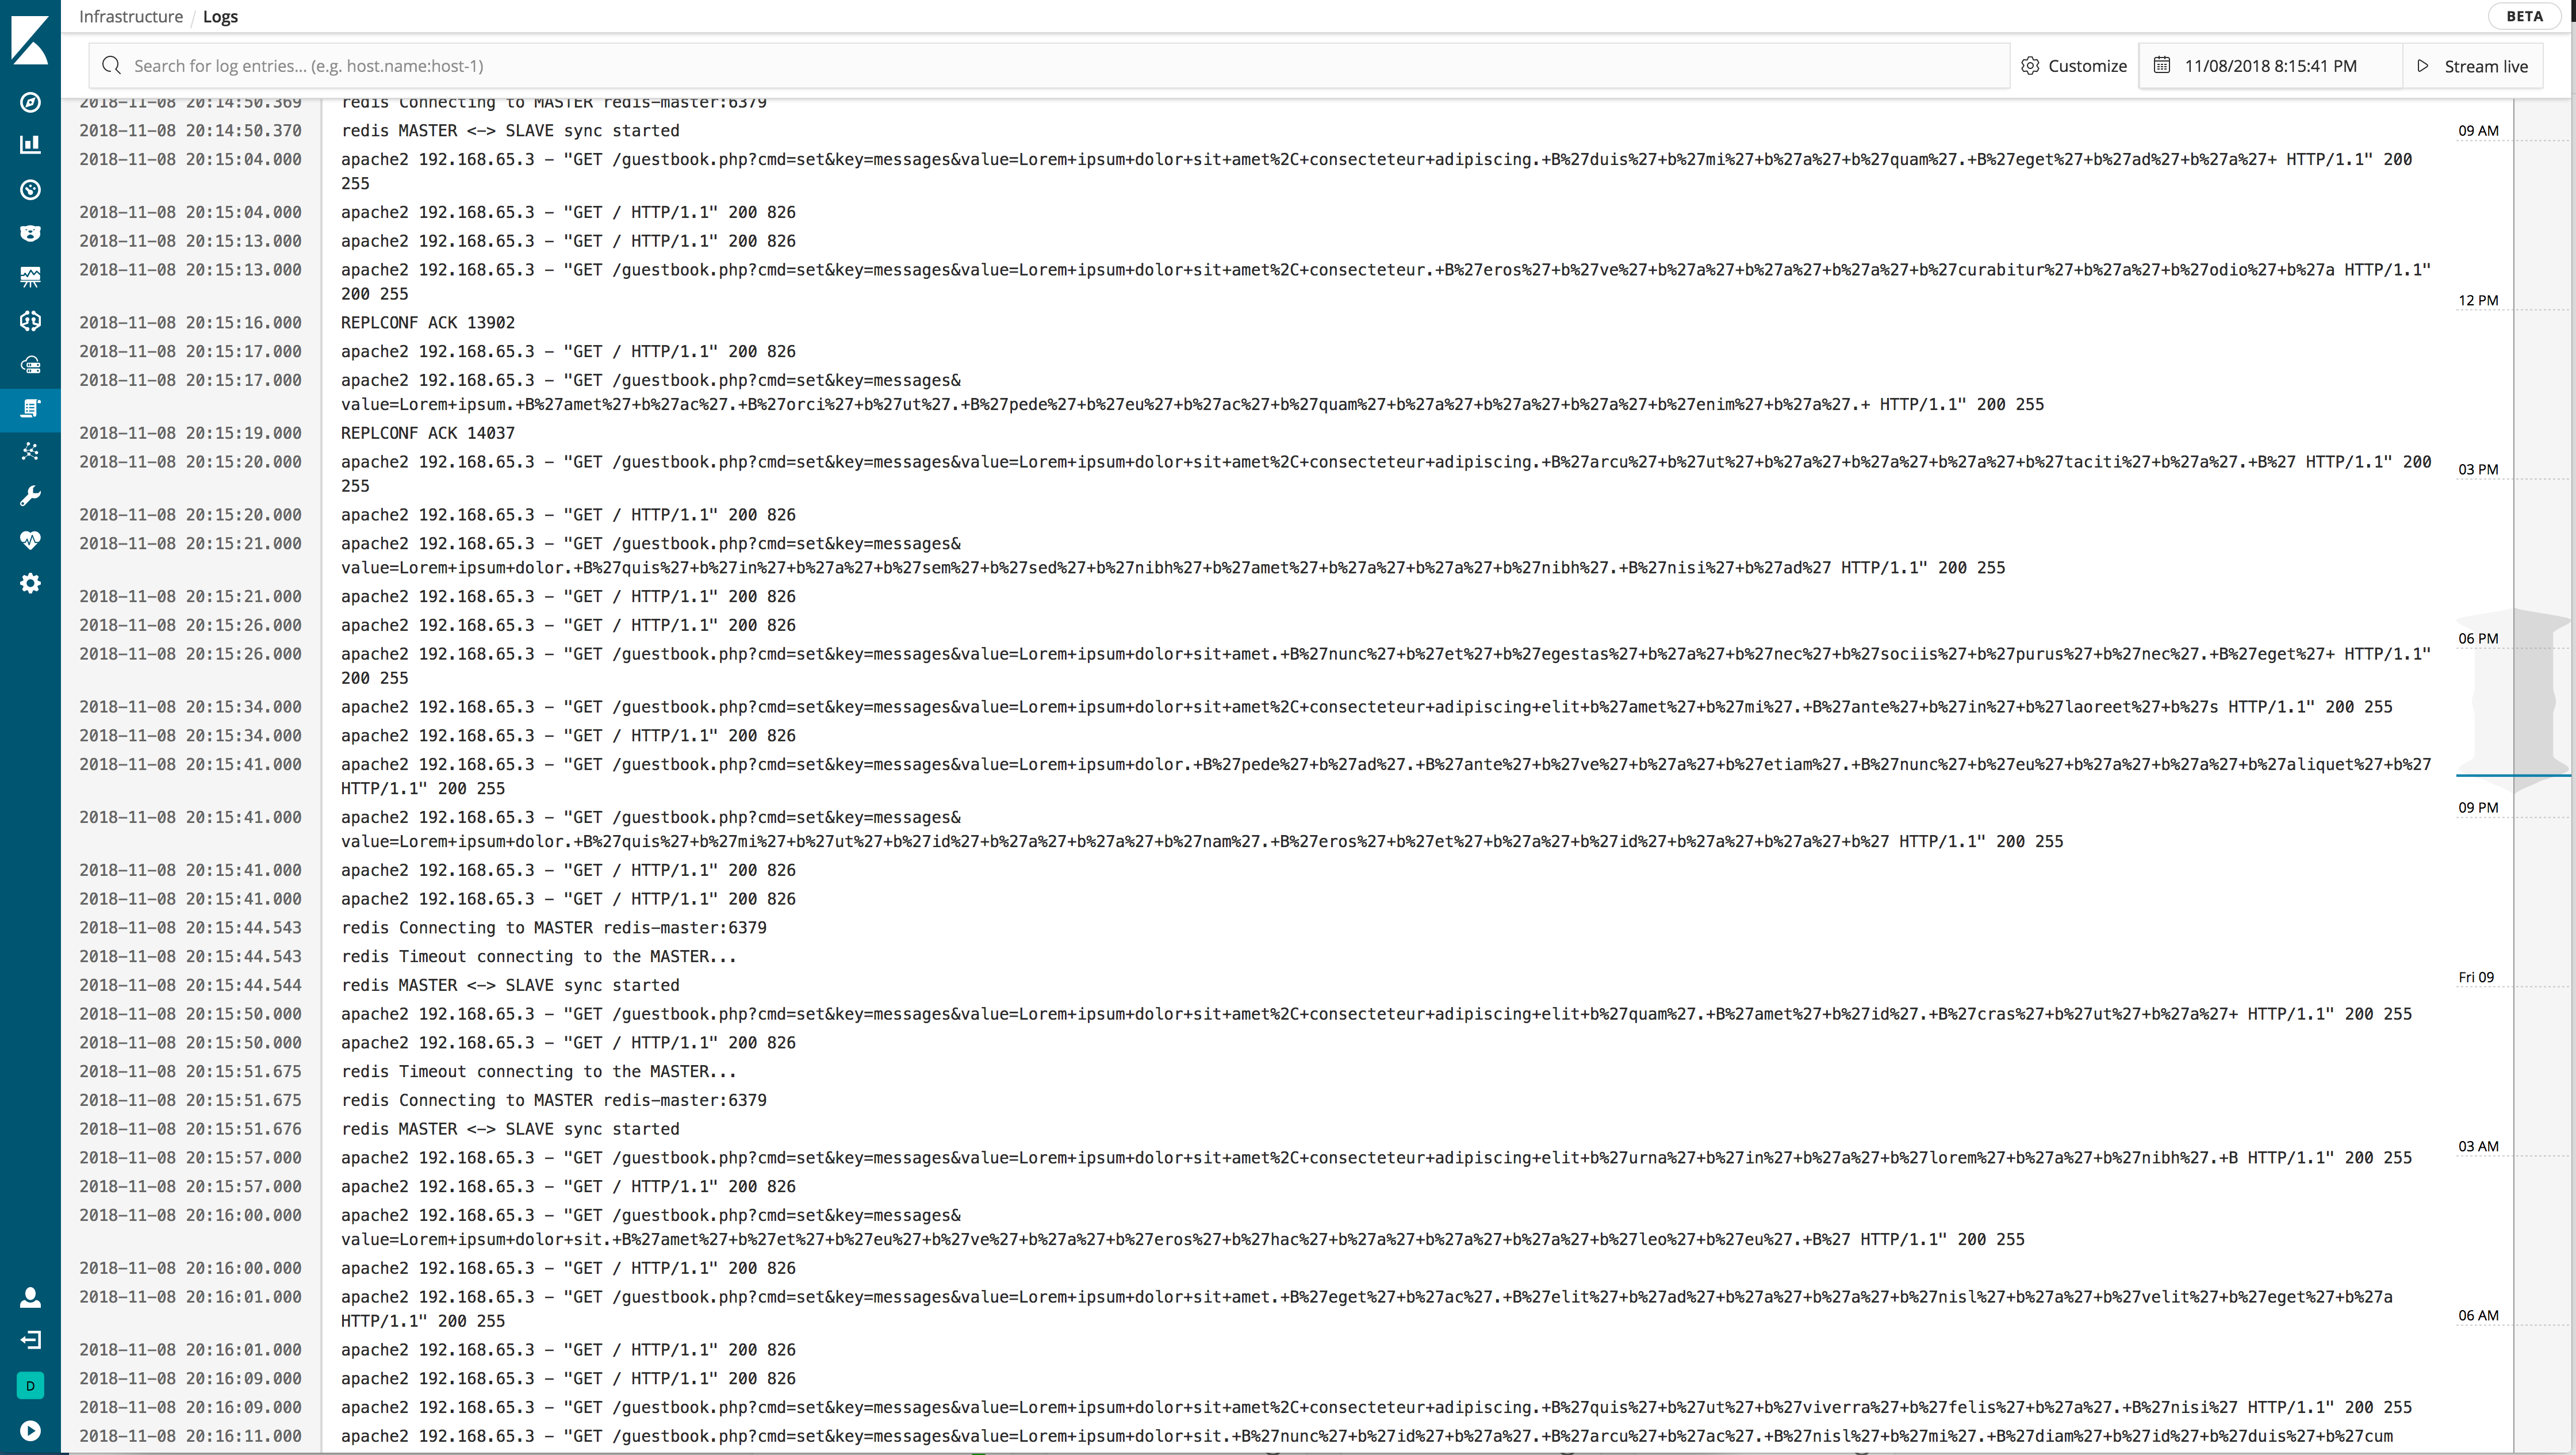
editUse the Logs UI to explore logs for common servers, containers, and services. Kibana provides a compact, console-like display that you can customize.
Add data
editKibana provides step-by-step instructions to help you add log data. The Infrastructure Monitoring Guide is a good source for more detailed information and instructions.
Configure data sources
editThe filebeat-* index pattern is used to query data by default.
If your logs are located in a different set of indices, or use a different
timestamp field, you can adjust the source configuration via the user interface
or the Kibana configuration file.
Logs and Infrastructure share a common data source definition in each space. Changes in one of them can influence the data displayed in the other.
Configure source
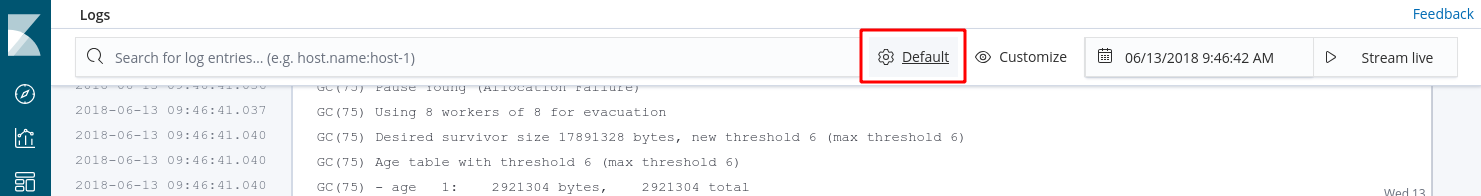
editConfigure source can be accessed via the corresponding
![]() button in the toolbar.
button in the toolbar.
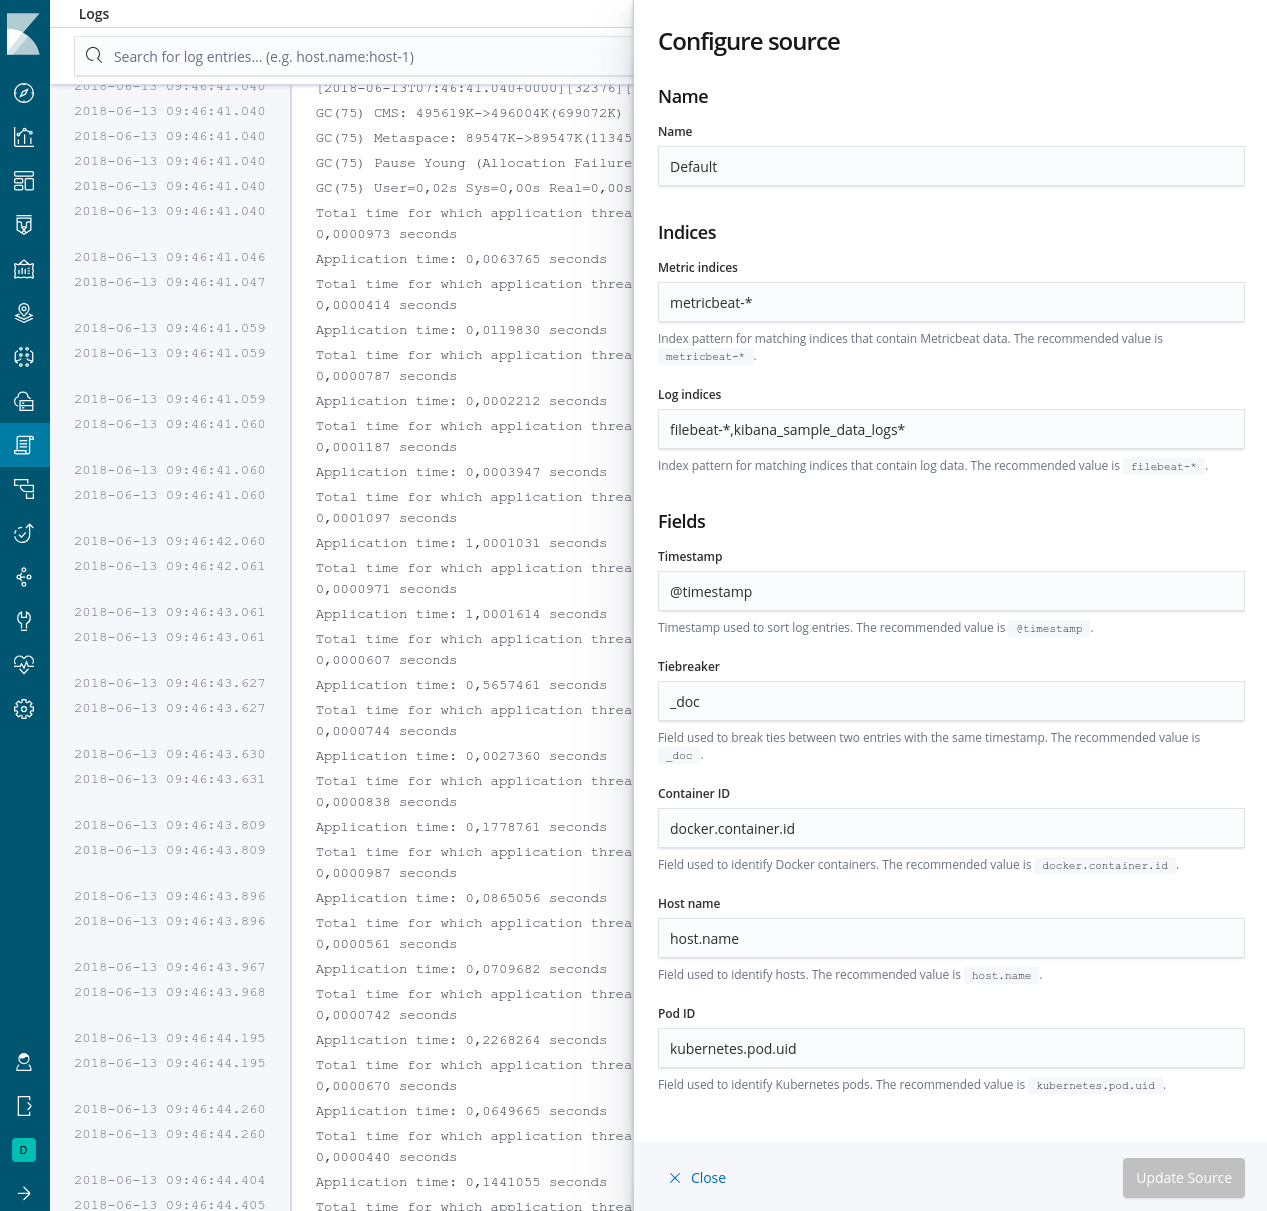
This opens the source configuration fly-out dialog, in which the following configuration items can be inspected and adjusted:
- Name: The name of the source configuration.
- Indices: The patterns of the elasticsearch indices to read metrics and logs from.
- Fields: The names of particular fields in the indices that need to be known to the Infrastructure and Logs UIs in order to query and interpret the data correctly.
If Spaces are enabled in your Kibana instance, any configuration changes performed via Configure source are specific to that space. You can therefore easily make different subsets of the data available by creating multiple spaces with different data source configurations.
Configuration file
editThe settings in the configuration file are used as a fallback when no other
configuration for that space has been defined. They are located in the
configuration namespace xpack.infra.sources.default. See
Logs UI Settings for a complete list of the possible entries.