IMPORTANT: No additional bug fixes or documentation updates
will be released for this version. For the latest information, see the
current release documentation.
System module
edit
IMPORTANT: This documentation is no longer updated. Refer to Elastic's version policy and the latest documentation.
System module
editThe System module allows you to monitor your servers. Because the System module
always applies to the local server, the hosts config option is not needed.
The default metricsets are cpu, load, memory, network, process and
process_summary.
Dashboard
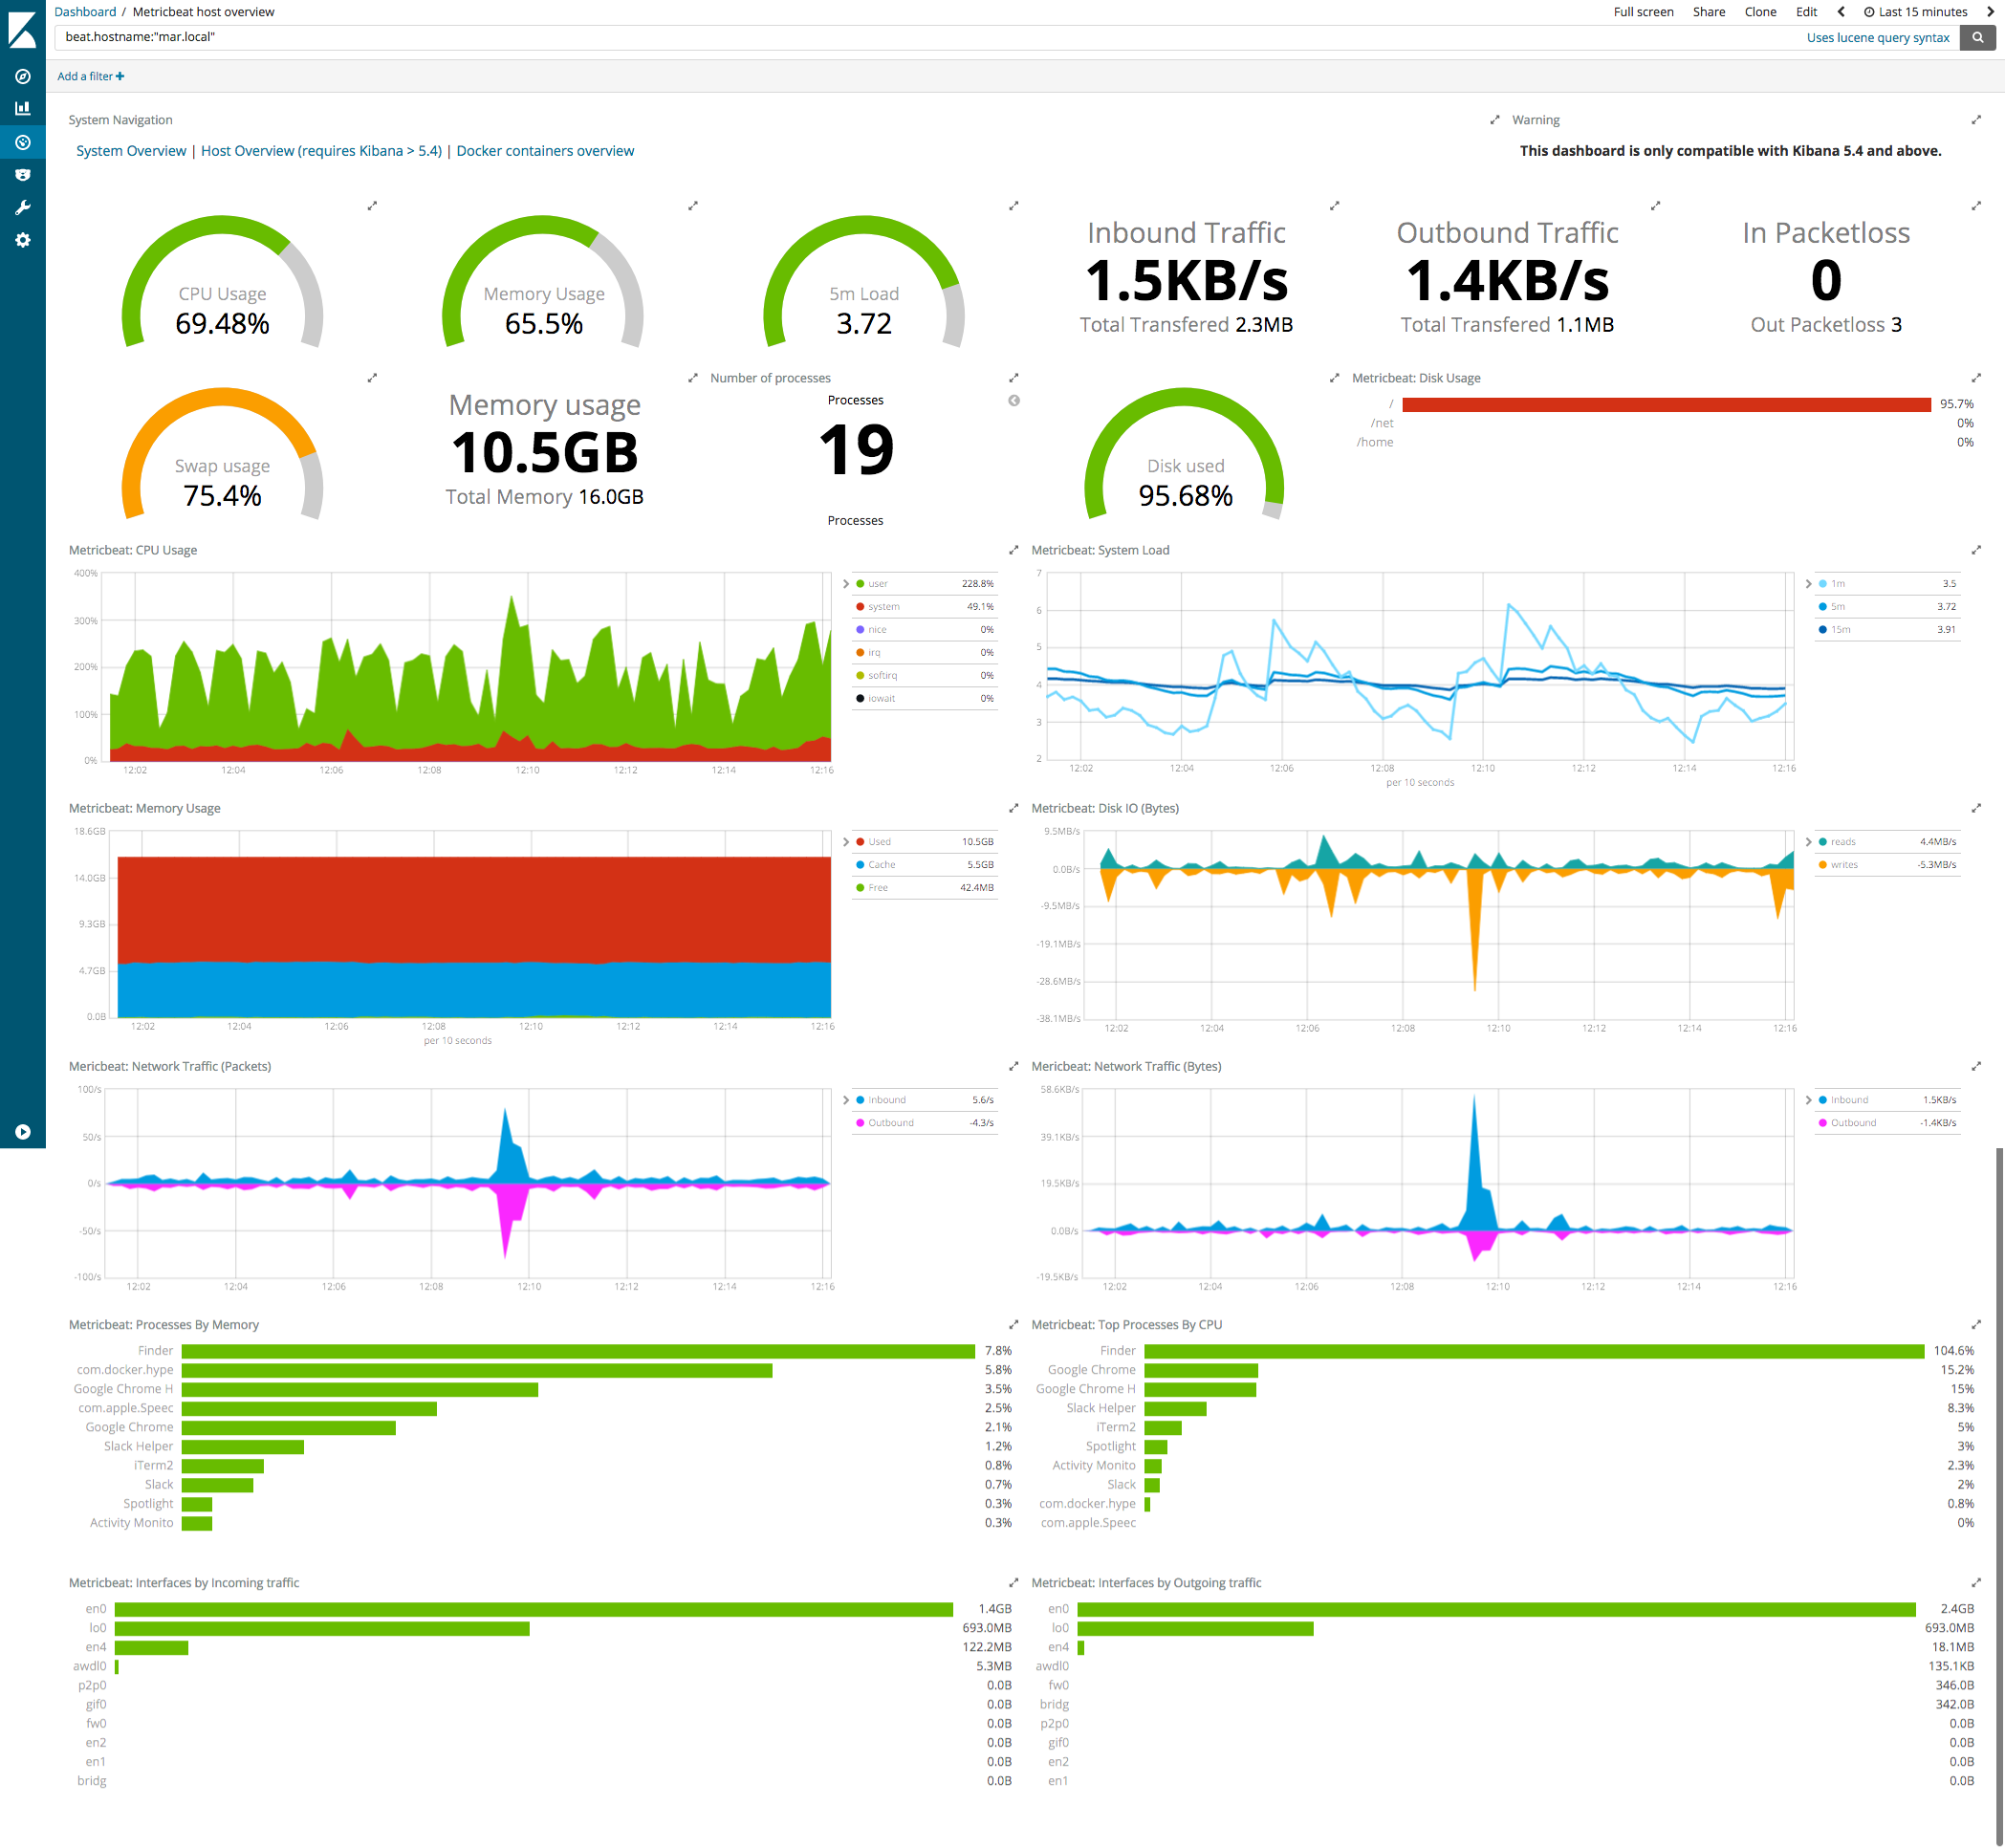
editThe System module comes with a predefined dashboard. For example:
Example configuration
editThe System module supports the standard configuration options that are described in Specify which modules to run. Here is an example configuration:
metricbeat.modules:
- module: system
  metricsets:
    - cpu             # CPU usage
    - load            # CPU load averages
    - memory          # Memory usage
    - network         # Network IO
    - process         # Per process metrics
    - process_summary # Process summary
    - uptime          # System Uptime
    #- core           # Per CPU core usage
    #- diskio         # Disk IO
    #- filesystem     # File system usage for each mountpoint
    #- fsstat         # File system summary metrics
    #- raid           # Raid
    #- socket         # Sockets and connection info (linux only)
  enabled: true
  period: 10s
  processes: ['.*']

  # Configure the metric types that are included by these metricsets.
  cpu.metrics:  ["percentages"]  # The other available options are normalized_percentages and ticks.
  core.metrics: ["percentages"]  # The other available option is ticks.

  # A list of filesystem types to ignore. The filesystem metricset will not
  # collect data from filesystems matching any of the specified types, and
  # fsstats will not include data from these filesystems in its summary stats.
  # If not set, types associated to virtual filesystems are automatically
  # added when this information is available in the system (e.g. the list of
  # `nodev` types in `/proc/filesystem`).
  #filesystem.ignore_types: []

  # These options allow you to filter out all processes that are not
  # in the top N by CPU or memory, in order to reduce the number of documents created.
  # If both the `by_cpu` and `by_memory` options are used, the union of the two sets
  # is included.
  #process.include_top_n:

    # Set to false to disable this feature and include all processes
    #enabled: true

    # How many processes to include from the top by CPU. The processes are sorted
    # by the `system.process.cpu.total.pct` field.
    #by_cpu: 0

    # How many processes to include from the top by memory. The processes are sorted
    # by the `system.process.memory.rss.bytes` field.
    #by_memory: 0

  # If false, cmdline of a process is not cached.
  #process.cmdline.cache.enabled: true

  # Enable collection of cgroup metrics from processes on Linux.
  #process.cgroups.enabled: true

  # A list of regular expressions used to whitelist environment variables
  # reported with the process metricset's events. Defaults to empty.
  #process.env.whitelist: []

  # Include the cumulative CPU tick values with the process metrics. Defaults
  # to false.
  #process.include_cpu_ticks: false

  # Raid mount point to monitor
  #raid.mount_point: '/'

  # Configure reverse DNS lookup on remote IP addresses in the socket metricset.
  #socket.reverse_lookup.enabled: false
  #socket.reverse_lookup.success_ttl: 60s
  #socket.reverse_lookup.failure_ttl: 60s

  # Diskio configurations
  #diskio.include_devices: []
Metricsets
editThe following metricsets are available: