Industrial Internet of Things (IIoT) with the Elastic Stack
The Industrial Internet of Things (IIoT) offers manufacturing companies the opportunity to get data from thousands of sensors and devices.
Linking this data together is important to monitor production processes and derive appropriate measures for further analysis. One of the key challenges is data collection and normalization to use it in context of predictive analytics or shop floor security.
Even small manufacturing companies often run multiple factories with hundreds of machines and thousands of sensors. New data is produced in milliseconds that easily sums up to terabytes, but it is neither stored nor analyzed and, thus, no value is gained.
With Elastic you can collect, enhance, and analyze IIoT data and help production supervisors gain deeper insights in the production processes.
— Marco De Luca, Principal Solution Architect @ Elastic
Being able to collect that data at scale will be an important differentiator. It enables optimization of the production processes leading to better efficiency as well as higher quality products.
Typically, manufacturers face at least one of the following challenges in addition to the general ones mentioned above:
- Manufacturing companies are innovative but still have a lot of old machinery, and those may remain there for several more years. A typical lifecycle is 10-20 years or more! How do you integrate those legacy machines into modern analysis platforms?
- There are sensors, self-driving vehicles, and other devices that need to be monitored. Only a complete view is a foundation that will help with predictive maintenance, operations, and so on. All the different kinds of devices use different technologies to communicate and have different connectivity to the internet.
- There are lots of proprietary solutions that are not communicating with each other. How do you get data from those systems and enable correlation with other machine data?
- Some manufacturing companies are already thinking about how to build a platform for machine data in order to monitor all of those systems, both new and old. How do you make use of the data, whether it be for operational/maintenance purposes or to build additional/new business cases and/or services?
There are a lot of benefits for companies who concentrate on collecting their machine data and analyzing it. It is not only possible to optimize production processes and increase the quality of products. Collecting and analyzing that data can do much more.
A well-designed monitoring solution, along with predictive maintenance, can also help to reduce costs dramatically. Sensor data can tell a lot about the condition of a device or the quality of the manufactured product. In addition, it helps to reduce consumption of resources. MM Karton has proven the potential of this by reducing raw material consumption by 20%.
Build the foundation of your IIoT data analysis
To be able to leverage this heterogeneous set of data, you need to store it in a separate environment that is able to scale with your needs. Elasticsearch is the perfect fit for this use case. It not only allows you to store many kinds of data at scale, but also enables you to analyze that data with machine learning capabilities and visualize the data in any way you like.
Once you are able to collect all the relevant data of each factory, imagine how an overall monitoring could improve the efficiency of your production plants. Storing all kinds of necessary data in Elasticsearch and combining the data from multiple assembly plants on one single screen using Canvas is as easy as building a slide for a presentation that is connected to live data.
You can see a few examples here:
Having this high-level view about multiple different assembly plants is nice, but you also want to know how well the different machines in each plant are performing. In addition to that, you need to be able to combine and correlate the different data models of each vendor.
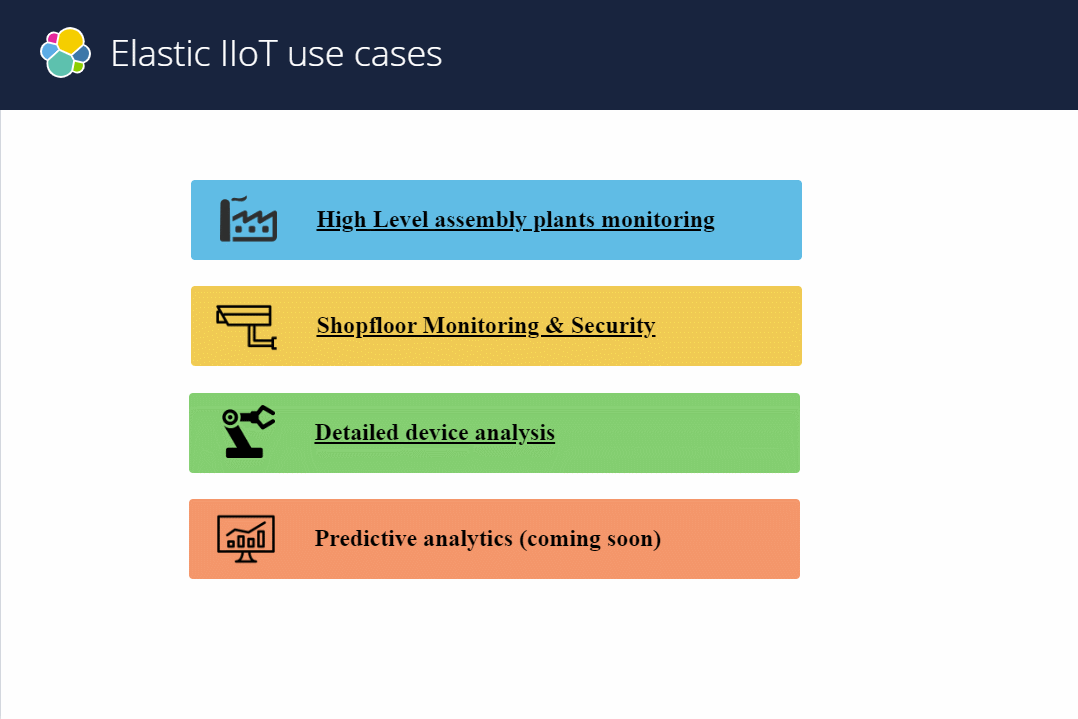
Typical IIoT use cases with the Elastic Stack
The following use cases are a few examples of using the Elastic Stack for IIoT data analysis and monitoring. There are many more such as automated responses to problems by interacting with your machines remotely.
Predictive analytics leading into predictive maintenance
Using sensor data is very effective for analyzing the health of IoT devices. Sensor data, such as air or oil pressure, temperature, voltage, speed, sound, frequency, or change in color/lightning can be used as an early warning mechanism for failures. Knowing that something will fail in the near future and react on that information helps reduce costs.
Furthermore, knowing the thresholds of sensor data or data ranges enables the production management to set individual maintenance plans on real data instead of rigid maintenance cycles where components are exchanged whether they tend to fail or not. Using this results in a dedicated and meaningful maintenance plan, which reduces costs and production down time.
Doing this requires considerable knowledge about the circumstances that lead to failures. Observing hundreds of sensors at once in real time and comparing this to historical events is hard for humans. For machine learning, this kind of job is a perfect fit. Finding anomalies per sensor, or correlating the data of all sensors to one single health score result, is really powerful.
Reject rate or scrap rate reduction
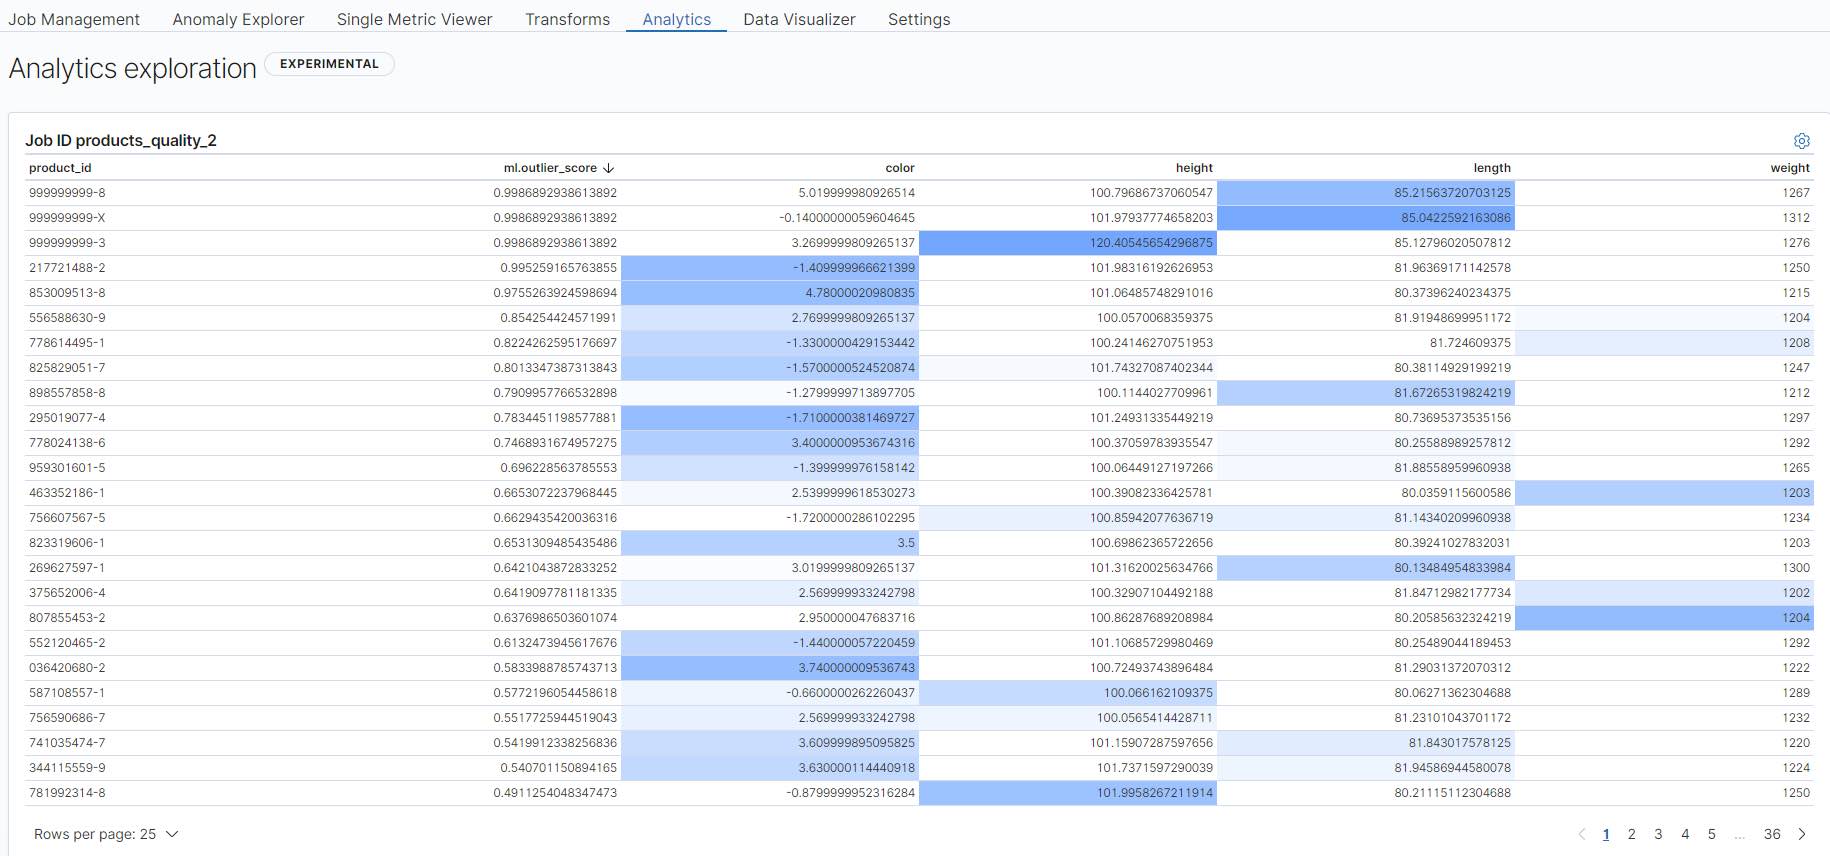
Another important KPI is the reject/scrap rate. Reducing the reject rate by knowing what part of the production leads to rejections is important. The machine learning–based outlier detection of the Elastic Stack helps to find products that differ from expected results. By using this detection along with the sensor data, problems can be found quickly and easy.
A well-designed machine learning job on the shop floor can finally result in a scenario where the machines are enabled to optimize themselves without human interaction.
Shop floor security
Today, security of IT-related systems is a well-known challenge. The security of a shop floor is often much harder to implement. The general concept, currently, is to prevent intrusion by disconnecting entire production facilities from the internet.
This is becoming increasingly more difficult. The growing impact of the “classic IT” (like ERP such as SAP PP or PLM) on SPS (such as Siemens SIMATIC) systems will finally result in direct communication — with all the good and bad. Demand is generated by the business — MoD (Manufacturing on Demand) is already present by 3D printing or laser cutting. For example, imagine fully automated production processes triggered by customized orders from any webshop. The risk of flying sparks from interconnected IT to the shop floor will become a new dimensioned risk. Shop floor security therefore will become a very important topic during the Industry 4.0 transition. With Elastic SIEM (security information and event management) in combination with the possibility to collect all relevant data, your smart factory can be monitored for security events, too.
Collecting and analyzing different IIoT data sources with the Elastic Stack
The needed analysis capabilities have already been implemented in the Elastic Stack for a long time. The hard work was to get the data of the different data sources into the stack.
Collecting data from all the various data sources existing in a production plant can not be done in just one single way. You need to put multiple data sources together. Because Elastic is an open, real-time data platform, it's easy to use its ecosystem to integrate all types of data sources.
There are many different systems in a manufacturing plant that need to be monitored, from very old systems (perhaps running control software using Windows 95 or older) up to the latest technology running Linux and OPC-UA. We are mainly talking about the following types of systems:
- Manufacturing control software like IBM MQ, that is used to control the manufacturing process within a plant and also between plants.
- Programmable logic controllers (PLCs) are a distinctive form of computer device designed for use in industrial control systems. It is a special purpose "industrial PC" that controls sensors and actuators; for example, it controls machines producing paper products in the paper industry or can also control lifts and escalators. There are many use cases of what can be controlled by a PLC.
- Industry robots, like those made by KUKA (German/Chinese manufacturer). KUKA robots come with an OPC-UA server included, which can control the KUKA robot, but at the same time interact with other robots and systems on the manufacturing floor. OPC-UA is also able to interconnect systems via the internet and thus, it will be exposed to security threats. That is why security plays an important role in the OPC-UA specification, but it also needs monitoring by monitoring platforms like Elastic.
- Sensors and other autonomous vehicles or devices are mostly used to measure temperature, humidity, speed, acceleration, positioning, vibration, or other metrics needed to correlate them with the production process data. For example, temperature and humidity changes can affect a robot's operation and cause more heavy vibration that can cause the robot to fail or produce bad quality products. Thus, sensors and robot data are important to customer operations.
Data collection from PLCs, MQTT brokers, and OPC UA servers
To collect all of this near-real-time data, we can use Machinebeat — a community Beat that is able to collect data from MQTT brokers and OPC UA devices. The MQTT module of it is also capable of collecting data from different IoT cloud service providers, such as AWS IoT core or Azure IoT Hub.
To collect data from PLC devices, there is an integration with the Apache Project PLC4X as a Logstash plugin, which enables customers to collect metrics from all PLC4X-supported PLCs. More in-depth information about PLC4X in combination with Elasticsearch can be found in this blog post from our partner Codecentric.
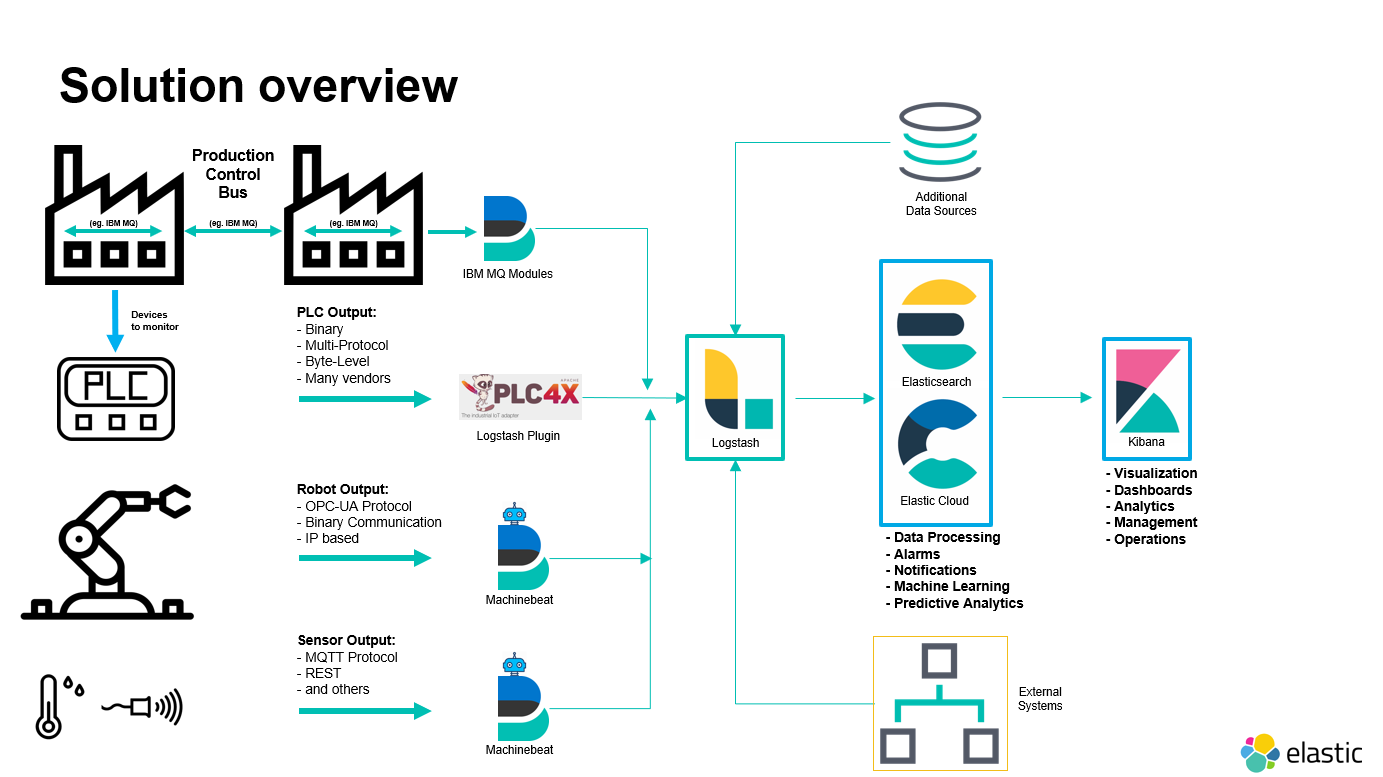 Solution overview for data collection, enrichment, and analysis for all of your data
Visualize your data with Kibana
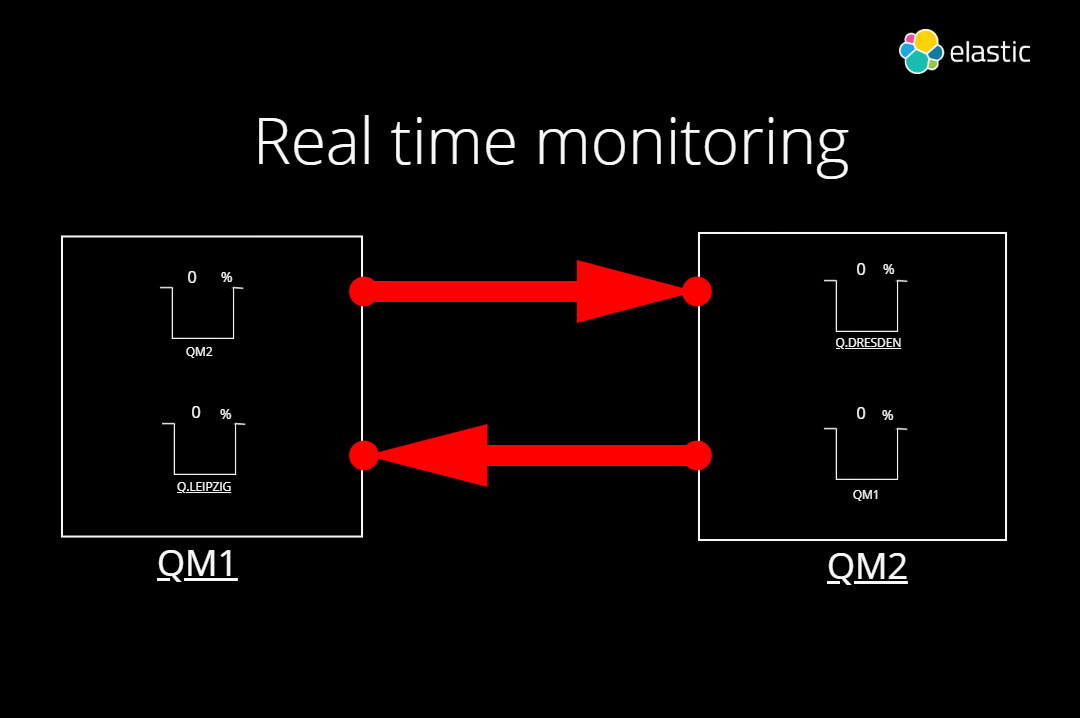
Having all this information results in a new challenge. Storing that much data is only useful if you can get value out of it. Value can get generated by getting better insights into what is happening. Visualizations can help. The following example visualizes the messaging between multiple queues in an IBM MQ controlled manufacturing environment. In legacy monitoring systems, you need to have specific knowledge about the things you are monitoring. By using Canvas, you are able to abstract the specific knowledge and provide easy color-coded feedback about the current situation.
Try it out for yourself
- Start up a 14-day, free trial of Elasticsearch Service, which will provide you with the foundation of your IoT monitoring solution.
- Go to Github and download the Linux or Windows version of Machinebeat.
- Follow the steps in the Configurations section of the Readme to either configure a connection to a free OPC-UA server or enter the credentials to our own OPC-UA server. Alternatively you can follow the steps to configure a MQTT broker and collect data from various sensors via that broker.
- Once the data is flowing, build your own dashboards to visualize/analyze your data. Canvas is another great alternative to visualize your data, letting you create presentation slides with real-time data. To learn more, check out the Getting started with Canvas blog.
Let us know what you think! Reach out on our Discuss forums, or enter a PR in GitHub.