How to embed Kibana dashboards


 Share on Twitter
Share on Twitter

 Share on LinkedIn
Share on LinkedIn

 Share on Facebook
Share on Facebook

 Share by Email
Share by Email

 Print this page
Print
A frequent ask of frontend engineers like myself is to embed existing dashboards from sources such as Kibana® into a JavaScript web application. It's a task I had to perform on several occasions as we wanted to deploy user-generated views quickly or allow users control over a given view. Judging by the regular questions we get from the wonderful developer community, I'm not alone.
Data visualization tools such as Kibana dashboards allow even the least design or technically inclined user to create views quickly and easily on top of Elasticsearch® data and prototype views. Indeed, it means that the embedding of a dashboard into an existing web application is the most difficult part — especially if we want to integrate custom web controls to drive the view of data to provide a consistent style and experience to users.
Here I'll walk through through code examples of how to embed Kibana dashboards in a web app using HTML iframes. I'll also cover Kibana authentication for these views and how to wire custom controls to embedded views using JavaScript.
What is an iframe?
Both examples covered in this piece make use of an iframe to embed our dashboard. An iframe, denoted by the <iframe> HTML tag, allows you to embed another web page in the current document. Specifically, we shall be including the Global Flight Dashboard loaded from the Sample flight data sample data set into our own Elastic® deployment within our page.
When embedding other sources in your application, it's important to ensure this is a trusted source of data that users should have access to. We must make use of appropriate content security policies, use of restrictions with the sandbox property, and entitlements to limit the actions of the embedded content. By not specifying the sandbox attribute in our iframe, we include all restrictions by default.
Performance is also something to be reflected on when including third-party content in your application. As iframes can consume more bandwidth than other resources, using many of them in a single application can slow down the entire application. For those looking to embed multiple Kibana dashboards in your application, try to limit the number included as much as possible and conduct application performance testing. While it's easy to add components and dashboards, as developers we need to ensure we provide the data users need rather than every shiny control that they want. So when picking between dashboards and visualizations, work with consumers to identify what they really need.
Basic embedding with HTML iframe
The code for including the Global Flight Dashboard in your web application, as covered in this basic example, is easily generated from Kibana via the Share option:
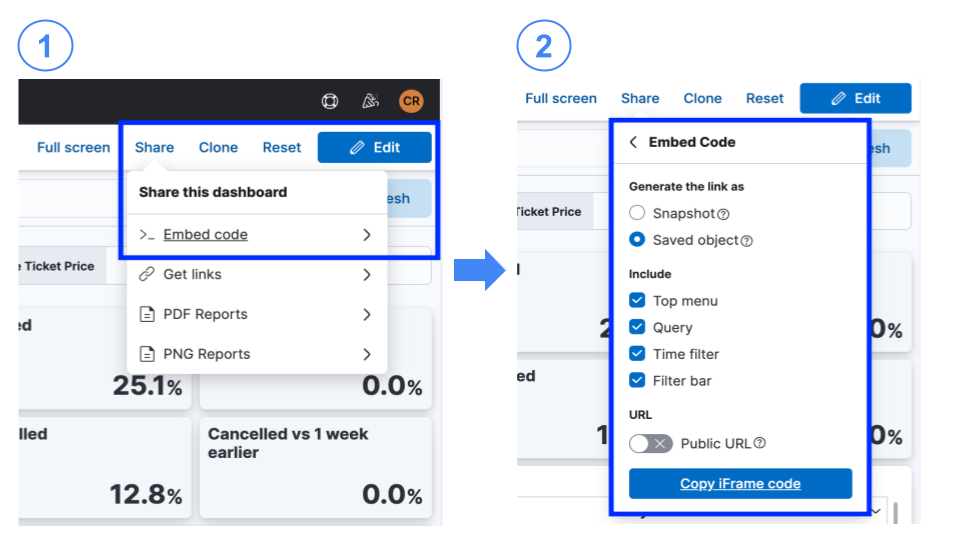
An iframe snippet adding in the relevant options you have selected, along with the current filters, is generated for you to paste into your HTML:
<iframe src="https://my-deployment:9243/app/dashboards#/view/7adfa750-4c81-11e8-b3d7-01146121b73d?embed=true&_g=(refreshInterval%3A(pause%3A!t%2Cvalue%3A0)%2Ctime%3A(from%3Anow-1y%2Fd%2Cto%3Anow))&show-top-menu=true&show-query-input=true&show-time-filter=true" height="600" width="800"></iframe>The generated snippet is making use of pixel measurements for the width and height of the iframe. Sizing has commonly been a challenge to ensure the iframe size reflects the content within. Best practice is to consider sizing the iframe relative to the viewpoint using viewport sizing attributes vw and vh, or media queries for handling multiple different device sizes as part of modern responsive design.
Given the number of settings available, it can be confusing to figure out what you need. The options allow you to configure the state of the dashboard and the controls visible within the iframe.
The type of URL to generate can be one of two distinct options:
- Snapshot: A URL encoding the full current state of the dashboard, meaning that changes to the dashboard are not present in the embedded version.
- Saved object: Use a URL referencing the saved object ID of the dashboard, meaning that any changes made to the dashboard after the URL is generated will be visible to users of the JavaScript application.
The author's experience is that these dashboards are subject to change. Therefore the Saved object option would be the most appropriate option for embedding to ensure dashboard changes made after the URL was generated are visible.
The Include settings denote the additional controls to include at the top of the embedded dashboard:
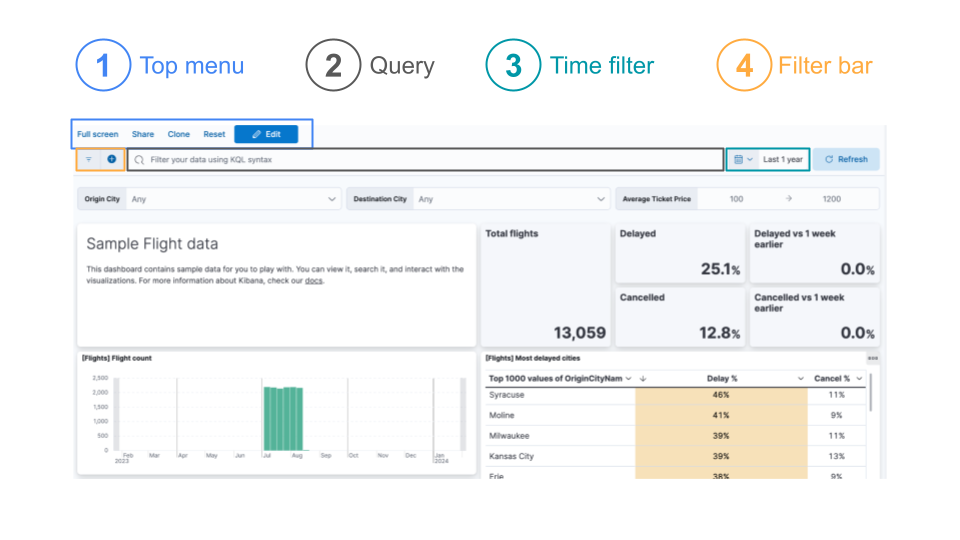
- Top menu: Settings containing the dashboard functions such as edit and full screen, controlled by including show-top-menu=true in the Kibana URL.
- Query: The KQL query bar allows you to filter the data visible in the dashboard, represented by the show-query-input=true URL parameter.
- Time filter: The date picker for selecting the date range for the data in the dashboard, enabled using show-time-filter=true within the URL.
- Filter bar: Hiding the settings to add filtering of the data, which requires setting hide-filter-bar URL parameter to true.
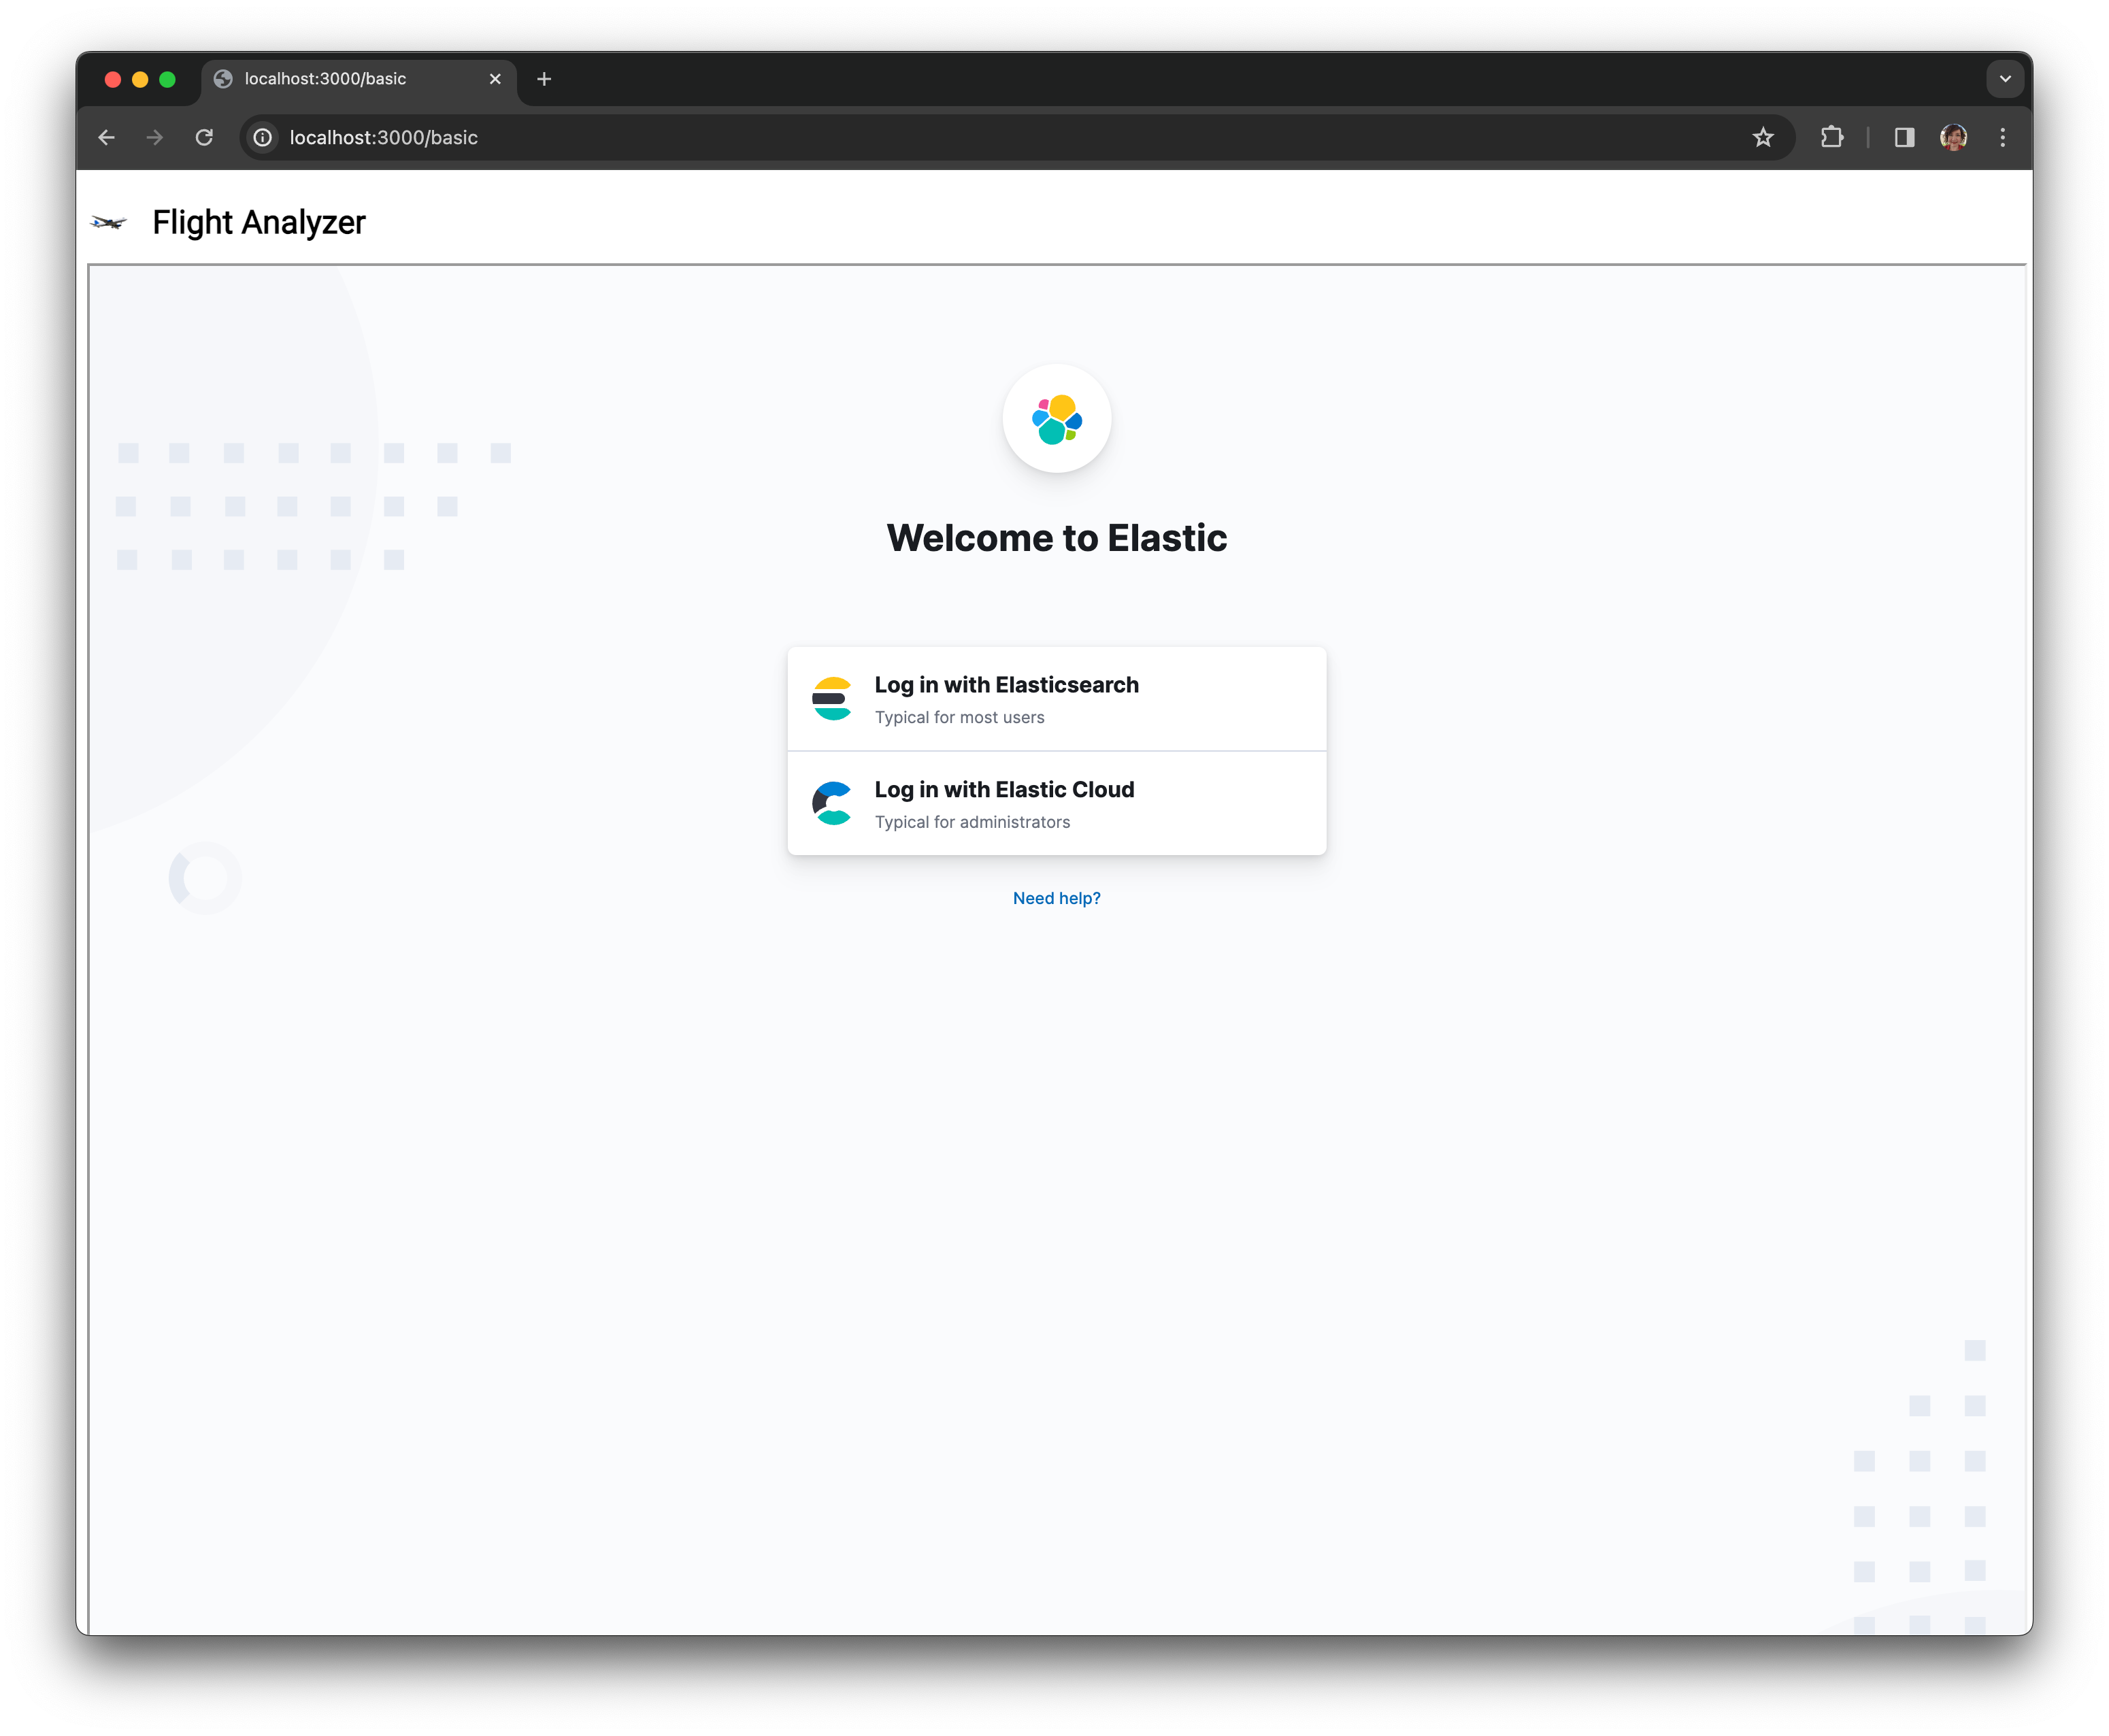
Without using the public URL, we will be prompted to log in to access the dashboard. At this point, the experience isn't seamless but the dashboard is accessible to those with login credentials.
Automatic login
To ensure the dashboard is automatically displayed, authentication needs to be integrated with the dashboard in Kibana to eliminate the need for users to enter their credentials for both the JavaScript application and the dashboard. This provides a seamless experience. This can be done in one of two ways:
Enable anonymous authentication to give a default set of credentials and entitlements to any incoming requests where no authentication token can be extracted (available on the free tier).
Add support for SAML single-sign-on, or SSO, provider to redirect unauthenticated users to the SSO portal, and pass authenticated users straight through to the dashboard. This is a licensed feature.
Here we will cover the anonymous option. Firstly, we need to add an anonymous authentication provider anonymous1 to our kibana.yml:
xpack.security.authc.providers:
anonymous.anonymous1:
order: 0
credentials:
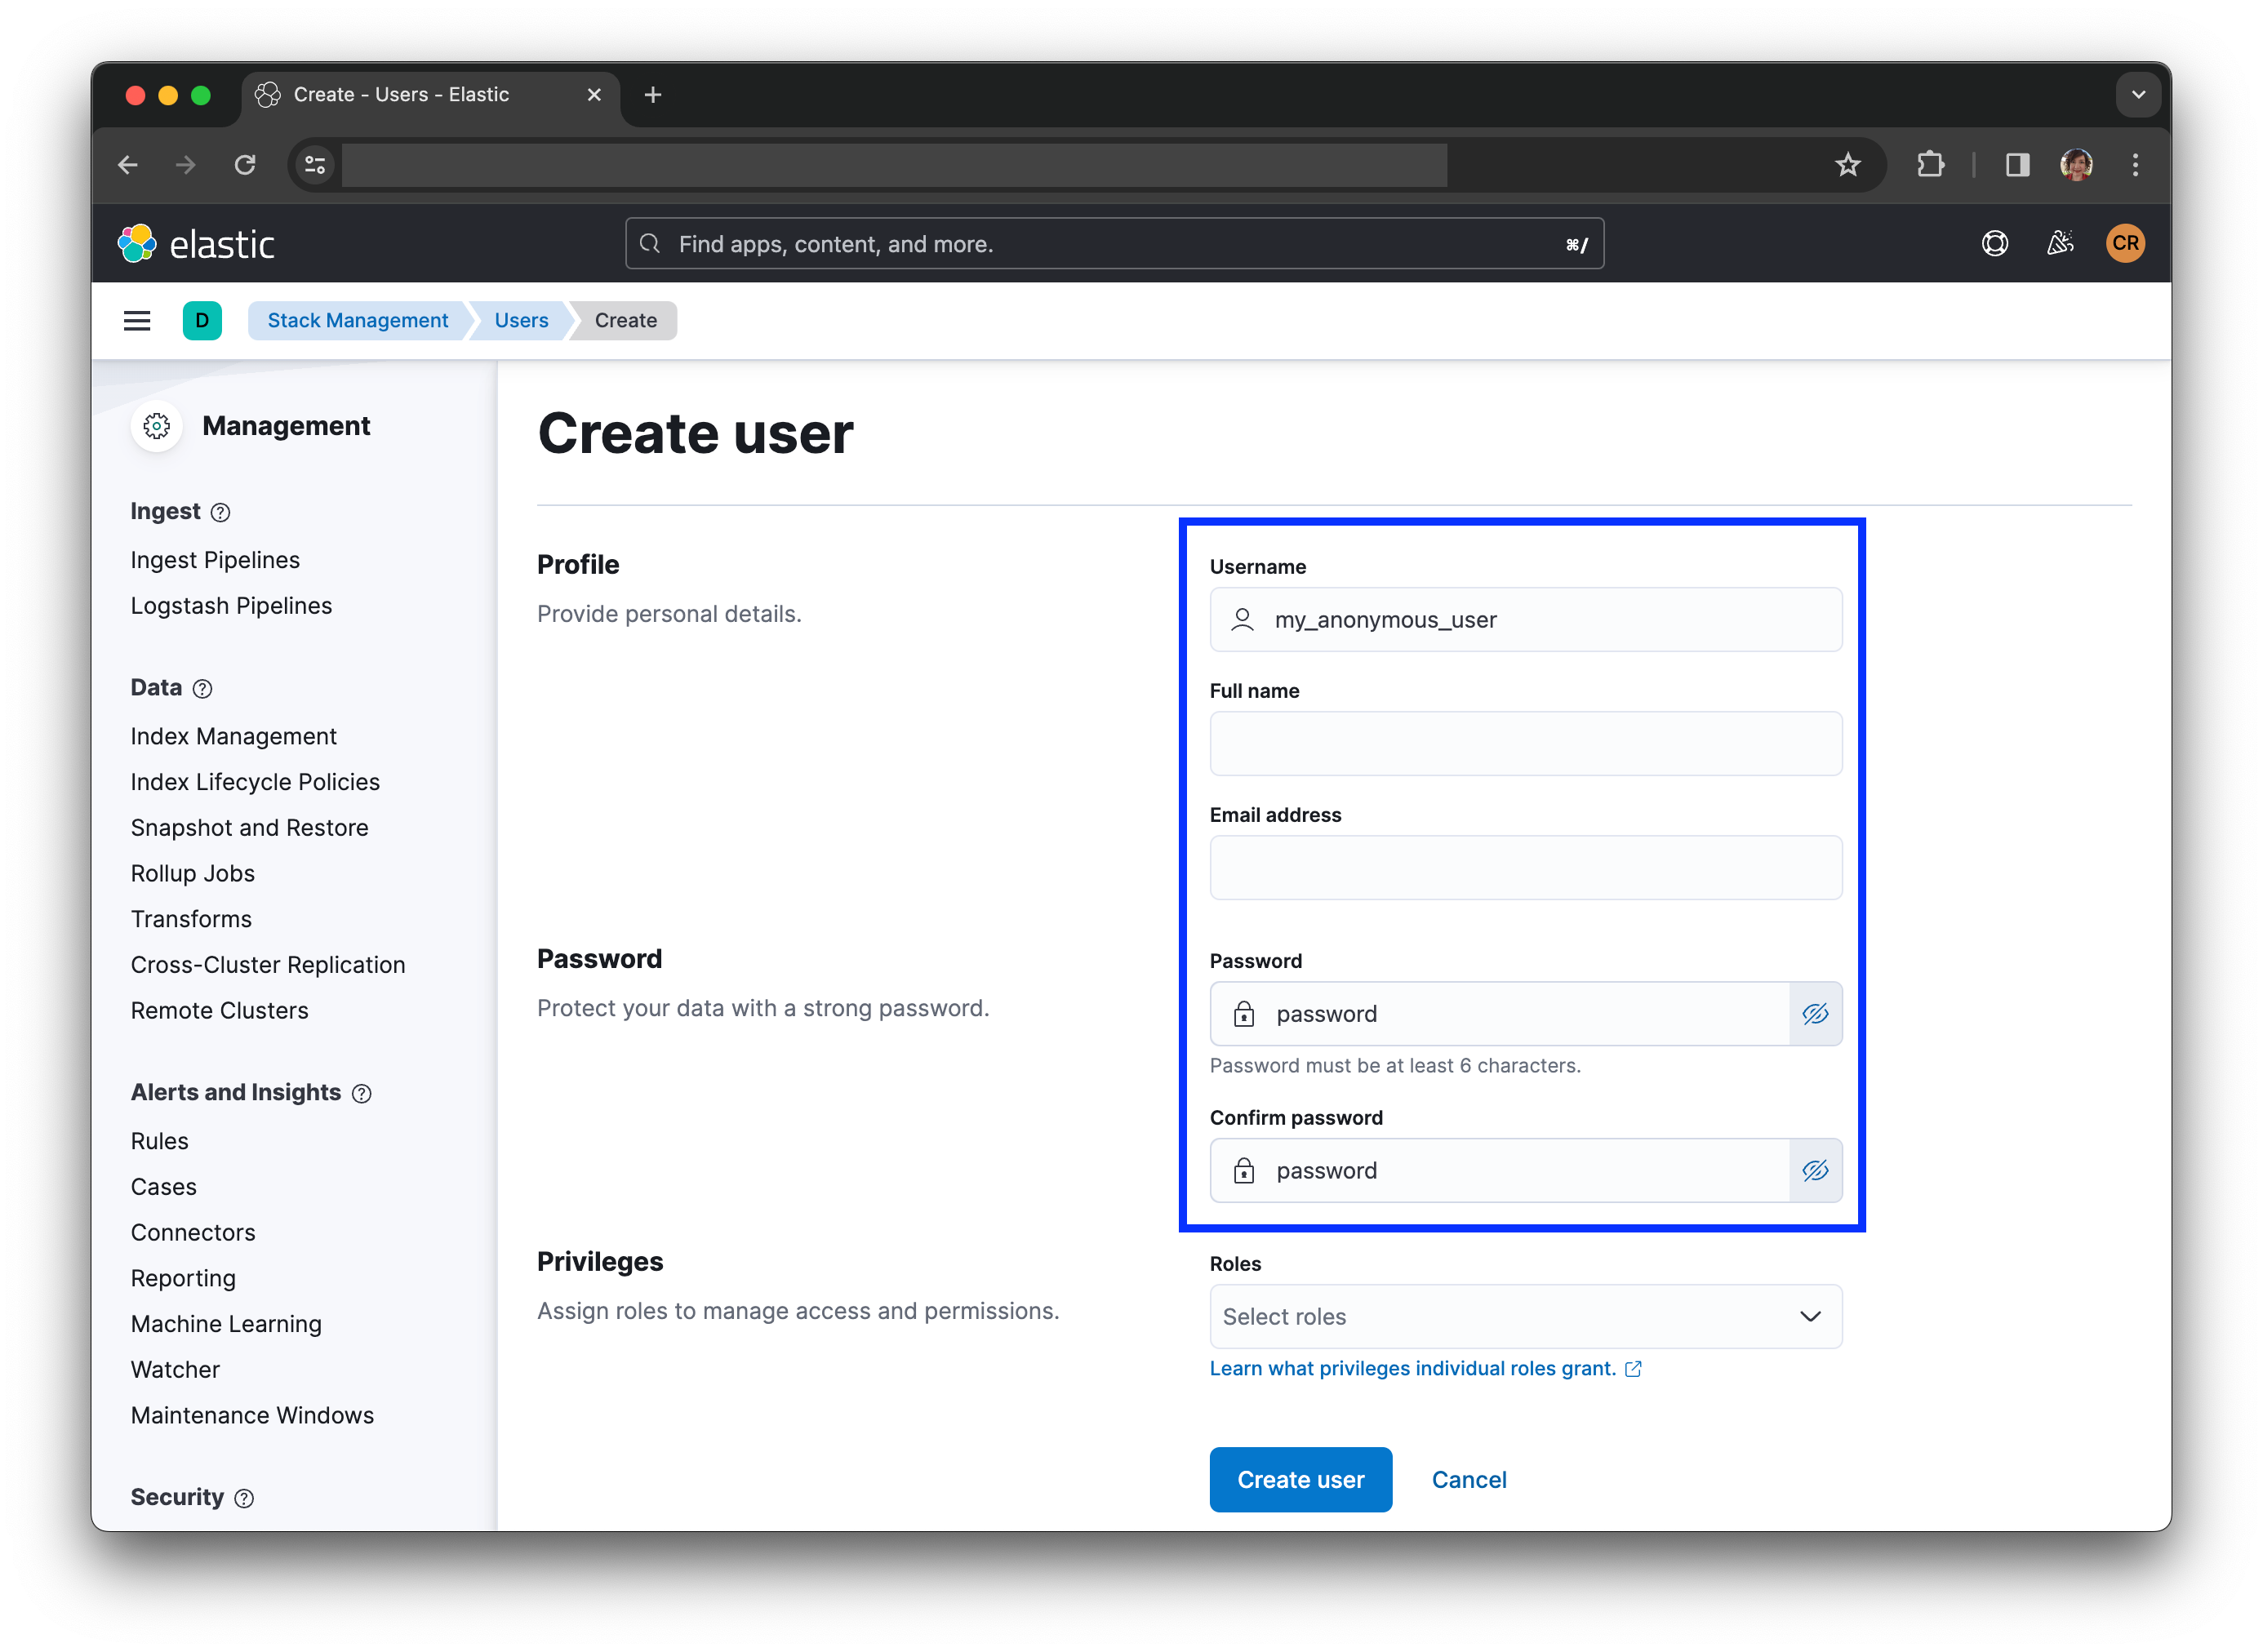
username: "my_anonymous_user"
password: "password"The iframe URL must also be regenerated to specify the auth_provider_hint parameter to link the configured credentials for provider anonymous1 to the embedded content:
<iframe src="https://my-deployment-9f9945.kb.eu-west-2.aws.cloud.es.io:9243/app/dashboards?auth_provider_hint=anonymous1#/view/7adfa750-4c81-11e8-b3d7-01146121b73d?embed=true&_g=(refreshInterval%3A(pause%3A!f%2Cvalue%3A120000)%2Ctime%3A(from%3Anow-1y%2Cto%3Anow))&show-time-filter=true" height="600" width="800"></iframe>Failure to include the auth_provider_hint=anonymous1 parameter will result in being unable to continue to the dashboard as a guest. Similarly, without a corresponding user role registered in Kibana with the correct username and password, it will result in authentication errors:
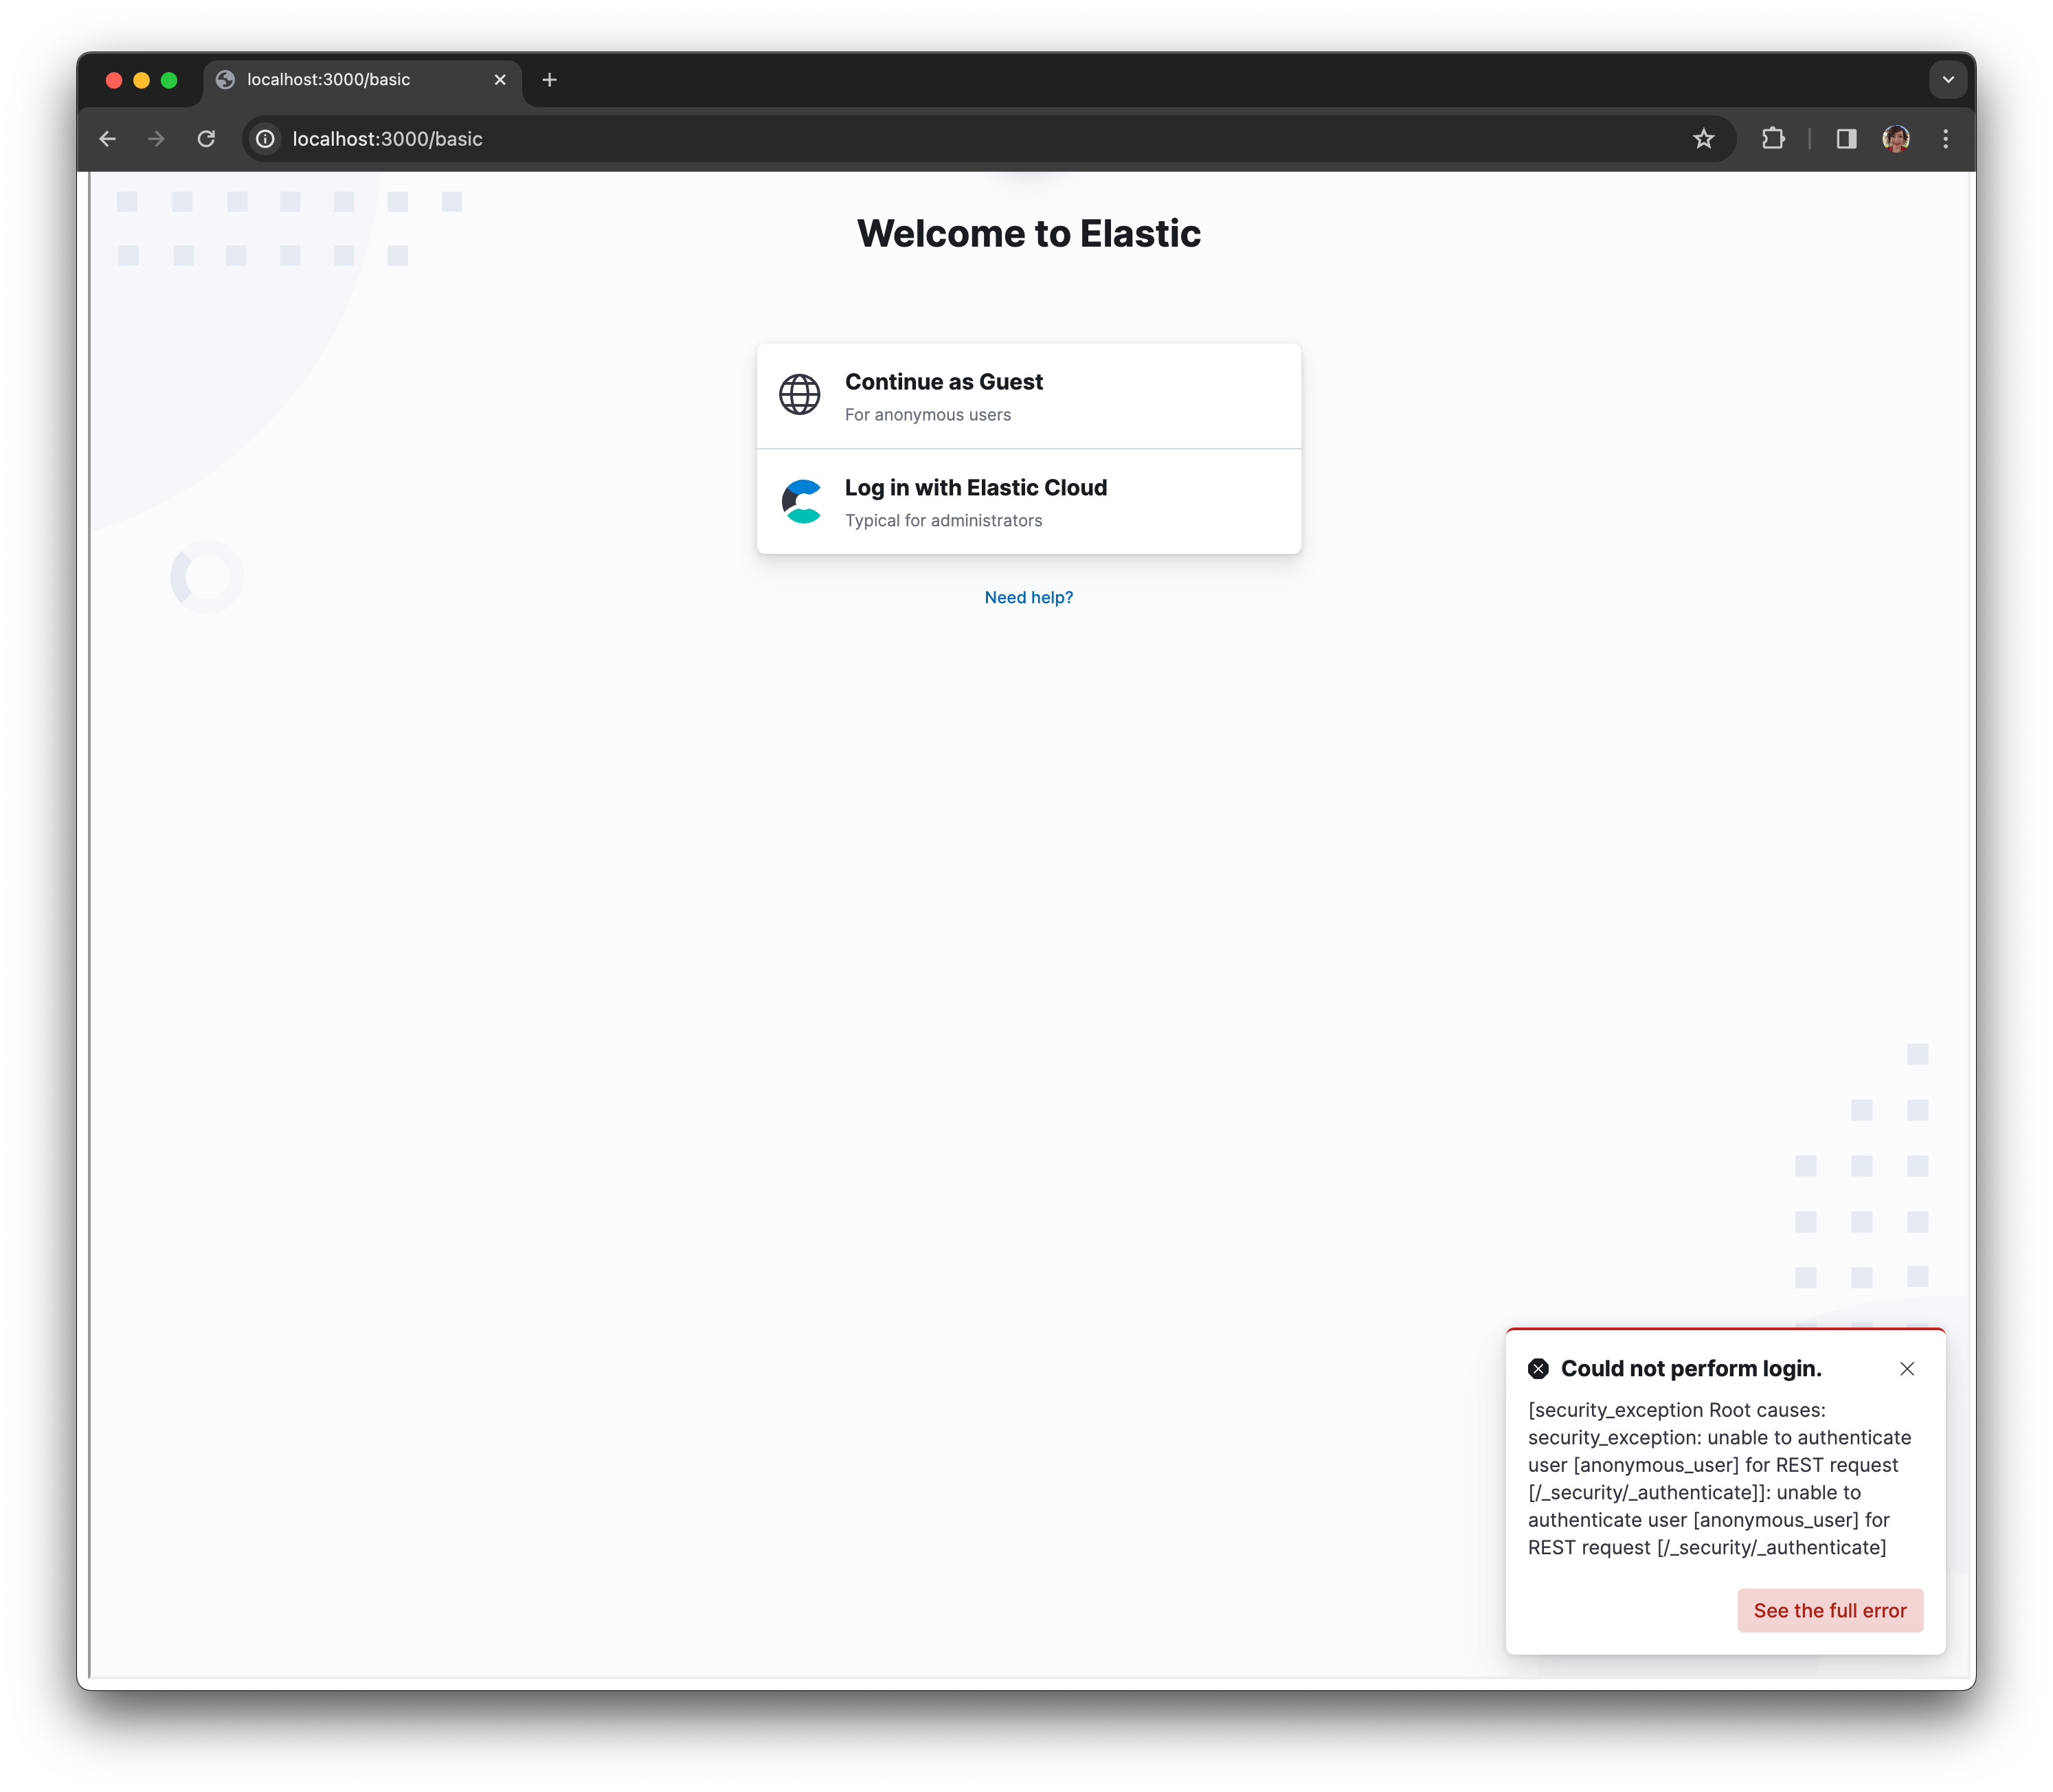
To correct this, please ensure that you have a user registered with the correct password matching that of the provider configuration in your kibana.yml. It's recommended that you restrict the privileges of this account to the minimum required given that access will be granted to unauthenticated users.
At this point, you may think you're all set. However, when you go to connect to your dashboard you'll see some strange repeated refresh events occurring:
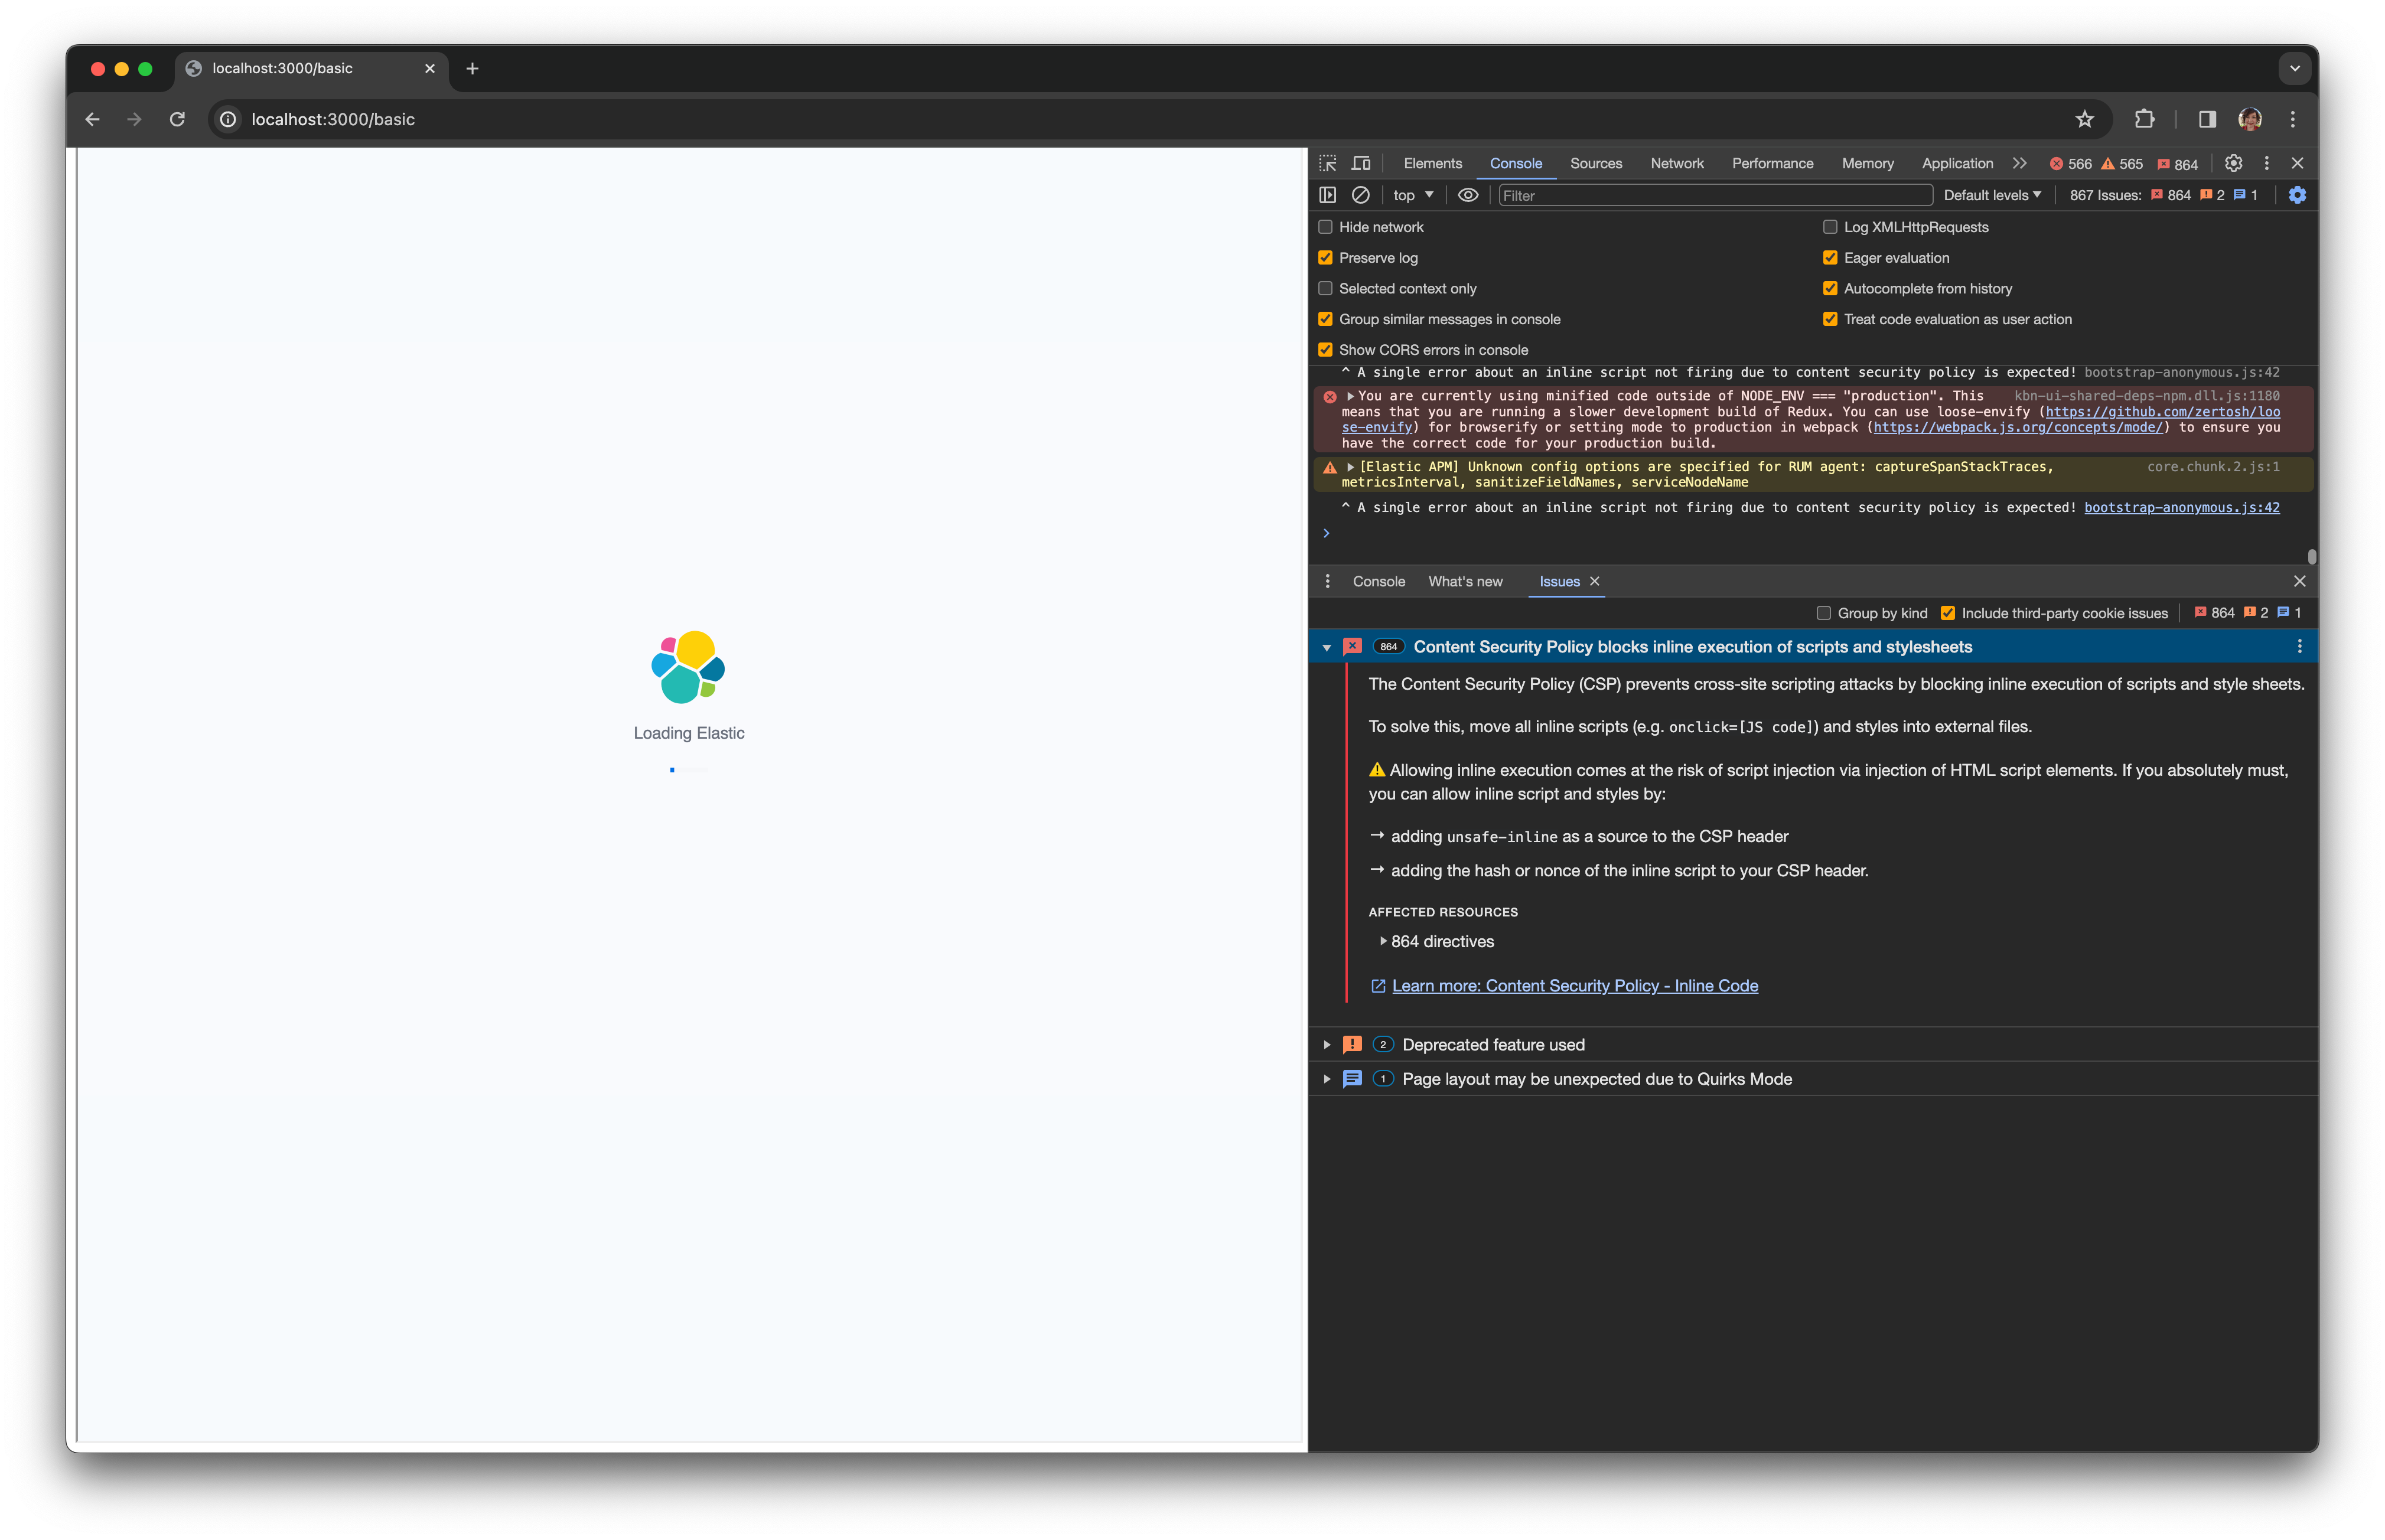
This issue is caused by the browser blocking the Kibana dashboard. Modern web browsers enforce the same-origin-policy to restrict the content of embedded content. Two URLs share the same origin if they have the same protocol, port and host. In plain English, any content coming from a different origin will be blocked by default unless allowed by the content policy.
To allow the browser to transmit session cookies to the Kibana server in your ELK stack with security features enabled, which is the default as of Elastic v8.x, you must configure the sameSiteCookies option in kibana.yml:
xpack.security.sameSiteCookies: "None"With this final step, we can see our Kibana dashboard embedded within our JavaScript application:
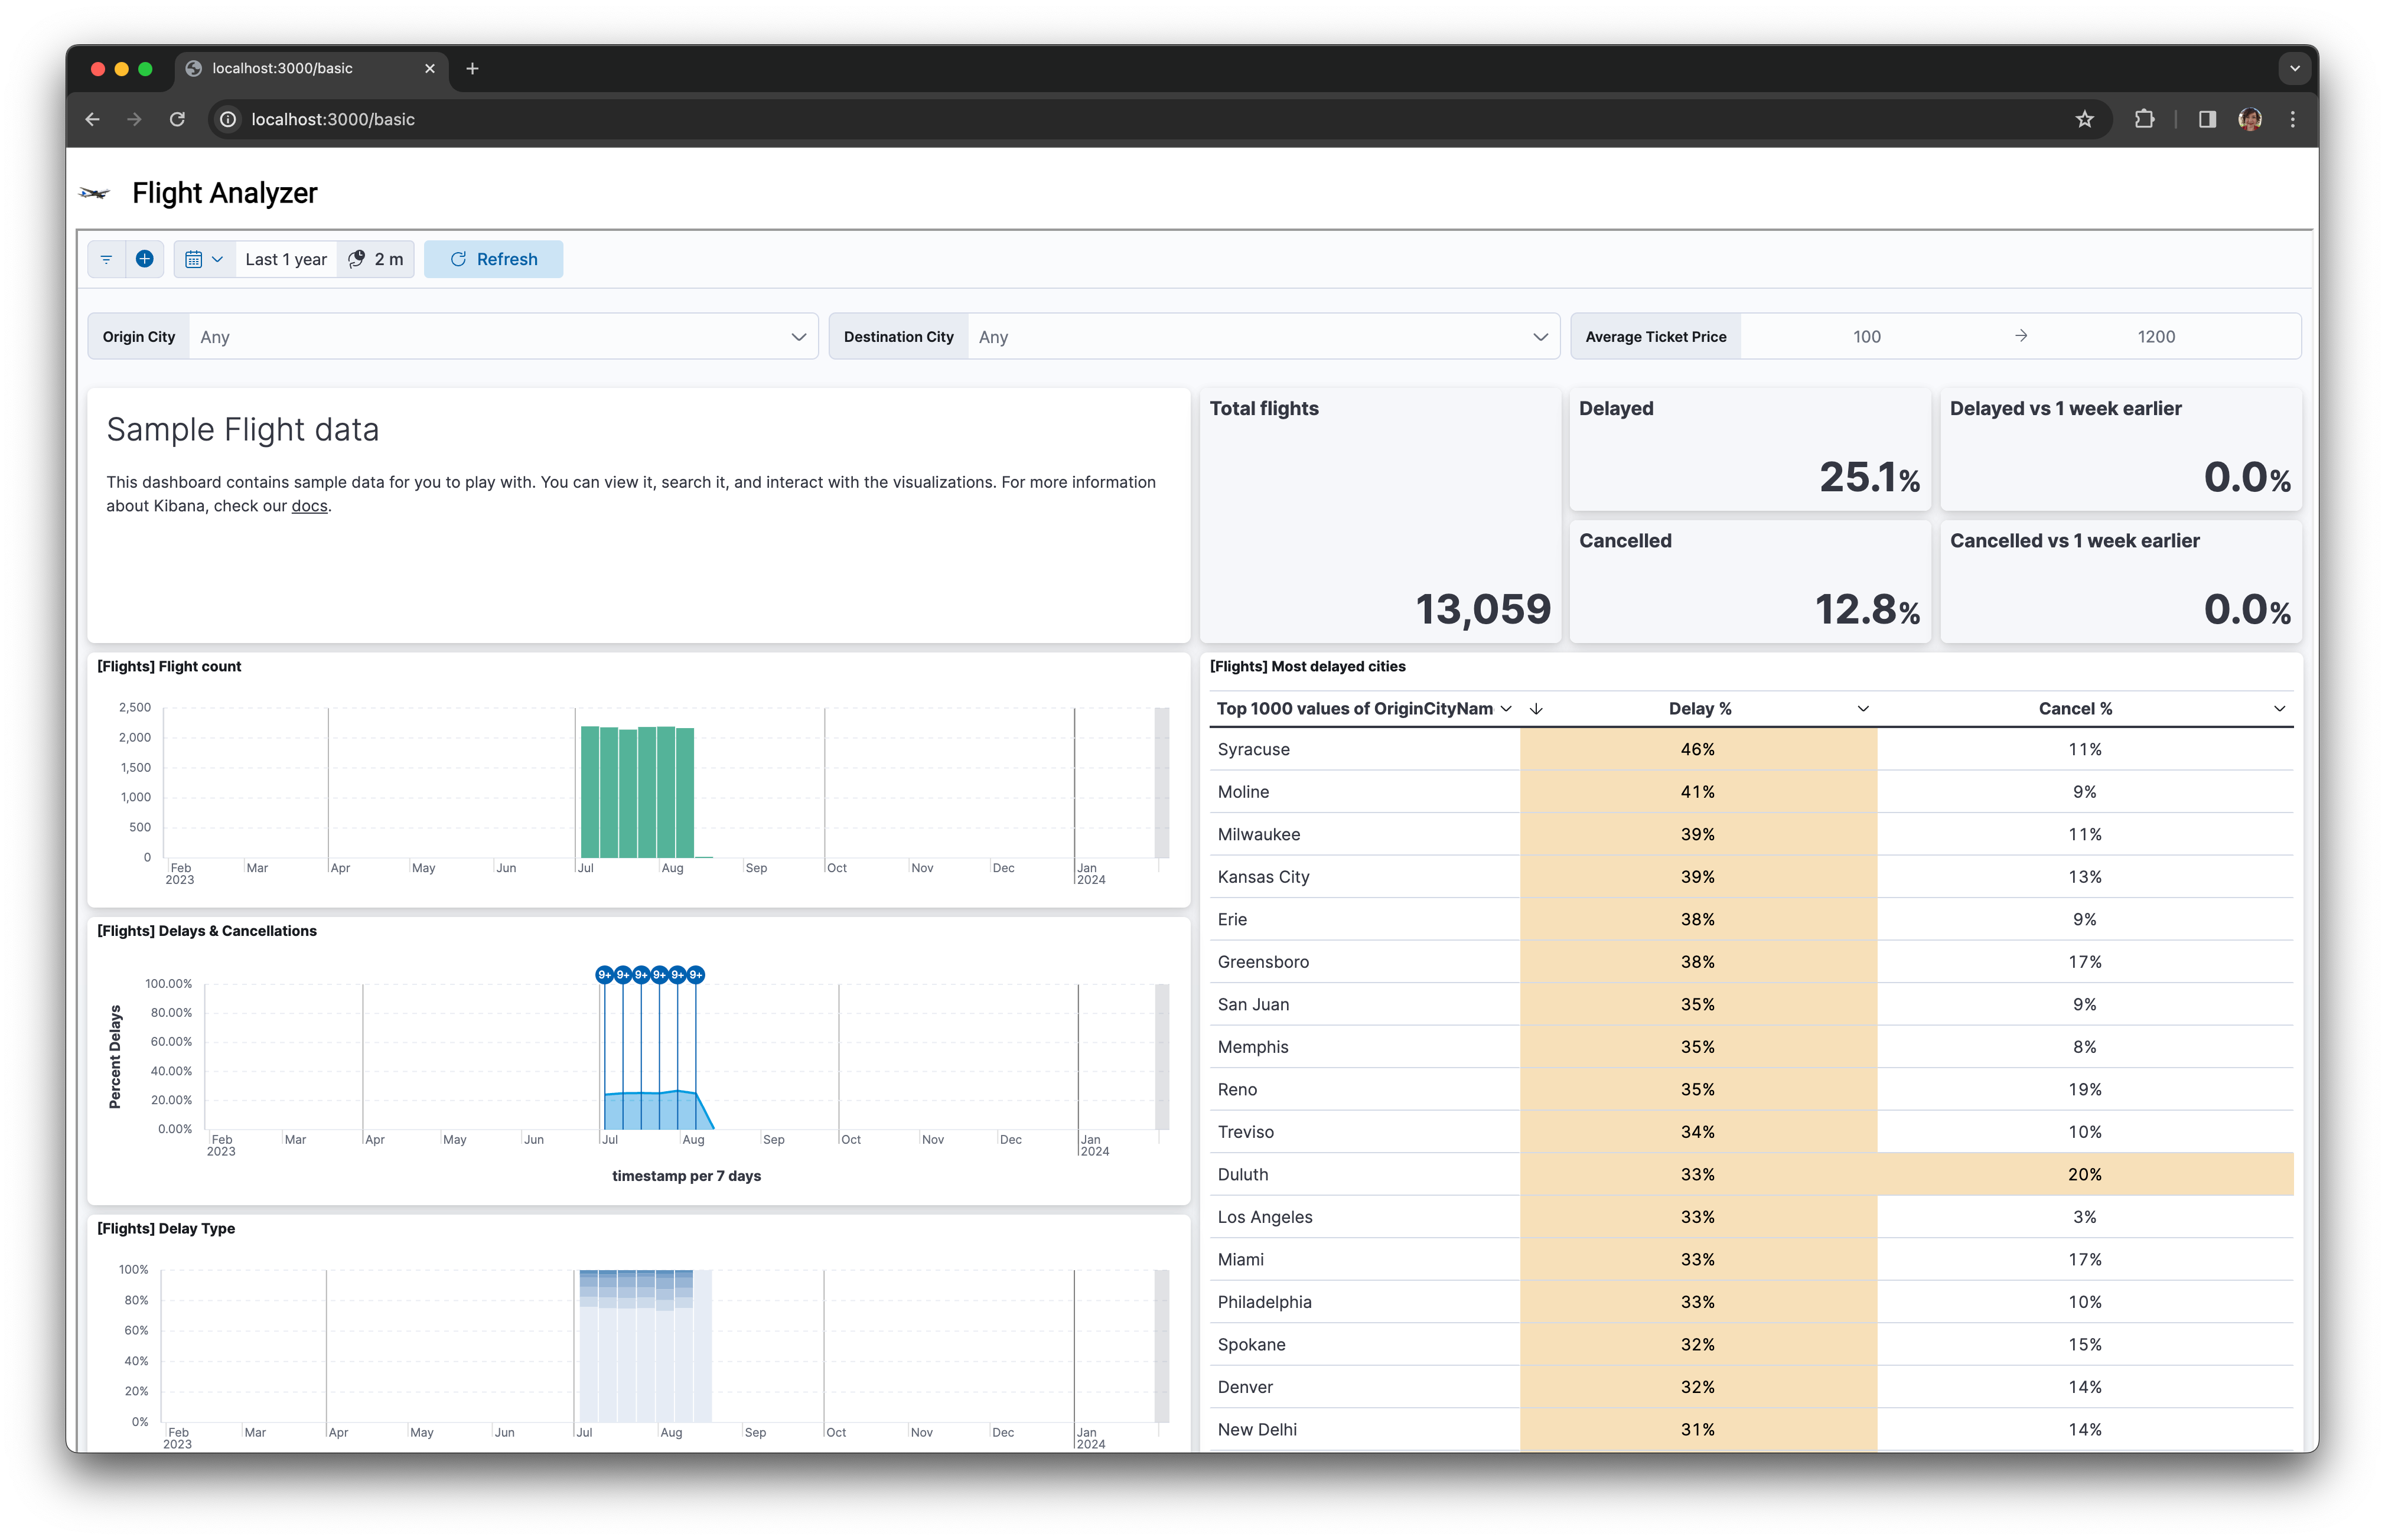
Using custom controls
You may have noticed that this dashboard makes use of controls to filter the data. It's important to allow users to investigate the data and narrow down their selection to find interesting insights.
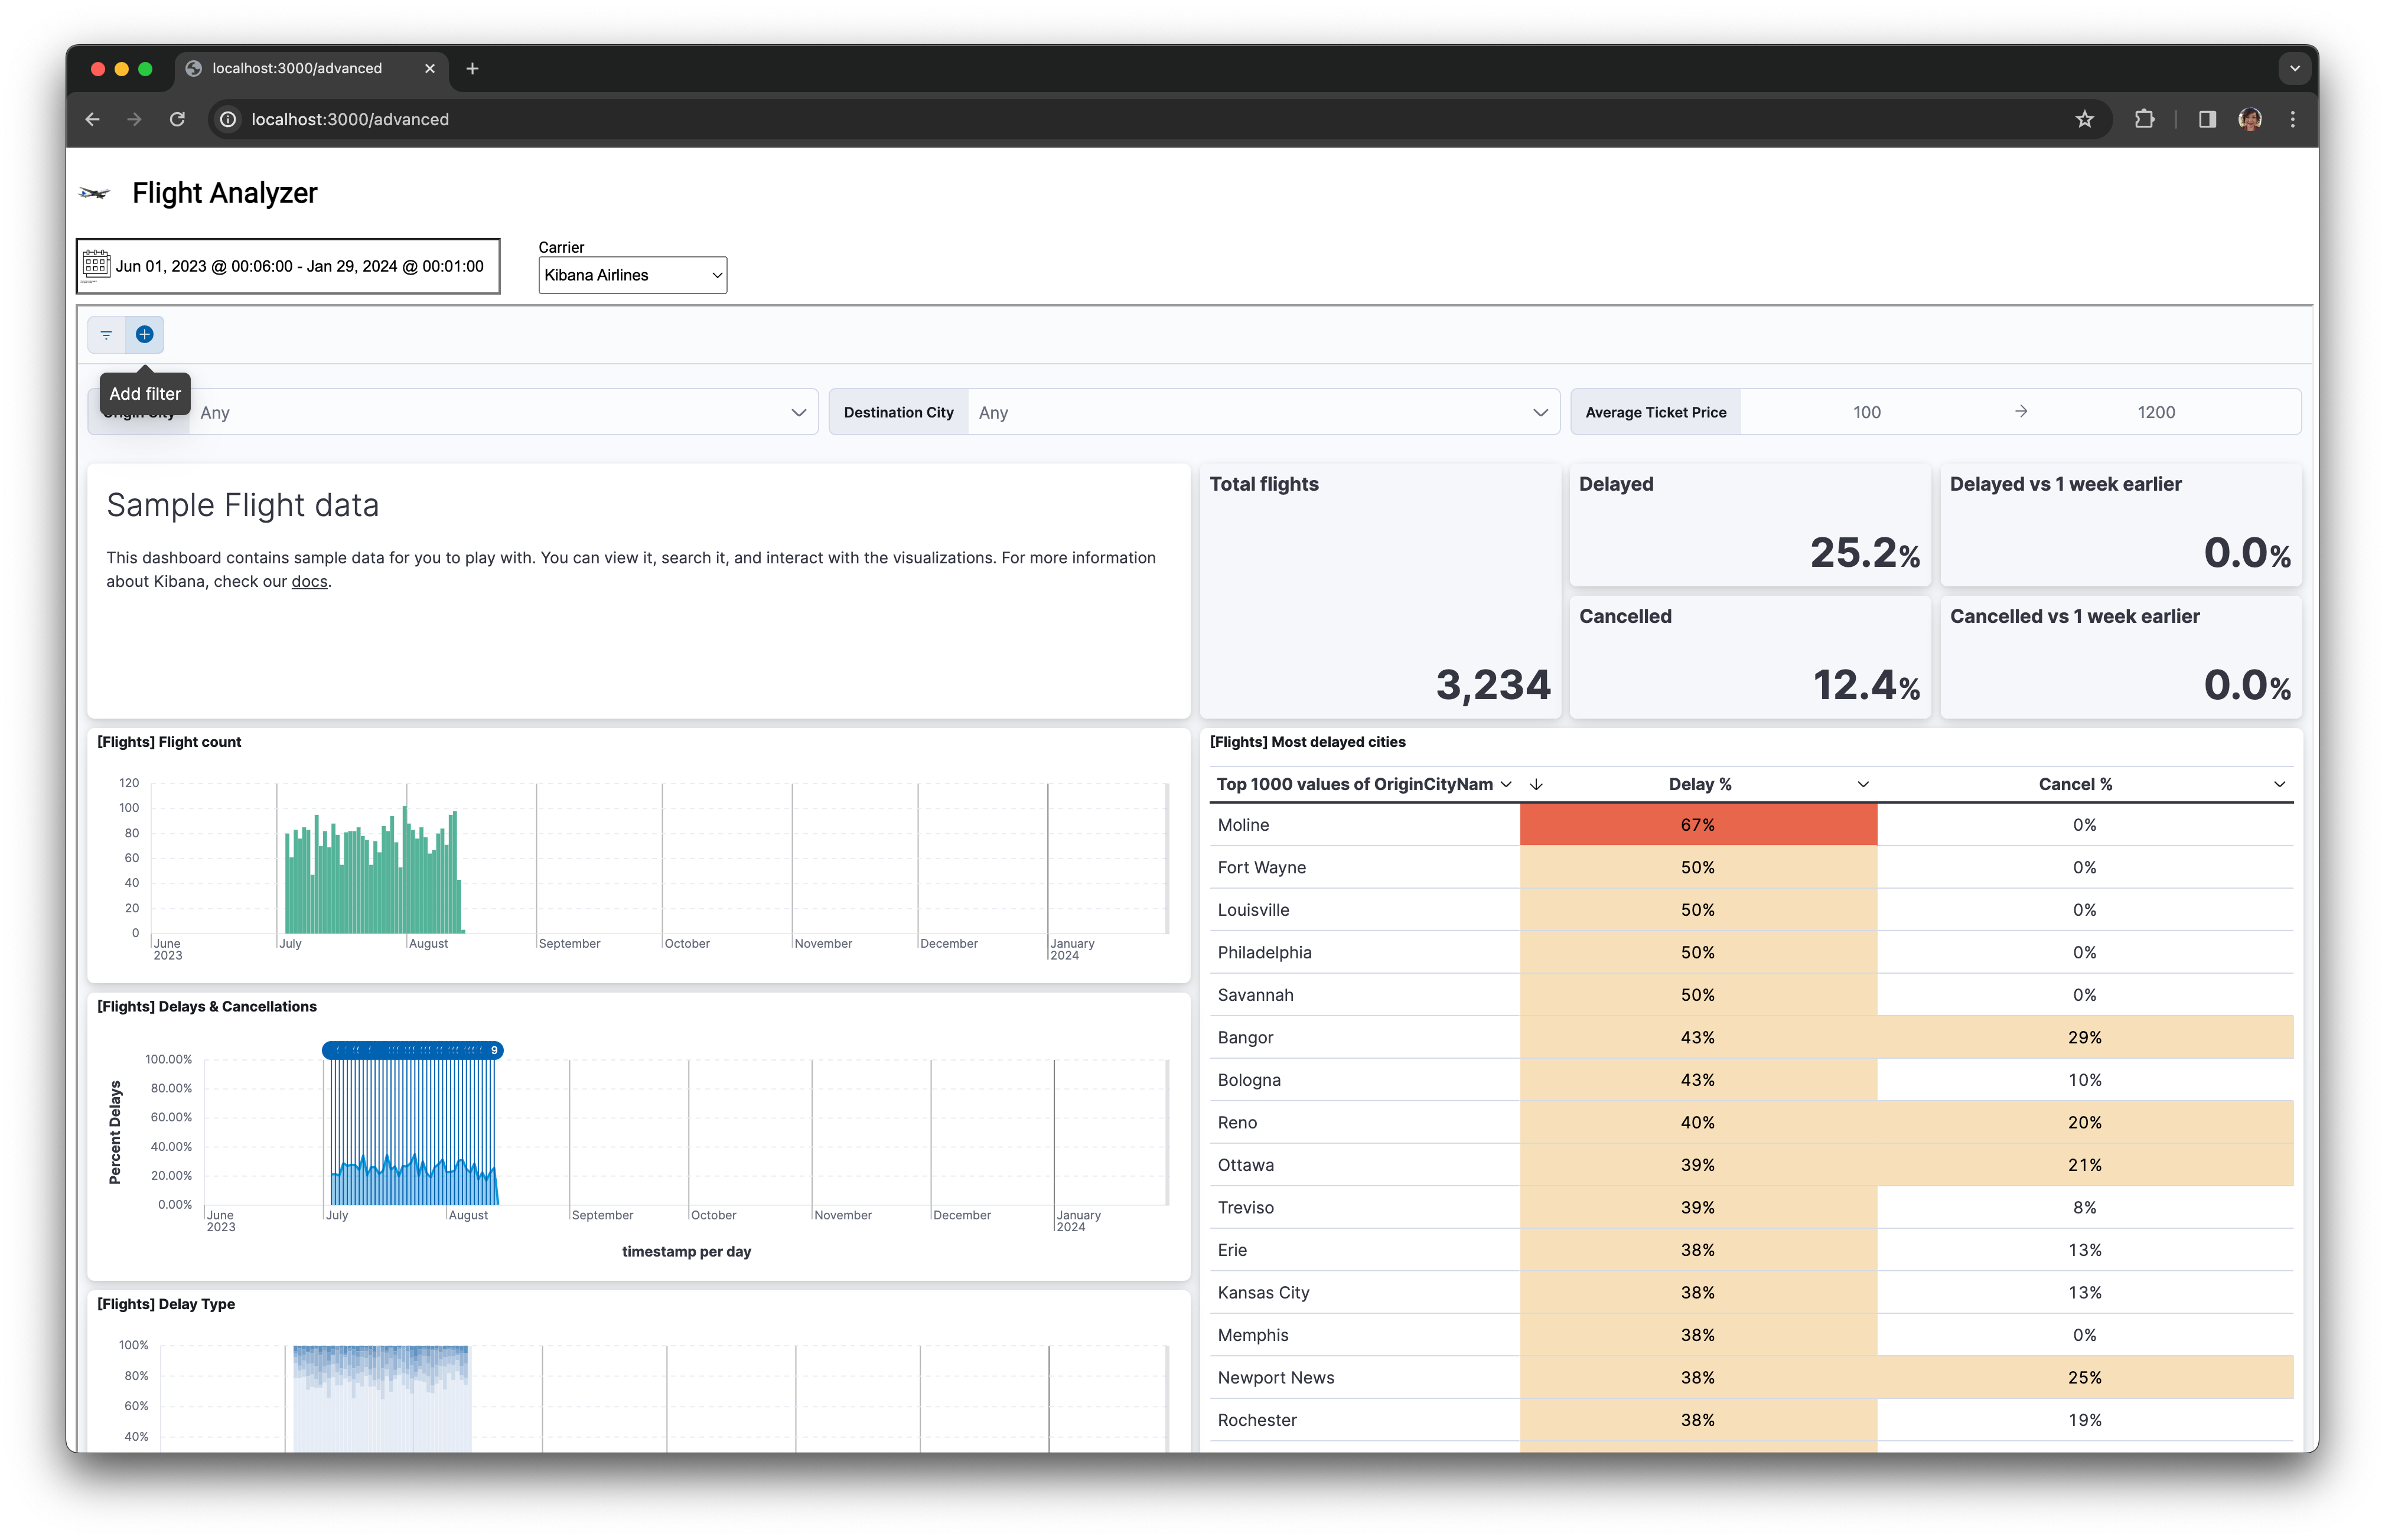
In certain situations, using the in-dashboard controls may not be the right decision. You may want to use your own custom controls for design cohesion within an existing application. Alternatively, have the dashboard sit alongside additional data sources and visualizations that you want to filter across to form a cohesive experience.
In this advanced example, we show how to pass date range settings from a date picker and dropdown selection to the dashboard to force an update to the dashboard:
Using custom controls means we need to understand the composition of the dashboard URL. Let's explore the following example:
https://elastic-deployment-9f9945.kb.eu-west-2.aws.cloud.es.io:9243/app/dashboards?auth_provider_hint=anonymous1#/view/7adfa750-4c81-11e8-b3d7-01146121b73d?embed=true&_g=(filters:!(),refreshInterval:(pause:!f,value:0),time:(from:'${selectedStartDate}',to:'${selectedEndDate}'))&_a=(query:(language:kuery,query:'${carrierQuery}'))&hide-time-filter=trueIn addition to the parameters discussed in the basic example, we need to manipulate the filters. As discussed previously in the community, there are two levels of filters in Kibana:
The global state, denoted by the _g parameter, denotes the state that moves between individual Kibana applications. A key example of this is pinned filters, including the selected start and end date.
State limited to individual applications such as the current dashboard. This is represented by the _a URL parameter.
To pass the date range from any date picker, the iframe of the URL must be updated with the selected start and end date when a new date range is applied to the control. Initially, we set these values to a relative range of the past year. Using easepick as an example, the new dates are captured on the select event registered on setup and converted to the required ISO date format before the src attribute of the iframe is updated with the new URL.
let selectedStartDate = 'now-1y';
let selectedEndDate = 'now';

const picker = new easepick.create({
    element: '#datepicker',
    css: [
        'https://cdn.jsdelivr.net/npm/@easepick/bundle@1.2.1/dist/index.css'
    ],
    zIndex: 10,
    firstDay: 0,
    autoApply: false,
    format: 'MMM DD, YYYY @ HH:MM:00',
    plugins: [
        'RangePlugin',
        'TimePlugin'
    ],
    setup(picker) {
        picker.on('select', (e) => {
            const dateFormat = 'YYYY-MM-DDTHH:MM:00.000Z';
            selectedStartDate =  picker.getStartDate().format(dateFormat);
            selectedEndDate =  picker.getEndDate().format(dateFormat);

            dashboardUri=getDashboardUri();
            iframe.setAttribute('src', dashboardUri);
        });
     }
});In terms of the URL itself, the global filter parameter _gis then updated with the selected range, as seen in the getDashboardUri() helper method:
function getDashboardUri() {
    return `https://my-deployment-9f9945.kb.eu-west-2.aws.cloud.es.io:9243/app/dashboards?auth_provider_hint=anonymous1#/view/7adfa750-4c81-11e8-b3d7-01146121b73d?embed=true&_g=(filters:!(),refreshInterval:(pause:!f,value:0),time:(from:'${selectedStartDate}',to:'${selectedEndDate}'))&hide-time-filter=true`;
}For any data fields you wish to filter on in controls such as dropdowns, we need to pass those values in using the query option in the _a parameter. Taking the following HTML select control as an example:
<div class="carrier-select-container">
  <label for="carrier-select">Carrier</label>
  <select name="carrier-select" id="carrier-select" onchange="updateWithCarrier()">
    <option value="ES-Air">ES-Air</option>
    <option value="JetBeats">JetBeats</option>
    <option value="Kibana Airlines">Kibana Airlines</option>
    <option value="Logstash Airways">Logstash Airways</option>
  </select>
</div>It's possible to extract the selected value when changed from the method updateWithCarrier()that is wired to the onchange event. The event is pulled out from the select control in the event handler:
function updateWithCarrier() {
    const carrierSelect = document.getElementById('carrier-select');
    selectedCarrier = carrierSelect.value || '';

    dashboardUri=getDashboardUri();
    iframe.setAttribute('src', dashboardUri);
}Note that we are still using the getDashboardUri()helper, which needs to be updated to generate a KQL query to pass into the dashboard URL via the query option in the application filter:
function getDashboardUri() {
  const carrierQuery = rison.encode_object({Carrier : encodeURIComponent(selectedCarrier)});
  return `https://my-deployment-9f9945.kb.eu-west-2.aws.cloud.es.io:9243/app/dashboards?auth_provider_hint=anonymous1#/view/7adfa750-4c81-11e8-b3d7-01146121b73d?embed=true&_g=(filters:!(),refreshInterval:(pause:!f,value:0),time:(from:'${selectedStartDate}',to:'${selectedEndDate}'))&_a=(query:(language:kuery,query:'${carrierQuery}'))&hide-time-filter=true`;
}Kibana makes use of Rison and URI encoding, which needs to be applied to the query before inclusion. This is noted in the carrierQuery definition above where we use rison.js alongside escaping the selected value using the usual encodeURIComponent method.
Once wired, you'll see the dashboard refresh each time with the new selection. Just be on the lookout for errors suggesting malformed Rison such as this error reported on our forums which can be difficult to debug.
Note that URLs are always subject to change and therefore you risk your functionality breaking with new versions of any third-party tool you choose to embed. Make sure you check for breaking changes for each Kibana release and regression test your application carefully.
Doing more Kibana dashboards
Here we have dived into the world of embedded Kibana dashboards. We've covered a simple example making use of a single HTML iframe, along with a complex example using our own JavaScript components to pass parameters to the dashboard. All code is available in this GitHub repo and can be adapted easily to use your favorite web technology, JavaScript framework, or for use with TypeScript.
Do share any questions or issues you encounter in embedding dashboards on our community forums. We're always happy to help. Happy dashboarding!
Share
- Share on Twitter
Share on Twitter
- Share on LinkedIn
Share on LinkedIn
- Share on Facebook
Share on Facebook
- Share by Email
Share by Email
- Print this page
Print