Elastic Stack AIOps Labs 8.12: GA of log rate analysis


 Share on Twitter
Share on Twitter

 Share on LinkedIn
Share on LinkedIn

 Share on Facebook
Share on Facebook

 Share by Email
Share by Email

 Print this page
Print
Elastic Stack AIOps Labs 8.12 introduces the general availability release of log rate analysis, a feature that uses advanced statistical methods to identify reasons for increases or decreases in log rates. The tool, which is available in Kibana®’s Machine Learning section, simplifies the task of identifying what contributes to unusual spikes or drops in log rates: Is the root cause a specific service in your stack? Is it limited to a particular region? Are there shared characteristics among log messages contributing to this change? Historically, addressing these investigations required SREs to dedicate hours manually comparing logs and metadata to determine whether the change in log rate represented a genuine issue and, if so, its root cause. Thanks to Elastic®'s log rate analysis tool, this cumbersome process is now streamlined to a matter of seconds.
We released the feature originally in tech preview for Elastic Stack version 8.4 named as explain log rate spikes. Over the past months, we’ve been busy extending the feature set (thus the rename to log rate analysis in 8.10 when we introduced support for analyzing log dips), improving its reliability and making it work with increasingly large data sets.
Elasticsearch powered AIOps features
It’s been a huge team effort to bring this tool to life and finally to general availability. Several features available in the Elasticsearch® Platform were essential to make this possible:
The p_value scoring heuristic for significant terms aggregation enables the identification of statistically significant field/value pairs within logs. This aggregation facilitates the comparison of these pairs in relation to a deviation from the baseline log rate. It helps pinpoint which fields have the most impact on the deviation, thereby providing an initial explanation that serves as a valuable starting point for delving deeper into the root causes. For instance, in the analysis of web logs, it permits the identification of the source IPs or URLs contributing to a spike in your logs.
The frequent_item_sets aggregation employs a data mining technique that is able to find frequent and relevant patterns in large data sets. Its implementation as an Elasticsearch aggregation makes it available as a building block for many use cases like recommender systems, behavioral analytics, or fraud detection. For log rate analysis, we use the aggregation to identify groups of correlating statistically significant field/value pairs. Again with web logs for example, this can give you the ability to identify which type of users are accessing certain URLs causing an increase or decrease in log activity.
Finally, the random_sampler aggregation allows us to scale the feature for today’s Observability workloads effectively. The aggregation randomly samples documents in a statistically robust manner and allows us to balance speed and accuracy at query time as opposed to approaches where you’d have to consider sampling upfront as part of ingesting or rolling up data.
An easy to use user interface for practitioners within Kibana
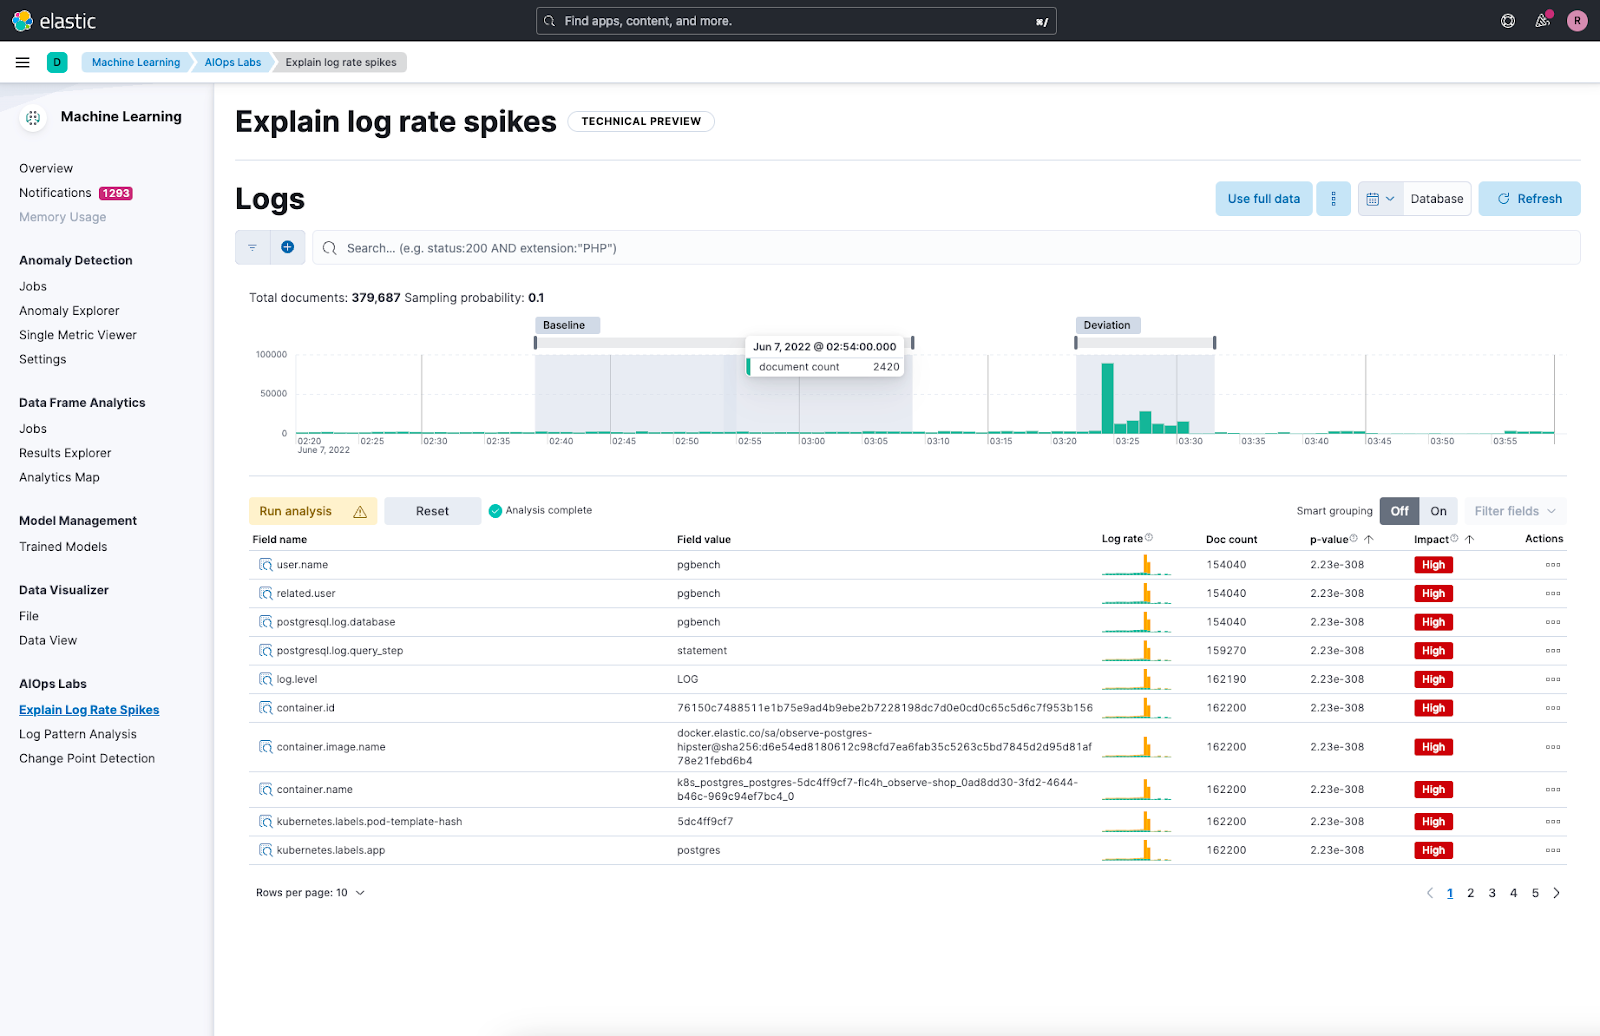
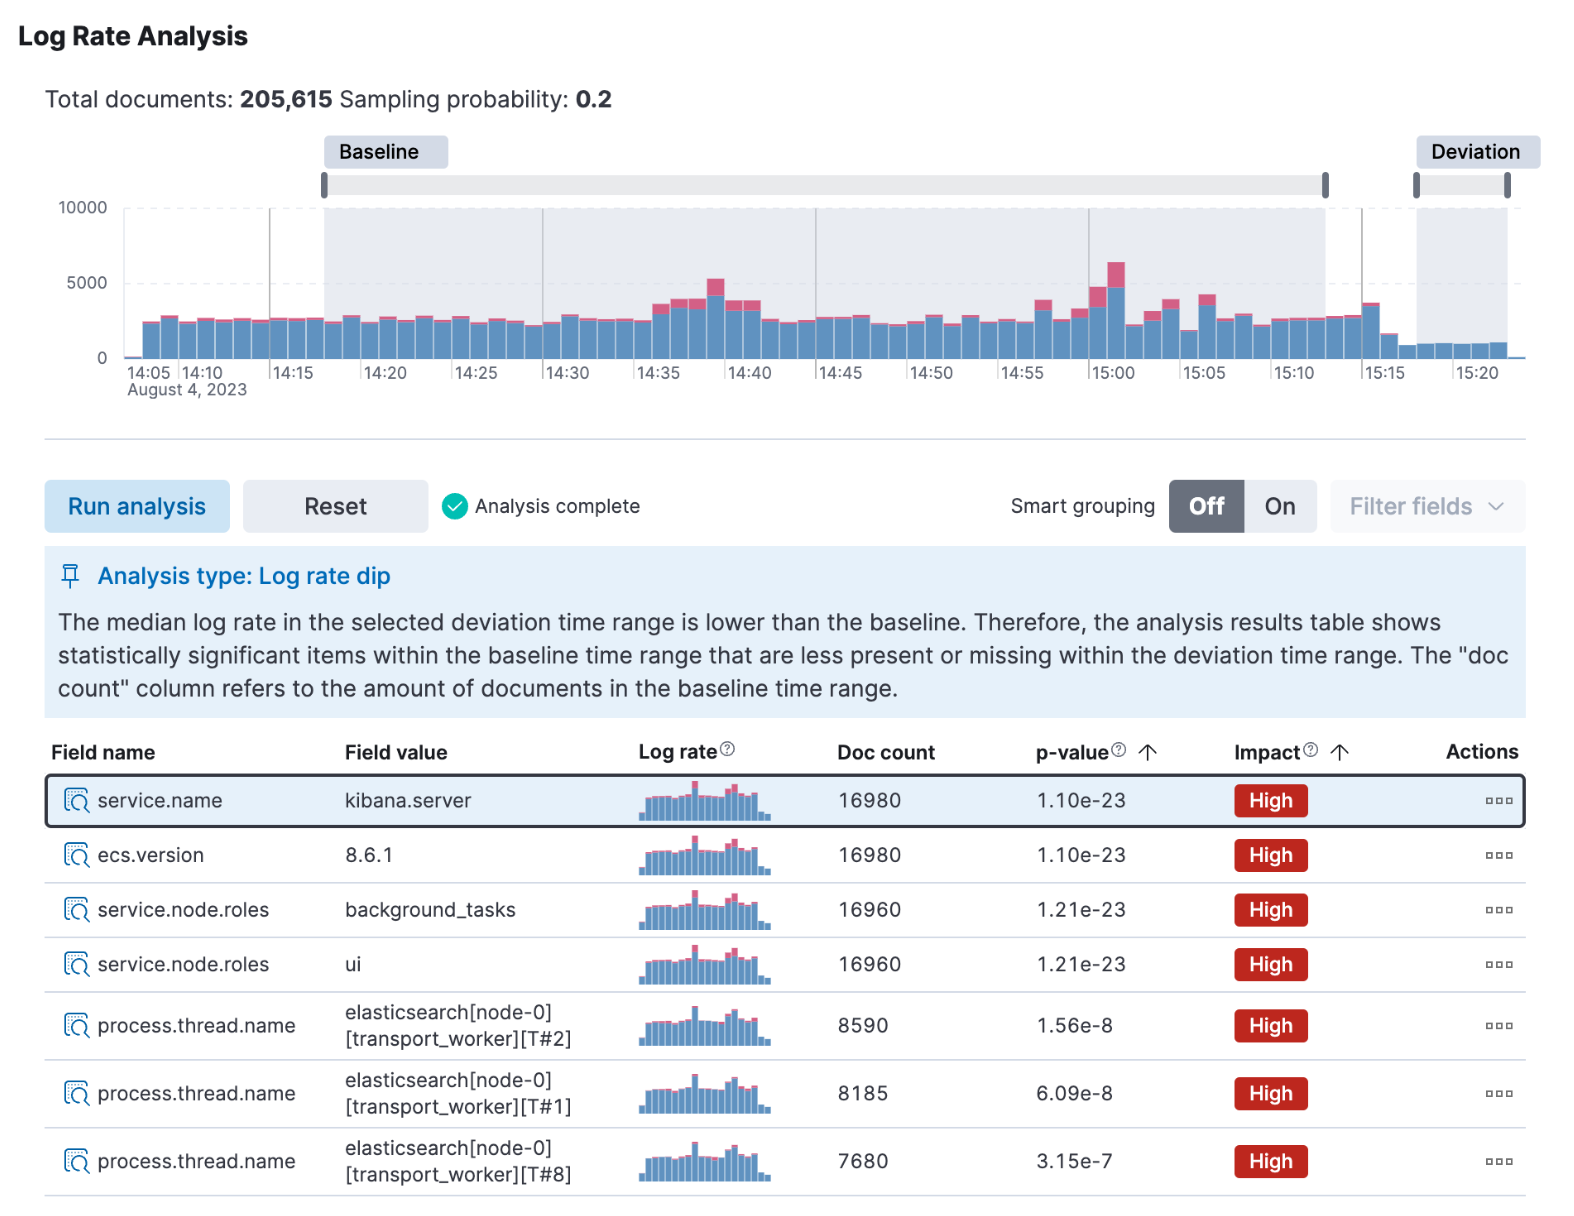
On top of the described Elasticsearch features, we’ve built a UI that’s easy to use as part of AIOps Labs in Kibana’s Machine Learning section. The first step is to select a log rate spike or dip in a histogram chart. Then the user interface enables you to compare results across the deviation and baseline selection. The analysis results show the fields and their values that have the biggest impact on the deviation with support for both keyword as well as unstructured text type fields. You can then take further action by grouping and filtering the results or drill down into other Kibana tools like Discover or log pattern analysis to investigate specific results.
Observability and AI Assistant integrations
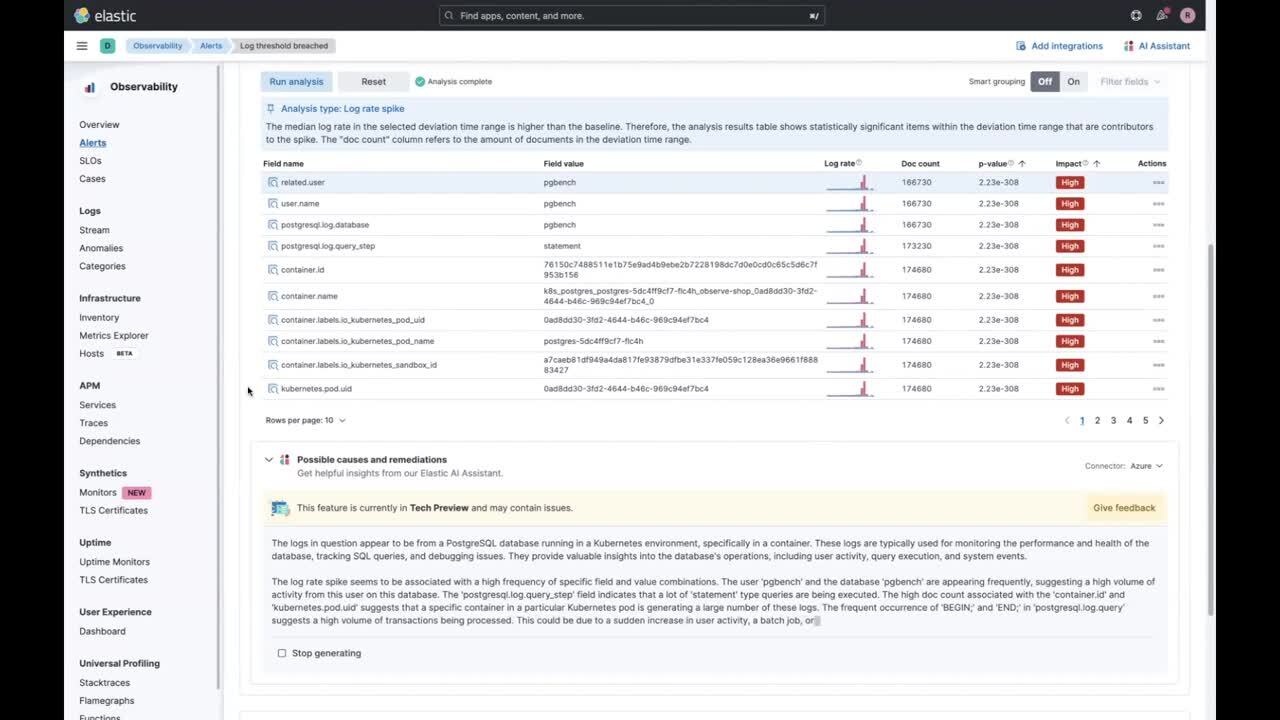
Log rate analysis is also integrated into Kibana’s alerting system as part of the alert details page for threshold alerts created in the Observability solution. In this alert view, log rate analysis is automatically run based on the info available from an alert’s metadata so users don’t need to select the deviation and baseline time ranges manually. On the same page, the results of log rate analysis are passed on as context to Observability’s AI Assistant. As part of this, a pre-built prompt is sent to your configured LLM, and you get not only the description and context of the issue, but also some recommendations on how to proceed. Additionally you can launch a chat with the AI Assistant and go deeper into your investigation.
As you can see, log rate analysis is a powerful tool by itself, but it’s just one part of a suite of AIOps tools that are part of Elastic’s Observability solution. To learn more, have a look at these additional logging resources:
Root cause analysis with logs: Elastic Observability's AIOps Labs
Context-aware insights using the Elastic AI Assistant for Observability
Common use case examples with logs:
How to use machine learning to identify log spikes & patterns for PostgreSQL logs with Elastic AIOps
Ready to get started? Register for Elastic Cloud and try out the features and capabilities outlined above.
The release and timing of any features or functionality described in this post remain at Elastic's sole discretion. Any features or functionality not currently available may not be delivered on time or at all.
Share
- Share on Twitter
Share on Twitter
- Share on LinkedIn
Share on LinkedIn
- Share on Facebook
Share on Facebook
- Share by Email
Share by Email
- Print this page
Print