What’s new in 8.11
editWhat’s new in 8.11
editHere are the highlights of what’s new and improved in 8.11. For detailed information about this release, check the release notes.
Previous versions: 8.10 | 8.9 | 8.8 | 8.7 | 8.6 | 8.5 | 8.4 | 8.3 | 8.2 | 8.1 | 8.0
Discover
editES|QL in Discover
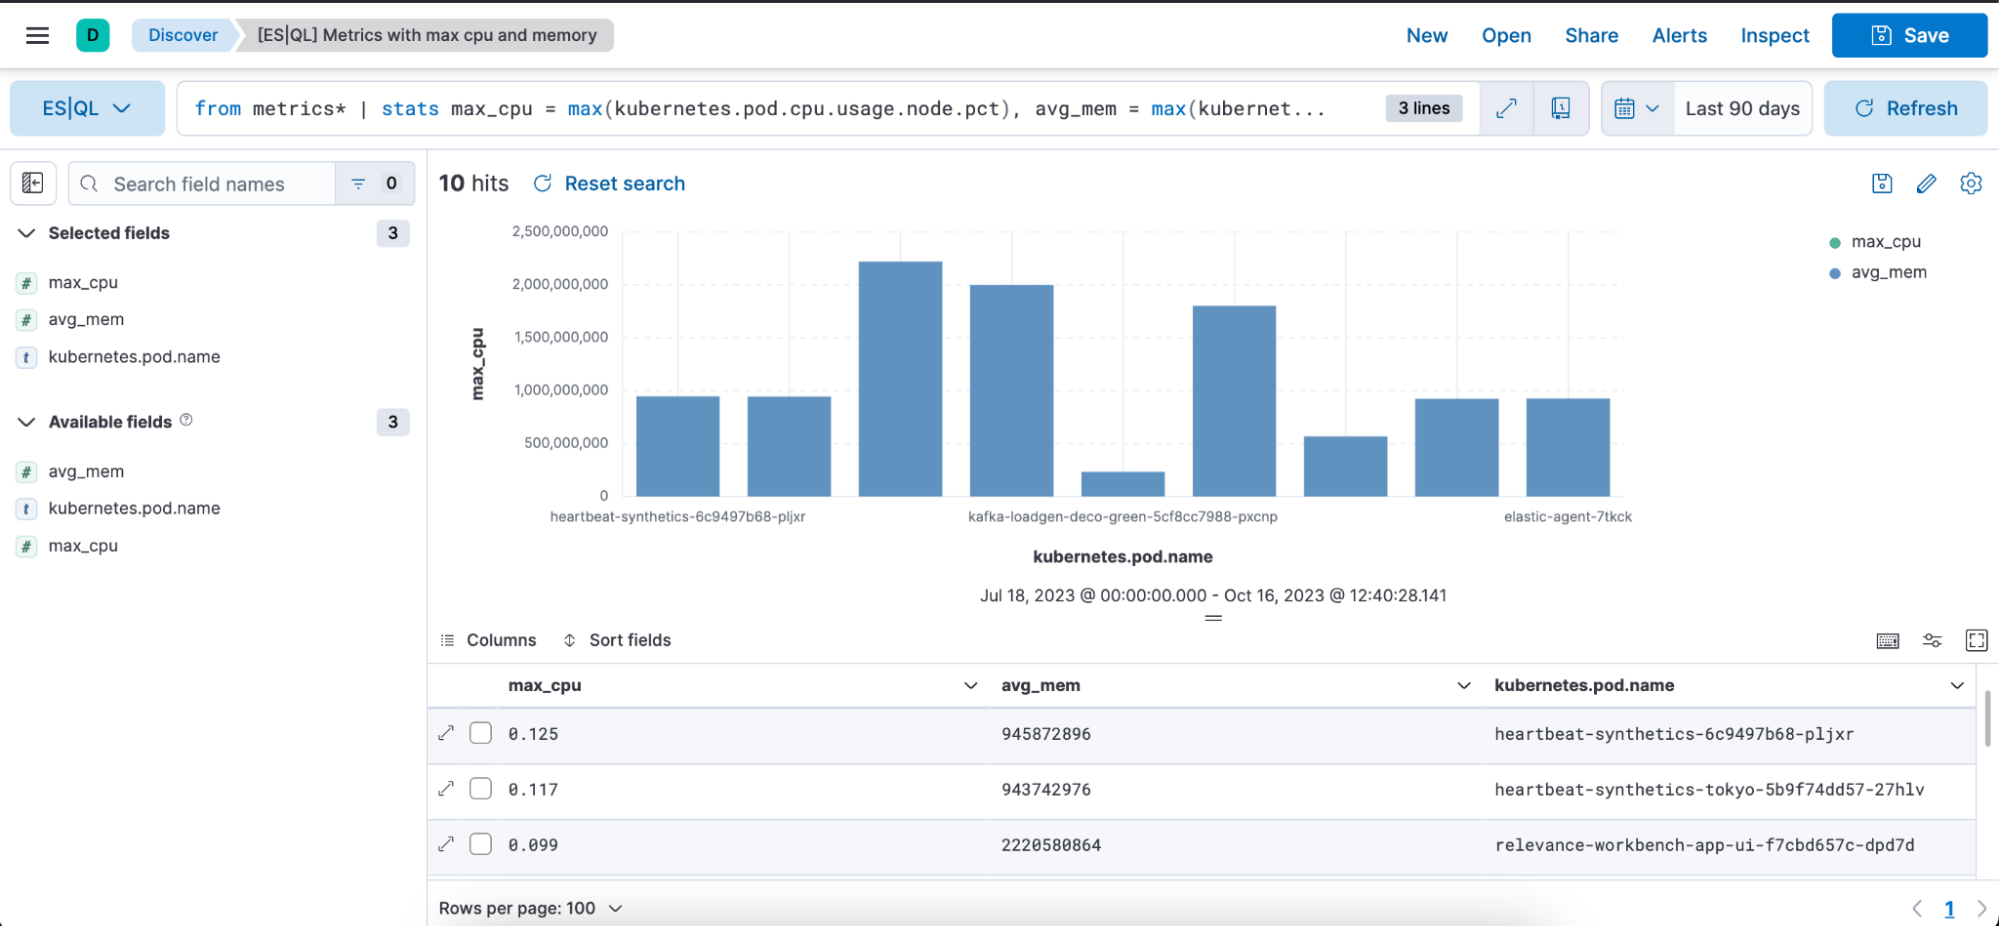
edit[preview] This functionality is in technical preview and may be changed or removed in a future release. Elastic will work to fix any issues, but features in technical preview are not subject to the support SLA of official GA features. In 8.11 we are introducing Elasticsearch Query Language (ES|QL), Elastic’s new piped language for data exploration and investigation. ES|QL transforms, enriches, and simplifies your data exploration process.
Here is what you can expect:
- Easy start: To begin using ES|QL in Discover, select Try ES|QL from the data view menu.
- Efficient and easy query building: ES|QL in Discover offers auto-complete and in-app documentation, making it easy to craft powerful queries right from the query bar.
- Comprehensive and powerful data exploration: Conduct ad-hoc data exploration within Discover. Create aggregations, transform data, enrich datasets, and more directly from the query builder. Results are presented in a tabular format or as visualizations. It depends on the query you are executing.
- Contextual visualizations: When writing ES|QL queries in Discover, you’ll receive visual representations powered by the Lens suggestion engine. Your query’s nature determines the type of visualization you get, such as a metric, histogram, heatmap, and so on.
- Enrichment: Use the enrich command to enhance your query dataset with fields from another dataset, complete with in-context suggestions for the selected policy, such as hinting the matching field and enriched columns.
- In-line visualization editing: Edit ES|QL visualizations directly within Discover and dashboards. No need to navigate to Lens for quick edits, so you can make changes seamlessly.
- Dashboard integration: Save your ES|QL visualizations to a dashboard directly from Discover once you’re satisfied with the results.
- Alerting: Use ES|QL for Observability and Security alerts, setting aggregated values as thresholds. Enhance detection accuracy and receive actionable notifications by emphasizing meaningful trends over isolated incidents, reducing false positives.
ES|QL in Discover brings efficiency and power to your data investigations, streamlining your path to insights.
Learn more about ES|QL’s capabilities in the Elasticsearch ES|QL documentation.

Dashboard
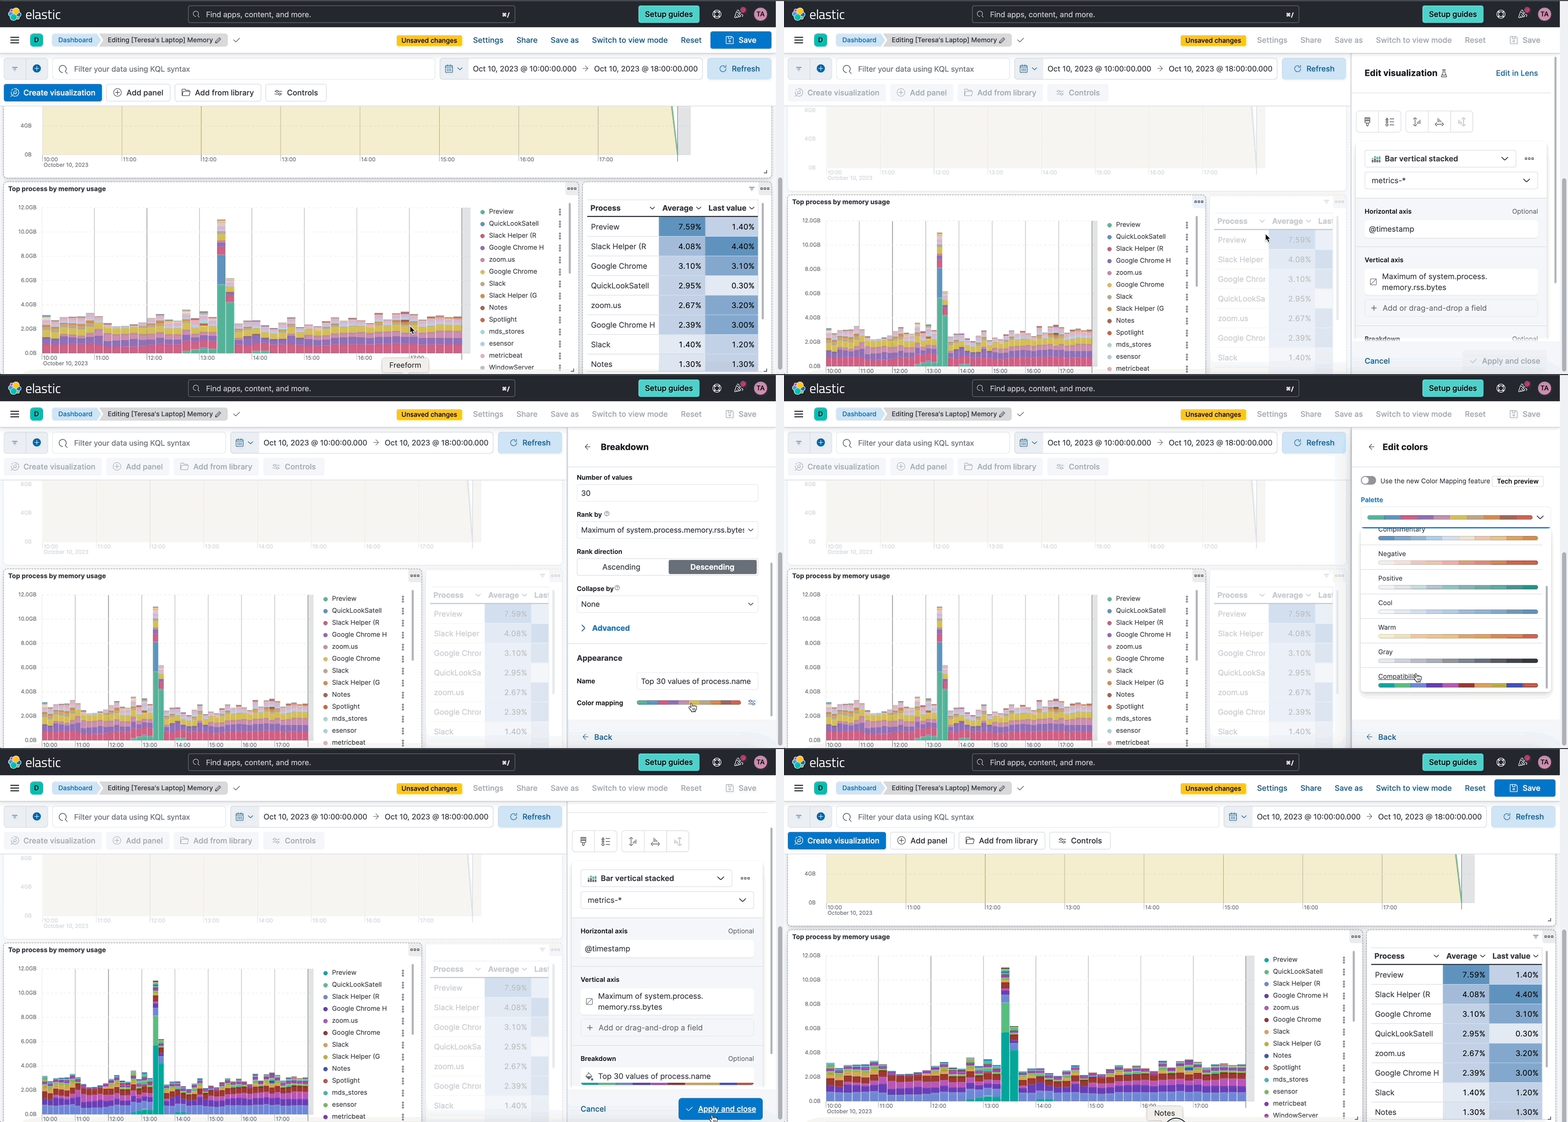
editLens inline editing in dashboards
editYou can now edit a Lens visualization without leaving the dashboard instead of navigating back and forth to the Lens editor. Open the panel menu and select Edit visualization. A flyout will be open in the dashboard where you can perform any edits to your Lens panels. Once happy with your edits, click Apply and close. This new editing experience is more convenient and will save you time since the dashboard will not need to reload when saving your changes.
Links panel
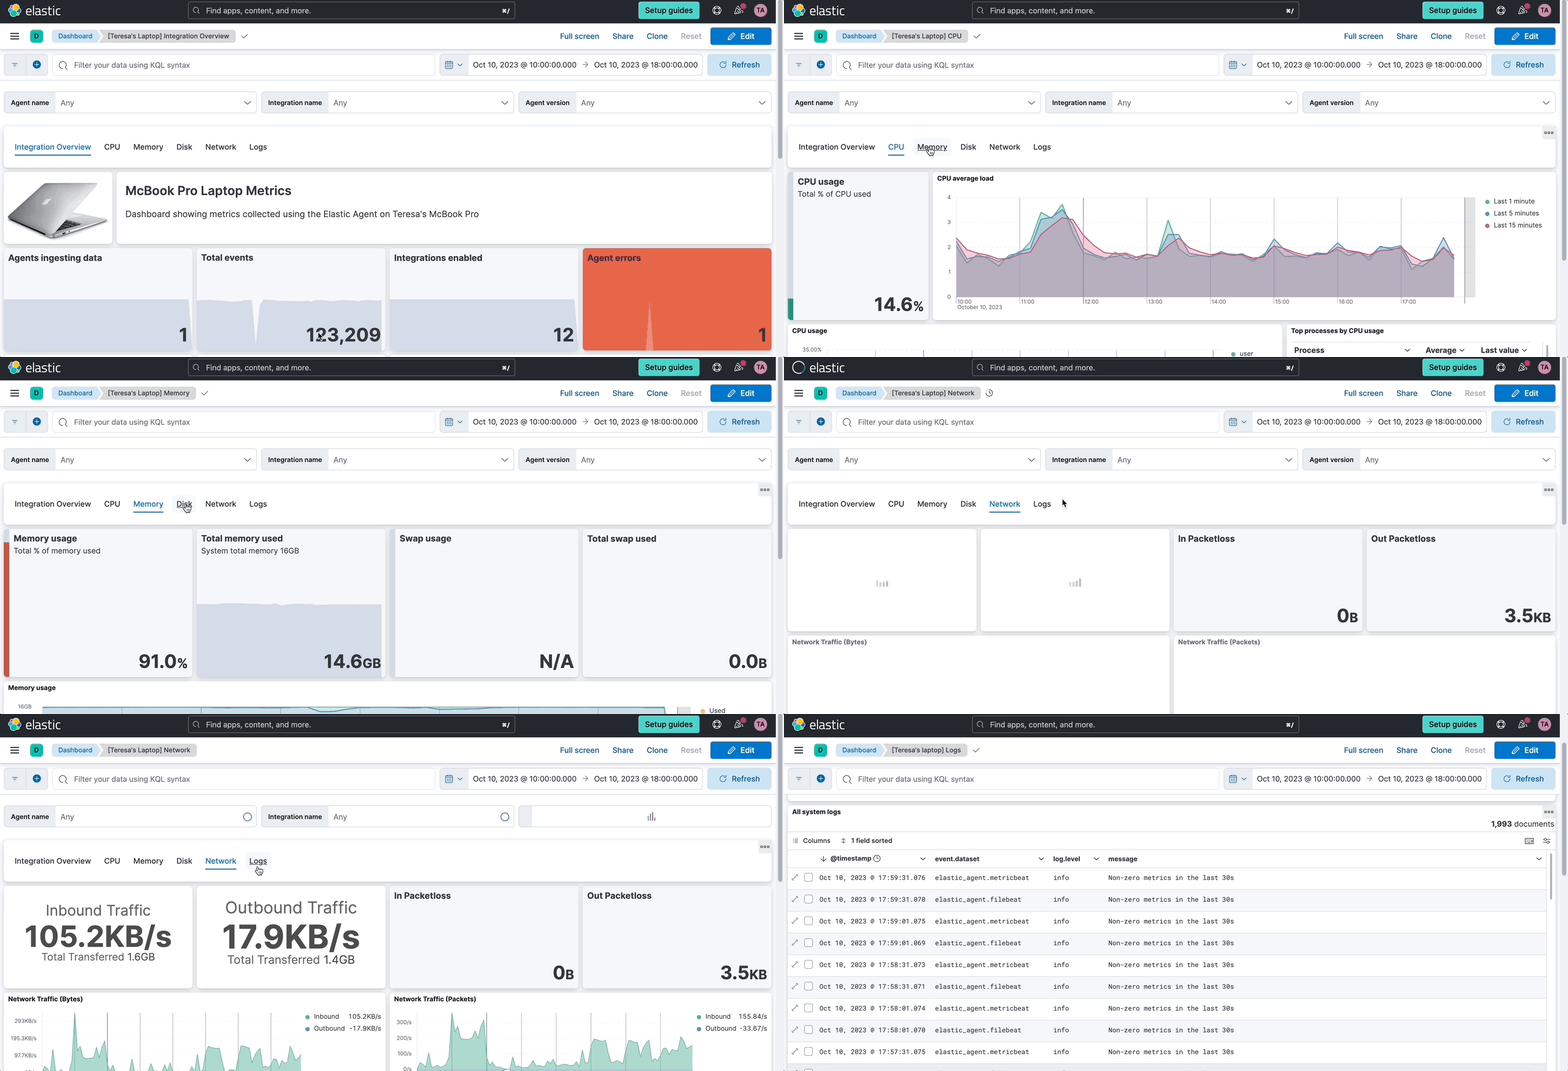
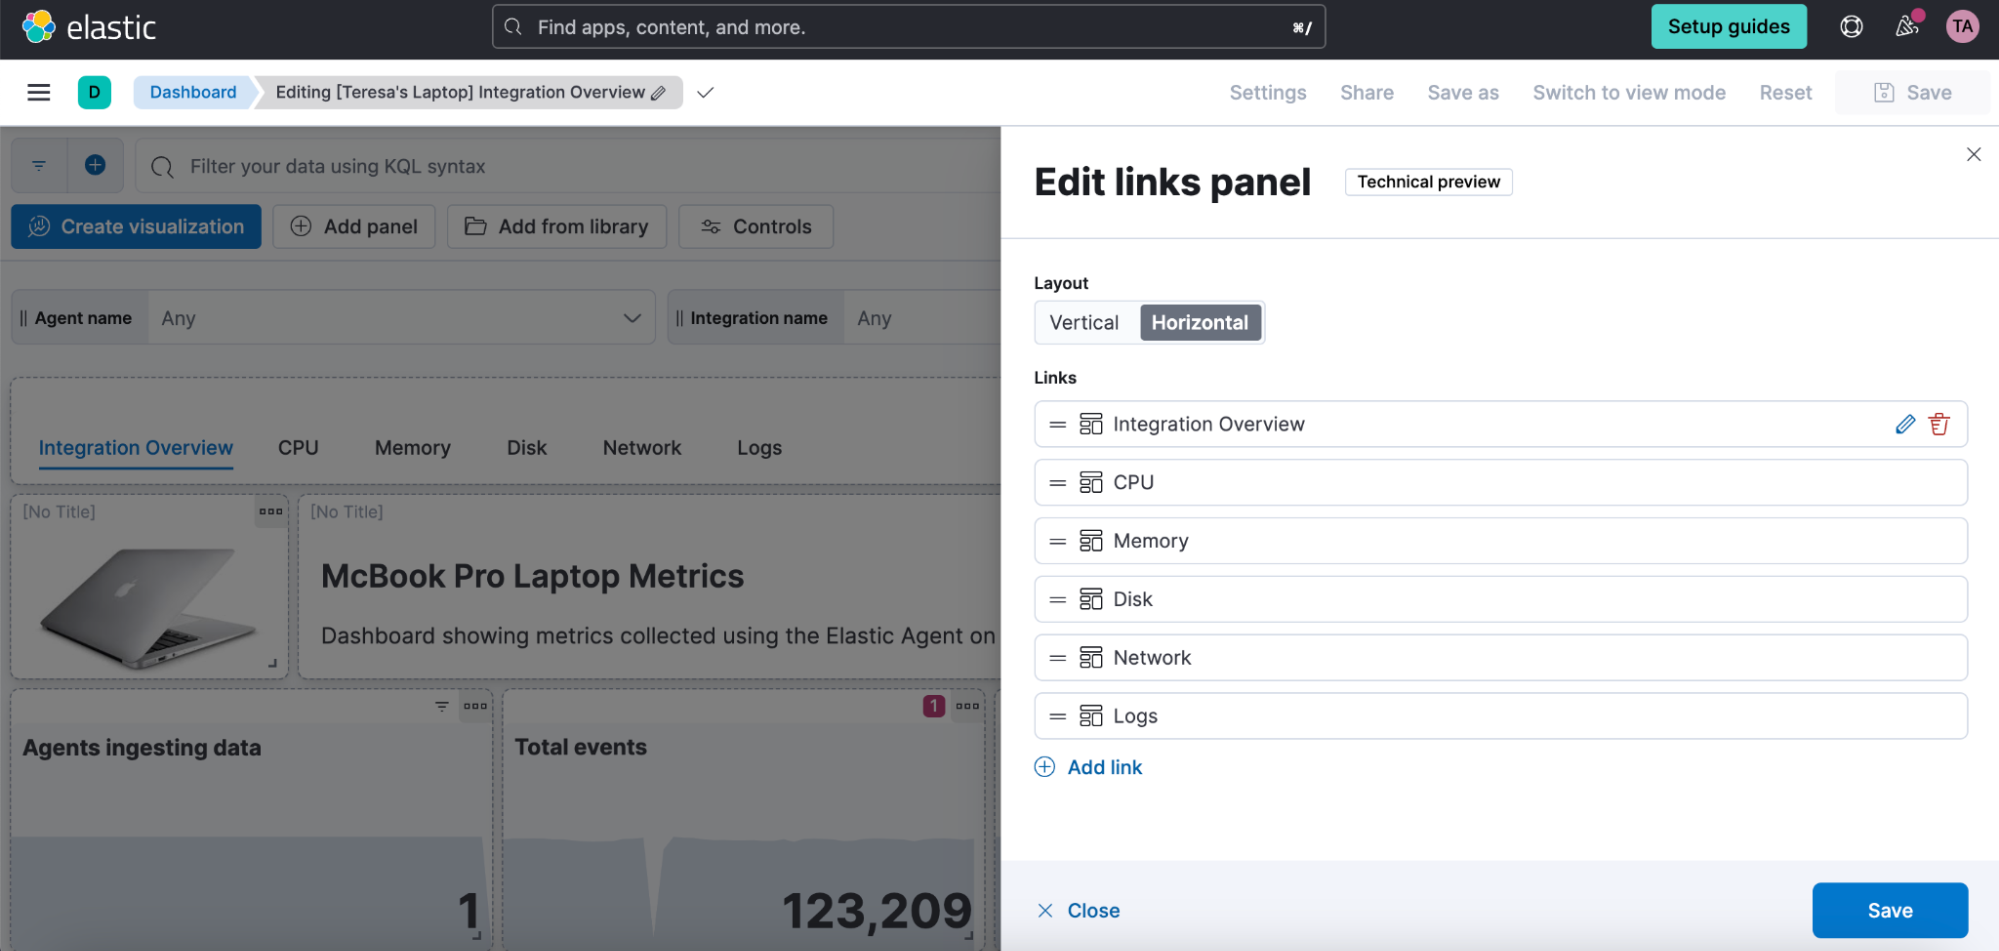
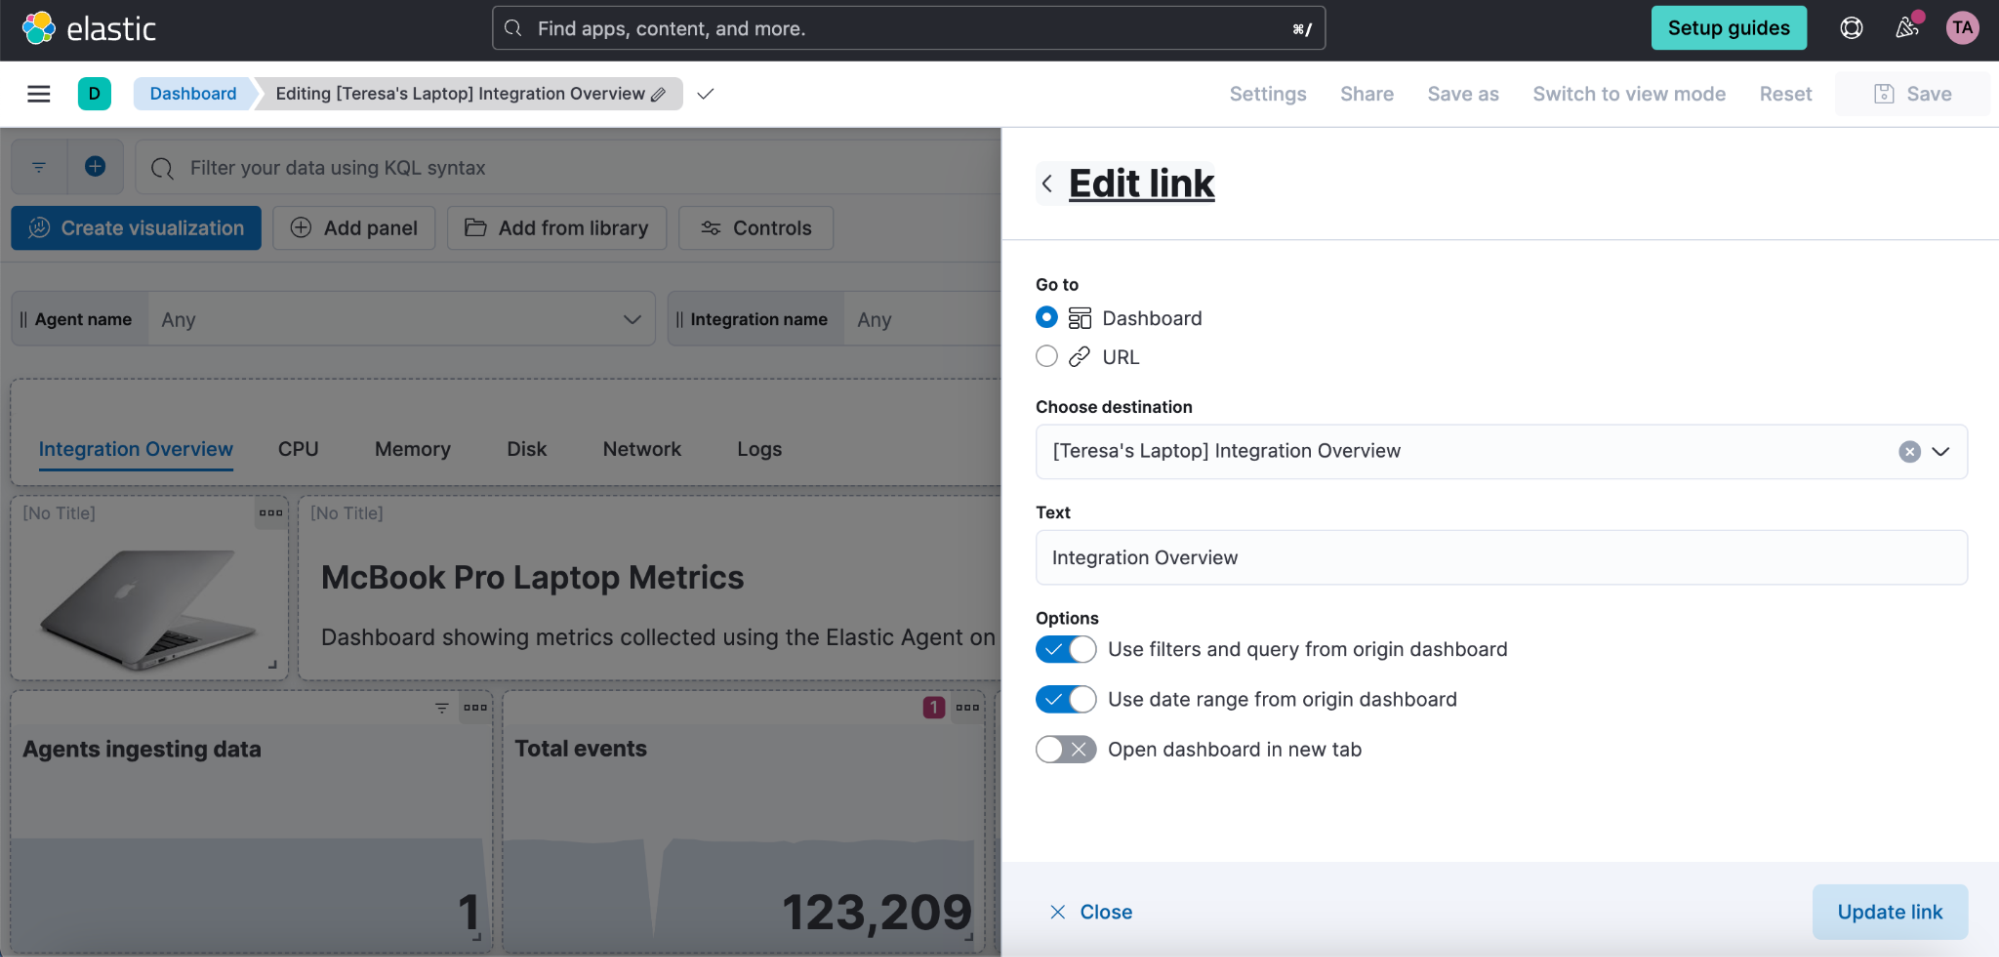
editYou can now easily navigate from one dashboard to another using the links panel. Better organize your dashboards and make them more performant by chunking them in multiple dashboards with fewer visualizations and linking them together. You can carry over your filters, query, and time range when navigating to other related dashboards. Display your links horizontally or vertically as it better suits your dashboard layout. You can also use the links panel to include external links in your dashboards, such as to your wiki page or other applications. Decide whether you want to open the links in the same browser tab or in a new one.
Color mapping for enhanced data visualization
editColor is a fundamental visual element, alongside position and shape, that plays a crucial role in conveying information effectively.
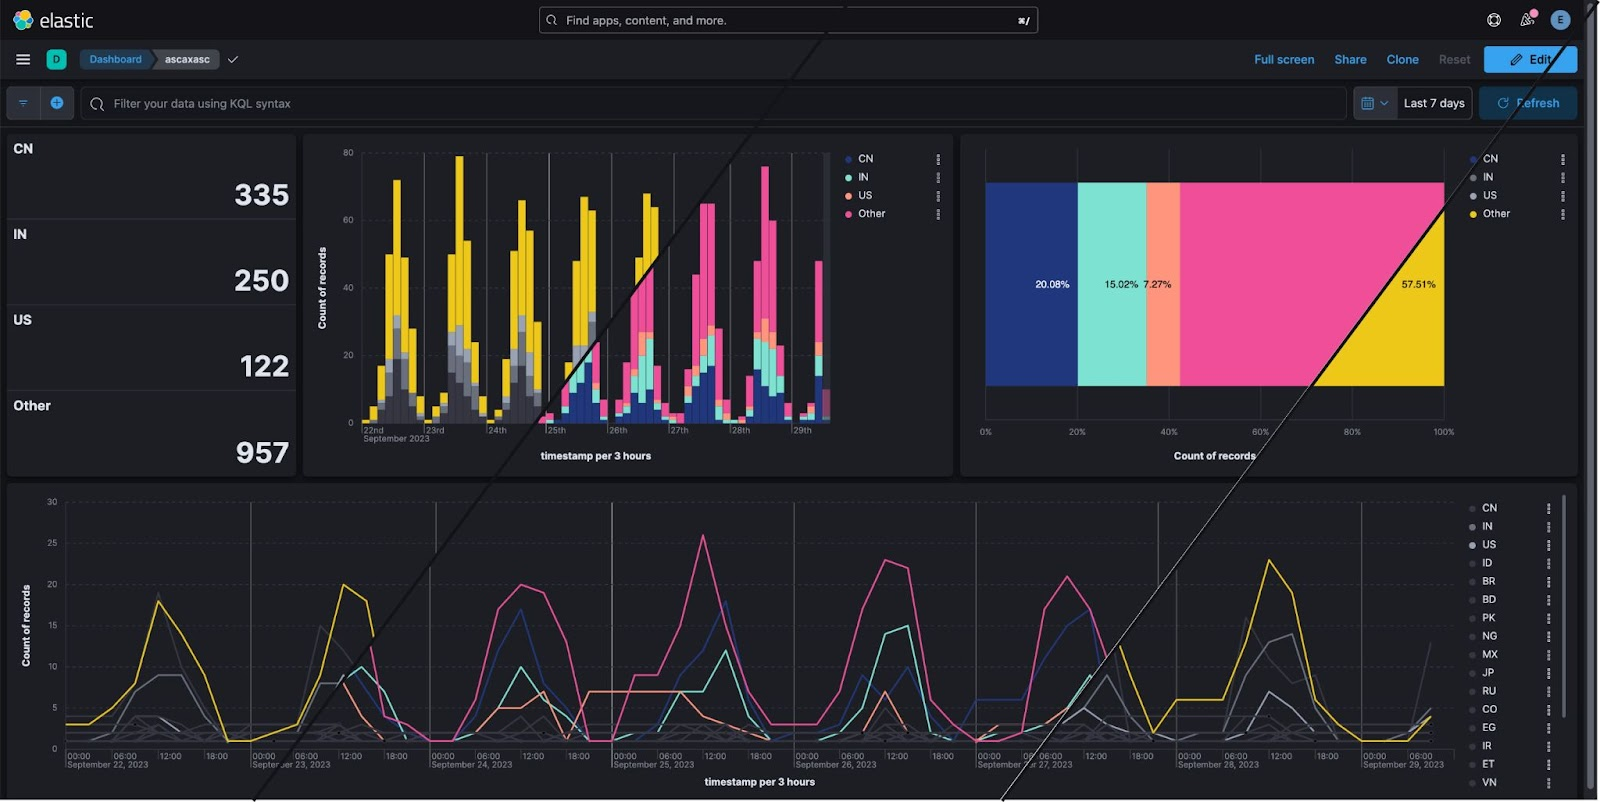
Here’s what our new color mapping feature offers:
- Effortless categorization: Easily assign one or more field categories to specific colors. This makes it simpler than ever to organize and understand your data.
- Guided color selection: Our intuitive color chooser provides you with predefined palettes that ensure your charts not only look great, but also align seamlessly with different Kibana themes.
- Enhanced color palettes: We’ve reintroduced a clear concept of color palettes, making it easier for you to select and apply gradients, improving the overall aesthetics of your visualizations.
Whether you’re working with cartesian, partition, or tag clouds charts, these enhancements are designed to help you make the most of your data. With this feature, you can expect an improved ability to categorize, differentiate, and emphasize data points on your charts, ultimately leading to better insights and more visually appealing dashboards.
Cross-cluster search (CCS) query inspector
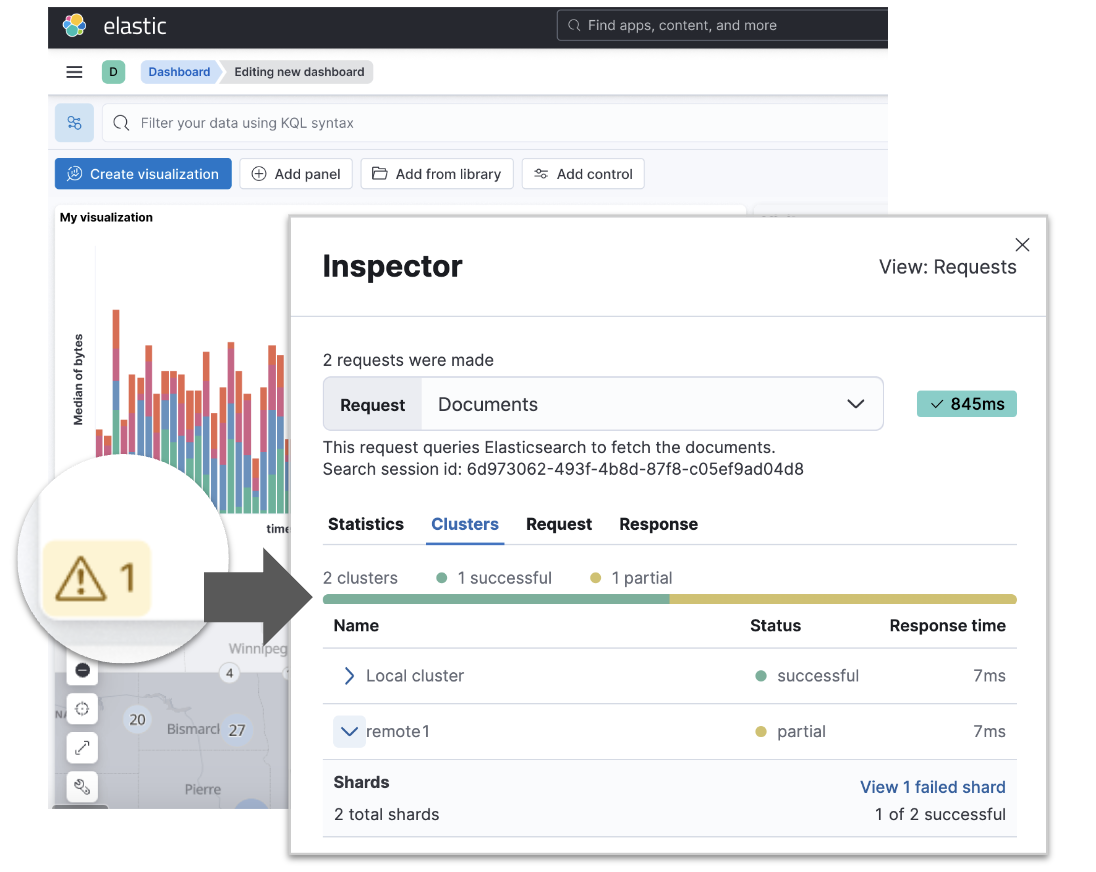
editCustomers querying data from multiple clusters (CCS queries) will get more information about each of the cluster’s responses. For each of the visualizations in a dashboard as well as in Discover, you can look at response times per cluster and shard failures. This is especially important when one or more clusters are not able to provide all the data, so you know that you are looking at partial results and why they fail.
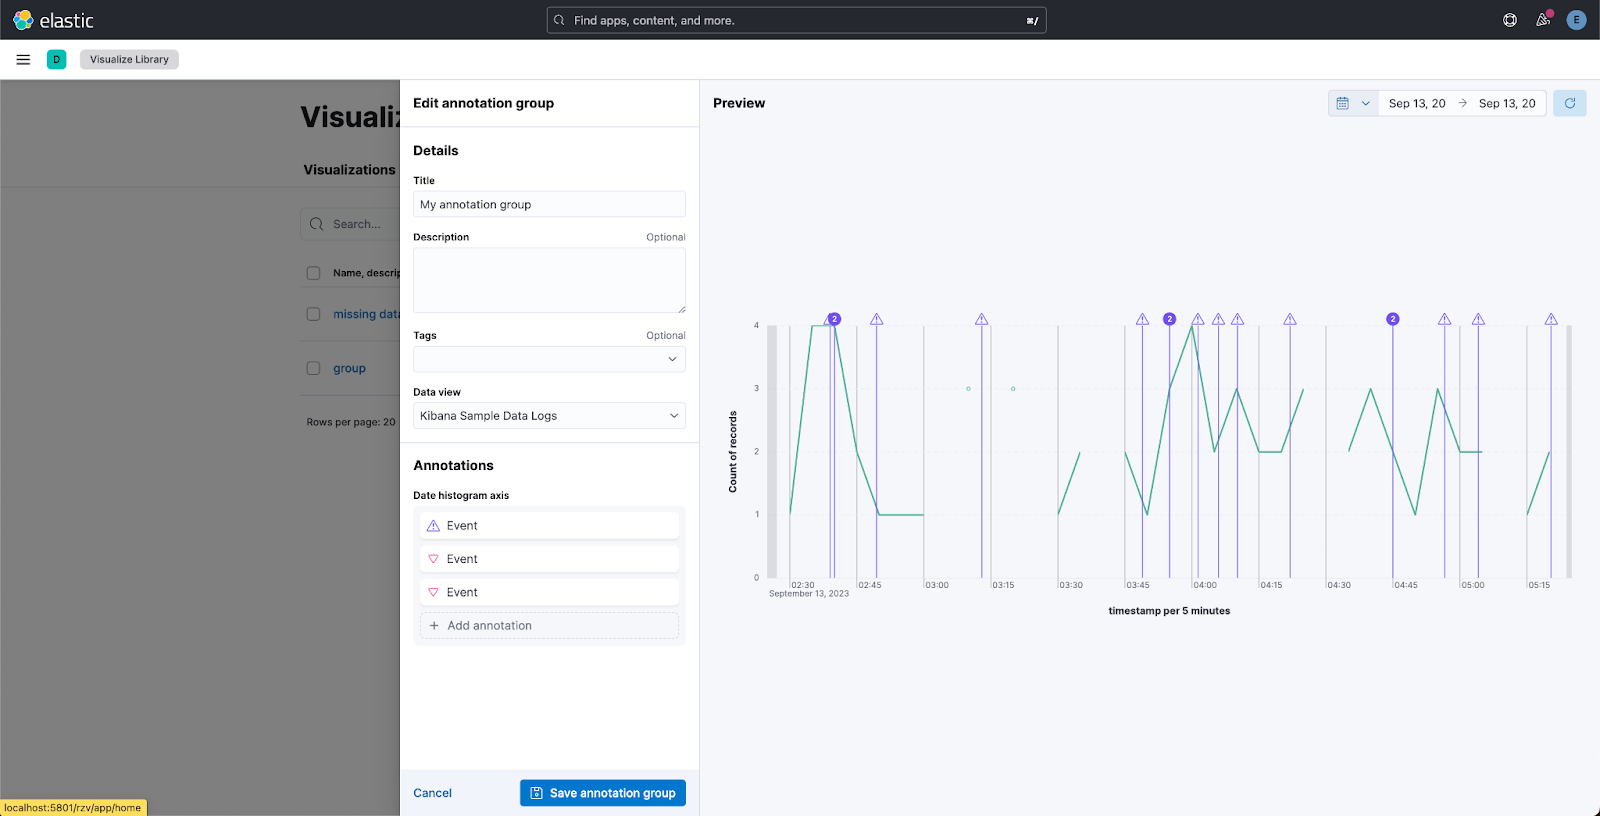
Individual annotation editing from the library
editWe’ve introduced full annotation group editing in the Visualize Library. Now, you can easily edit shared annotation groups without leaving Lens. No more searching for consuming visualizations.
Machine Learning
editELSER is improved and is now generally available
editIn 8.8, we introduced Elastic Learned Sparse Encoder in technical preview. ELSER is Elastic’s text expansion language model for AI search. It offers superior relevance out of the box, without the need for retraining on in-domain data or any other ML or MLOps effort. Deploy it with a couple of clicks from Elastic’s UI and start leveraging the power of AI with your search.
In 8.11, we’re releasing a generally available second version. ELSER model-2 comes in two versions:
- The optimized model, which runs on the linux-x86_64 platform
- The cross-platform model
Both ELSER model-2 versions, platform-optimized and cross-platform, show improved relevance compared to the original ELSER release, as measured against the BEIR benchmarks. Importantly, the optimized version also shows significantly improved performance (reduced inference latency). The Elastic Cloud supports the optimized version and so Elastic Cloud users will benefit from the materially improved performance of the optimized ELSER model-2.
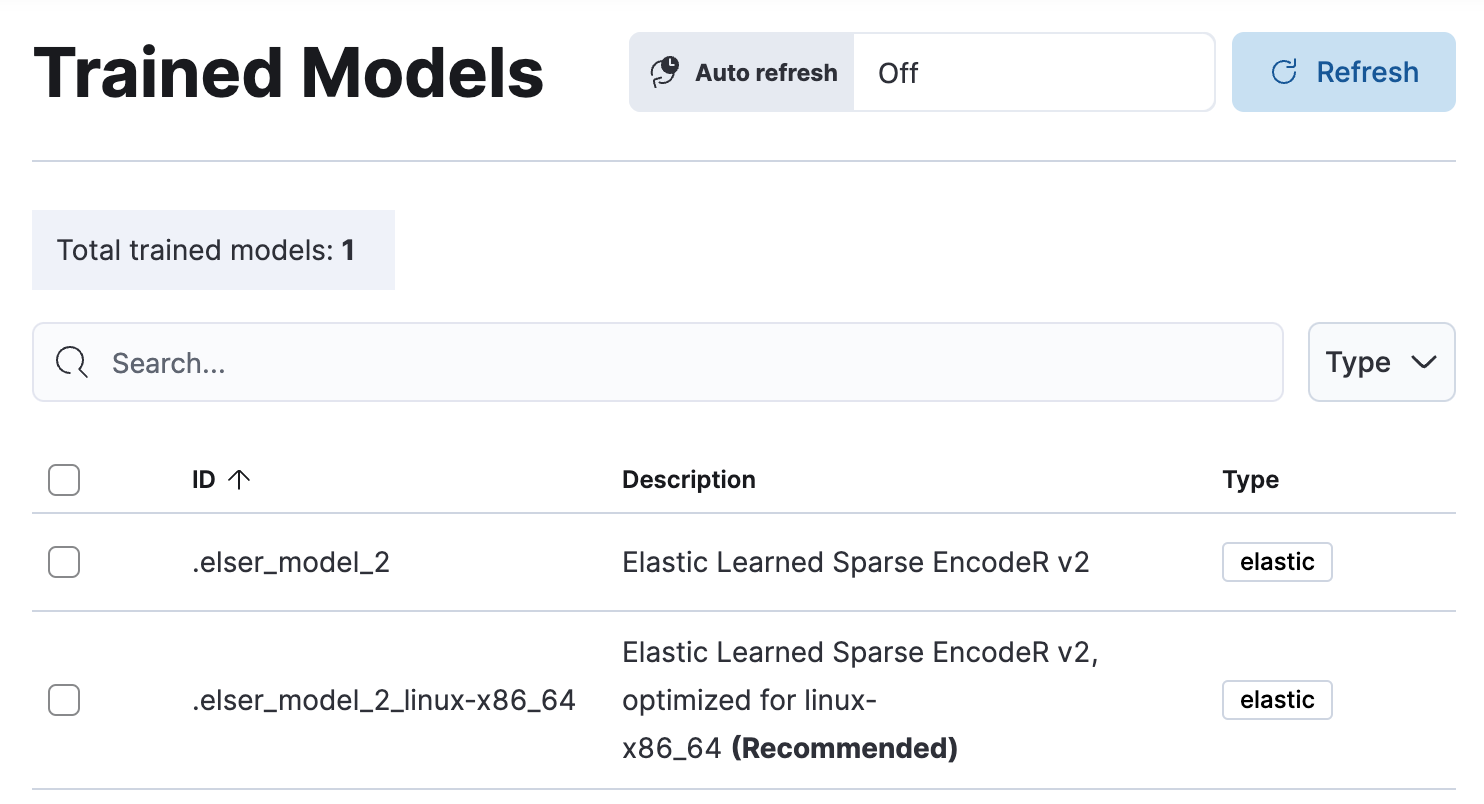
The original version of ELSER (the model available prior to 8.11) will remain in technical preview.
Inference APIs
edit[preview] This functionality is in technical preview and may be changed or removed in a future release. Elastic will work to fix any issues, but features in technical preview are not subject to the support SLA of official GA features. We are working to introduce a unified inference API that abstracts away the complexity of performing inference on different models that are trained for different tasks. The API introduces a simple, intuitive syntax of the form:
POST /_inference/<task_type>/<model_id>
In 8.11, we’re’releasing a contained first MVP iteration of this framework, which initially only supports ELSER. This greatly simplifies the syntax for creating an inference pipeline.
More importantly, in the future the new inference API will support both internal and external models and will integrate with the LLM ecosystem for our users to have the most powerful AI effortlessly and seamlessly at their fingertips, through a unified, self-explanatory API.
AIOps: Log rate analysis supports text fields
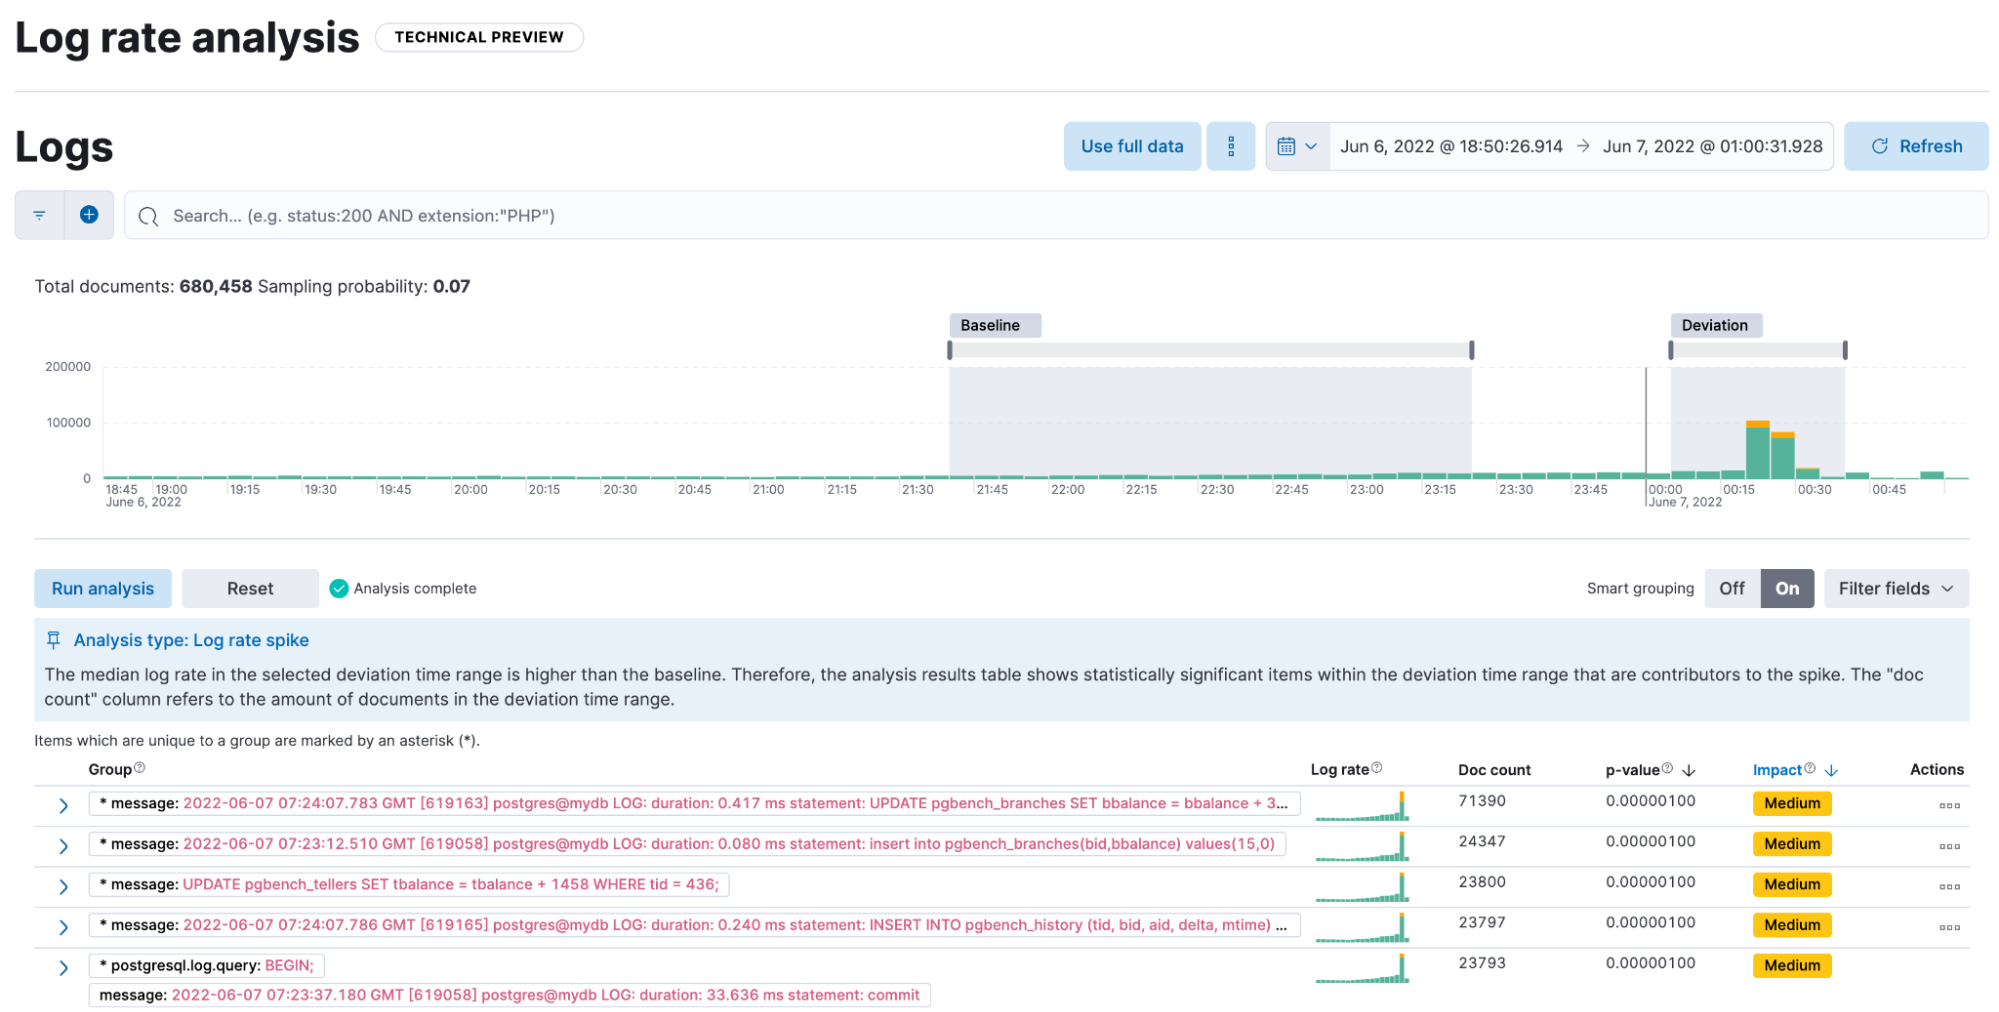
edit[preview] This functionality is in technical preview and may be changed or removed in a future release. Elastic will work to fix any issues, but features in technical preview are not subject to the support SLA of official GA features. Continuing enhancing log analysis capabilities with smart AIOps tools for drastically shorter mean time to repair. We now support detection of log rate changes that are due to text fields, for example the common message log field. Previously log rate change was limited to detecting spikes and dips caused by keyword fields. By adding text fields, we’ve incorporated pattern analysis into log rate analysis. That has significantly reduced the time it takes to detect and diagnose events that used to go unnoticed for periods of time.
Data drift workflows
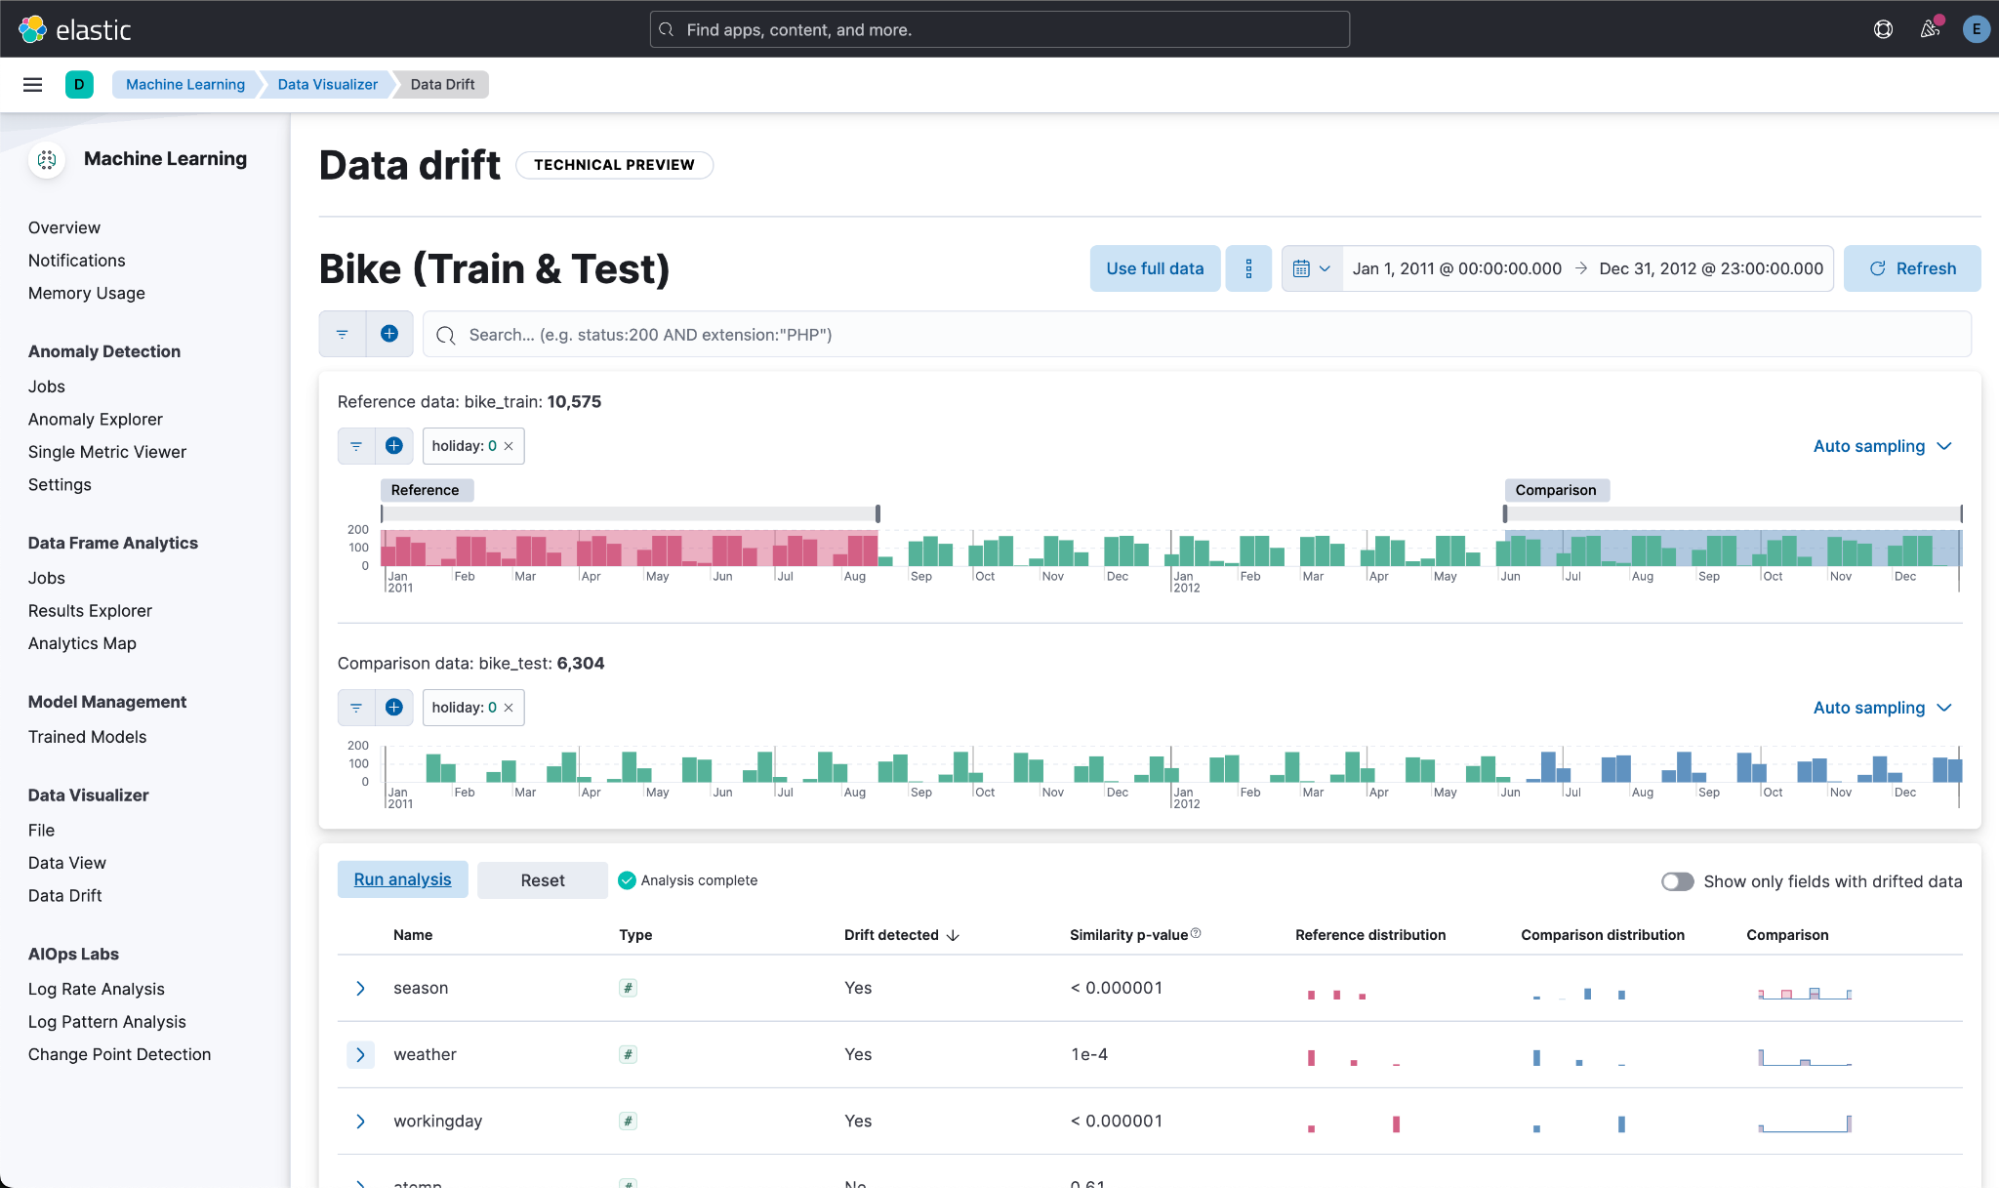
edit[preview] This functionality is in technical preview and may be changed or removed in a future release. Elastic will work to fix any issues, but features in technical preview are not subject to the support SLA of official GA features. In 8.10, we introduced the Data comparison view to help you detect data drift. In 8.11, we have renamed it to Data drift and we have enhanced it to include workflows that help you visualize changes in the model input data and detect potential model performance degradation over time.
Improvements in anomaly detection embeddability and data frame analytics pipelines
editWe have improved the UX for attaching anomaly swim lanes and anomaly charts to dashboards. It is now more friendly and consistent with the same functionality from Lens. In addition, you can now attach these ML charts to new dashboards (previously this was only able to be done for existing ones).
In Data Frame Analytics, we previously added the ability to link directly to Discover and Dashboards from the results data grid filtering for the row’s field/values for all visible columns. For improved usability, you can now do this during the job creation as well. We have also made UX improvements for the deployment of trained models from Data Frame Analytics jobs, including an option to reindex your data at the end of the ingest pipeline creation.
ResponseOps
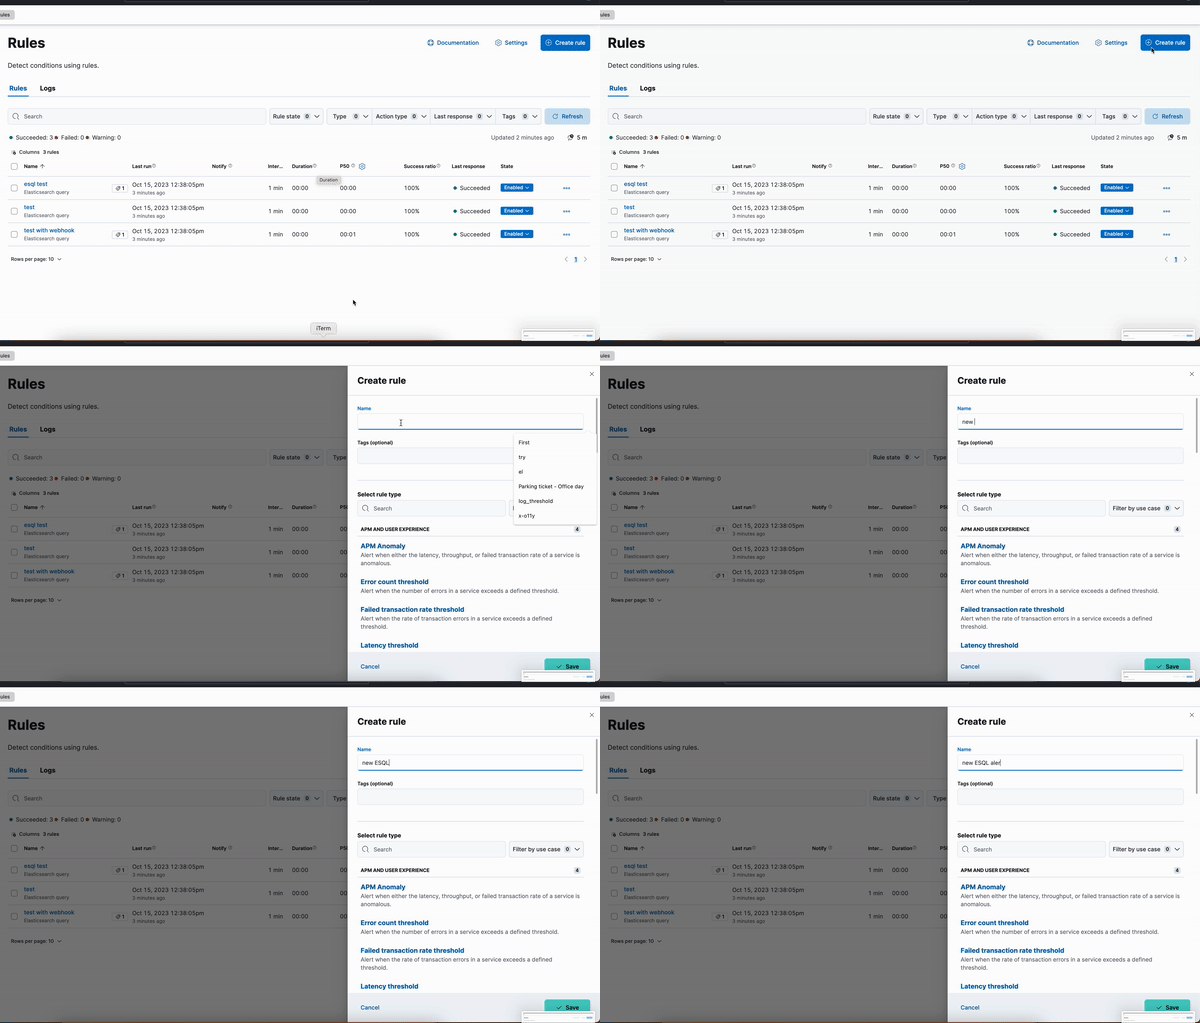
editNew ES|QL rule type
editA new ES|QL alerting rule type is now available under the existing Elasticsearch rule type. This rule type brings all the new functionalities that are available within the new and powerful language, ES|QL, to Kibana Alerting to allow and unlock new alerting use cases.
With the new type, users will be able to generate a single alert based on defined ES|QL query and preview the query result before saving the rule. When the query returns an empty result no alerts will be generated.
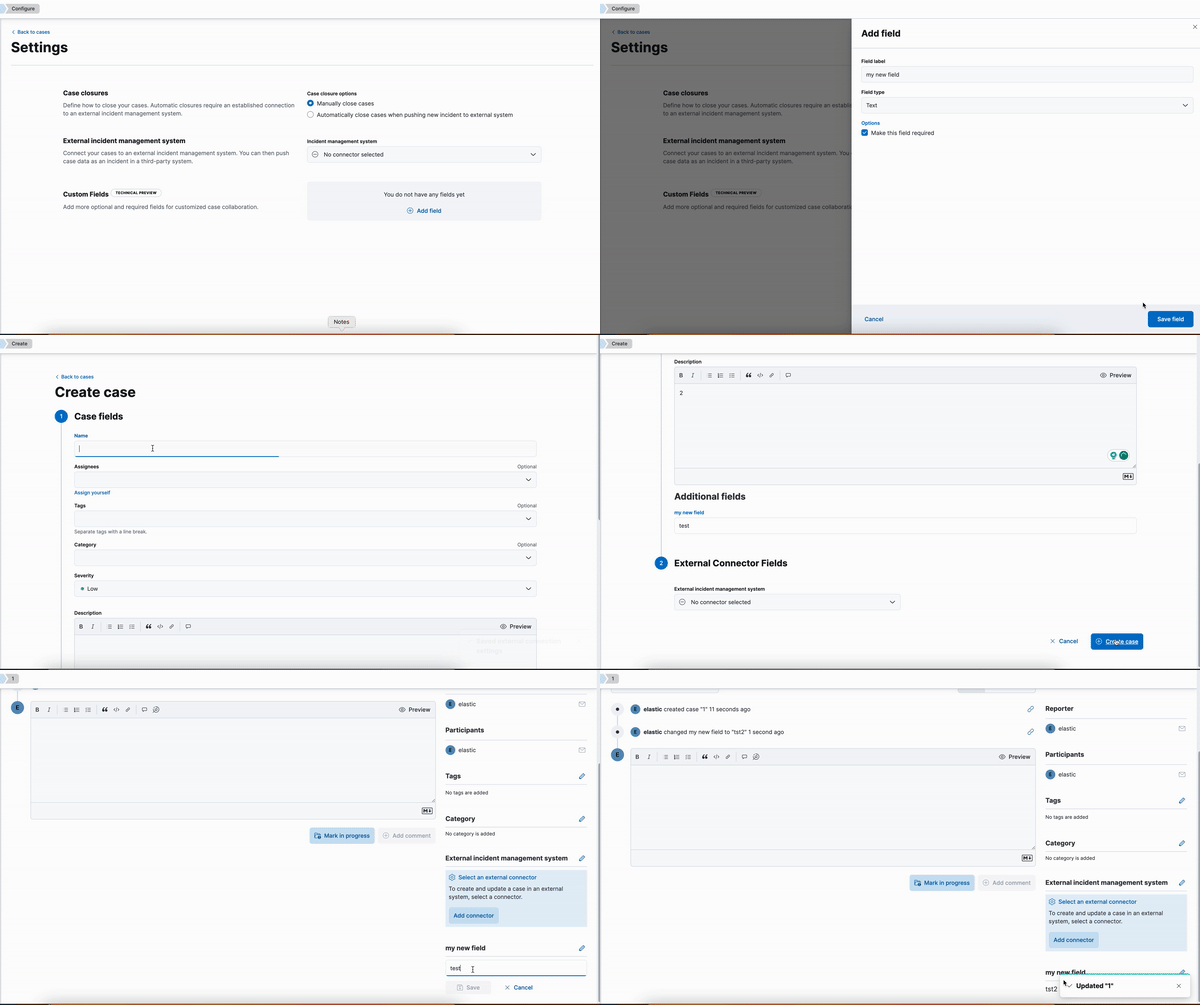
Kibana cases custom field
editA new functionality is now available in Kibana cases. Users will be able to add custom fields to the case structure, so they can use it for better classification and case enrichment. As a first step, those fields will be available in the case view only. In the next step, we’re planning to have more field types, dedicated privileges, support filters, and search capabilities in the case table.
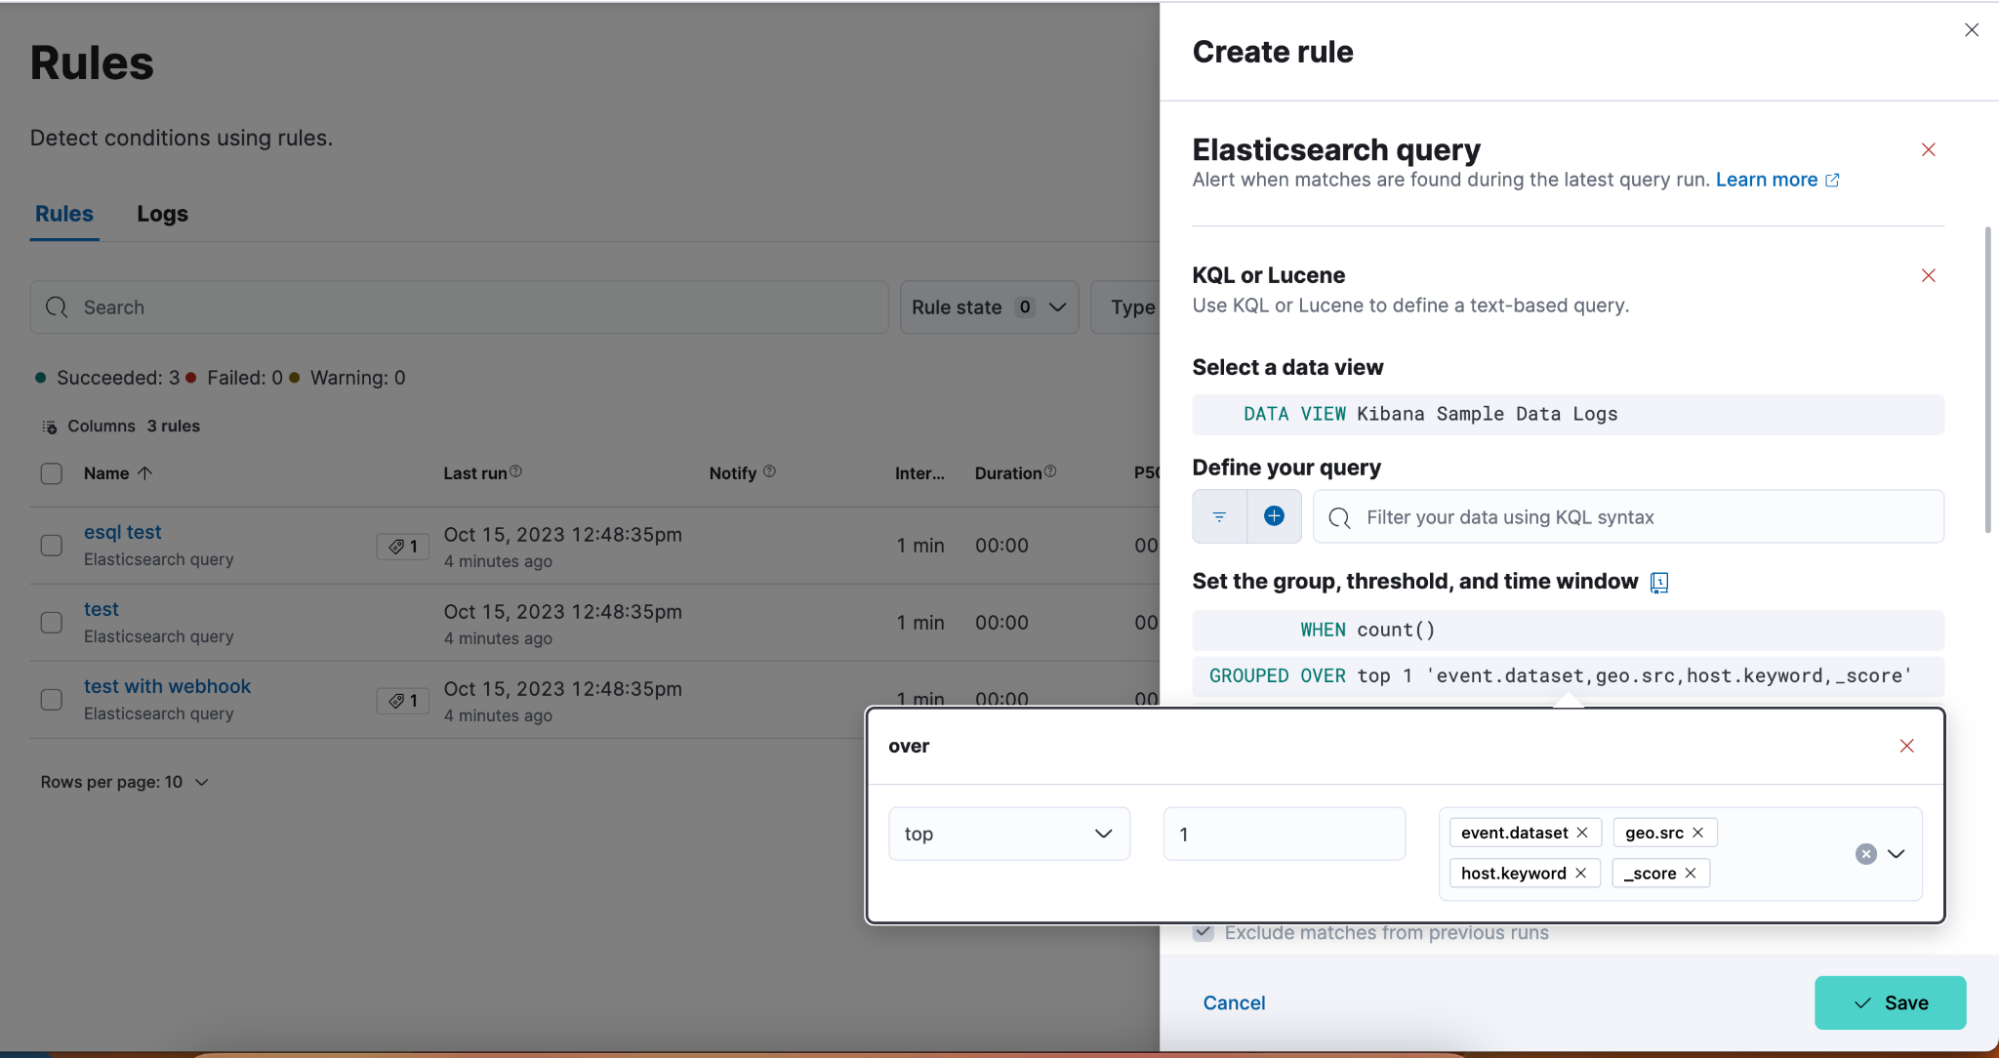
Supporting multi levels of term aggregations in Elasticsearch rule type
editThe existing Elasticsearch alerting rule is now supported by multiple selection when grouping by alert fields, which allows you to define multiple layers of term aggregations.
Slack connector - allow List
editThe Slack connector supports a new allow list, so customers will be able to manage the available Slack channels within the alert actions.
Observability
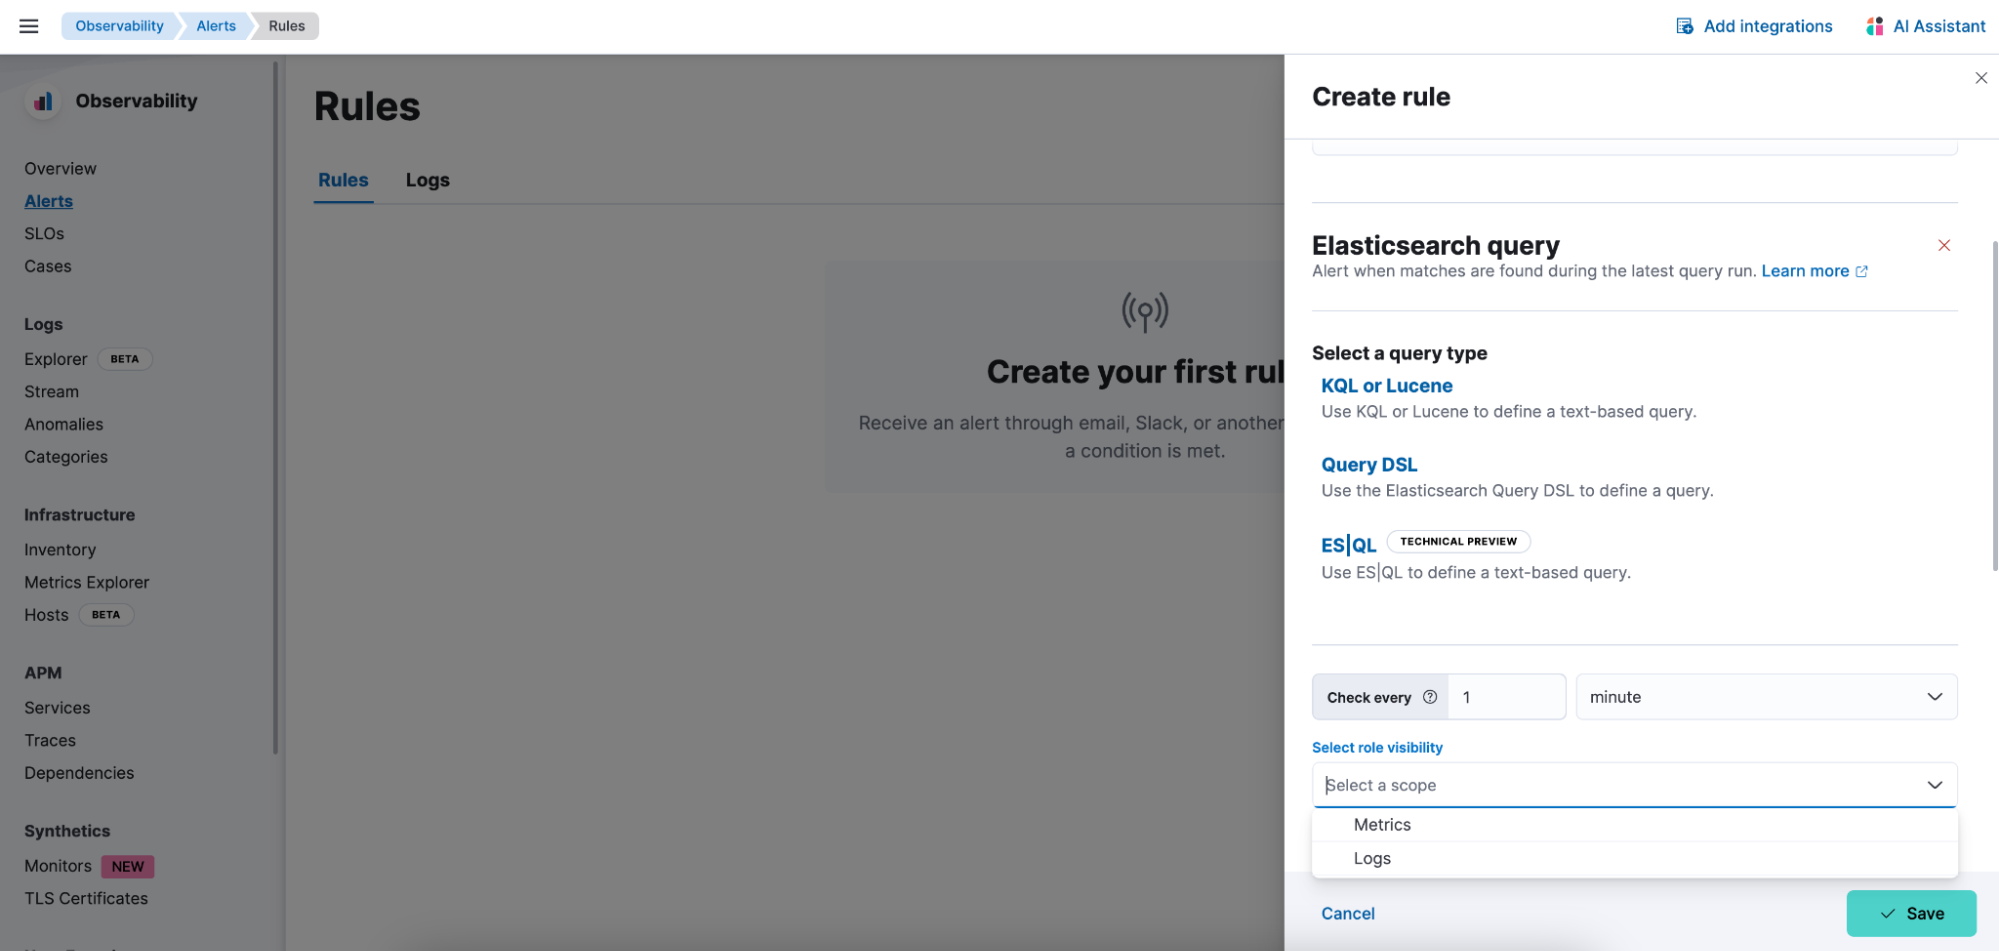
editElasticsearch alerting rule now available in Observability
editThe Elasticsearch alerting rule is now available in Observability. Before this update, Observability customers who leverage the Elasticsearch rule were required to move between Stack Management and Observability to manage their alerts. To manage the Observability roles properly, we added a new field to determine which role can maintain the created rule and its generated alerts.
Global Experience
editCreate and manage ES|QL enrichment index policies
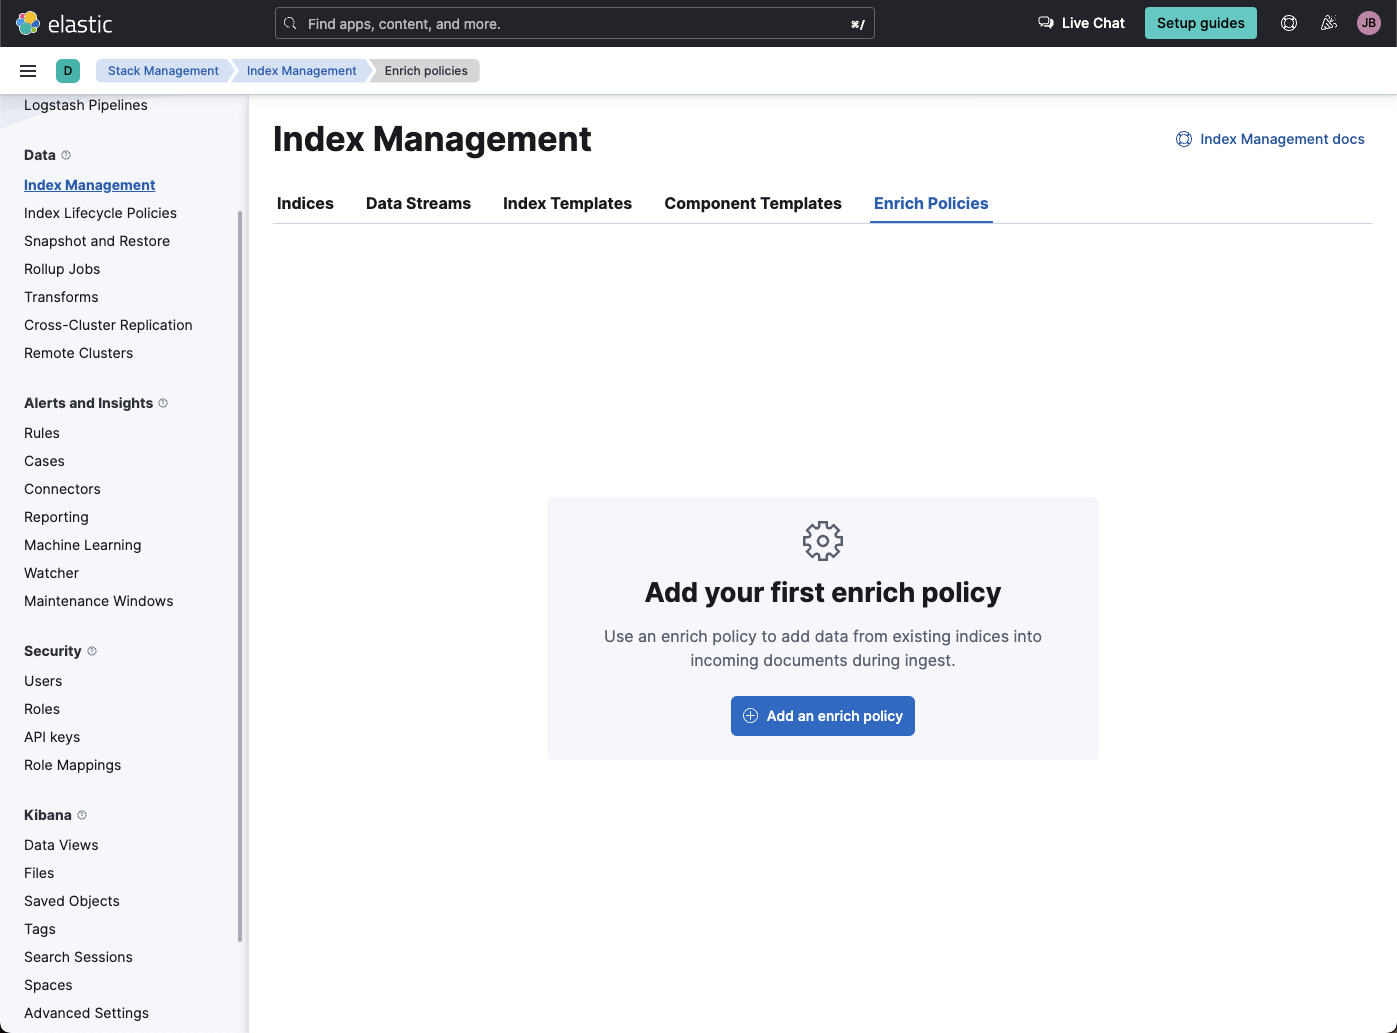
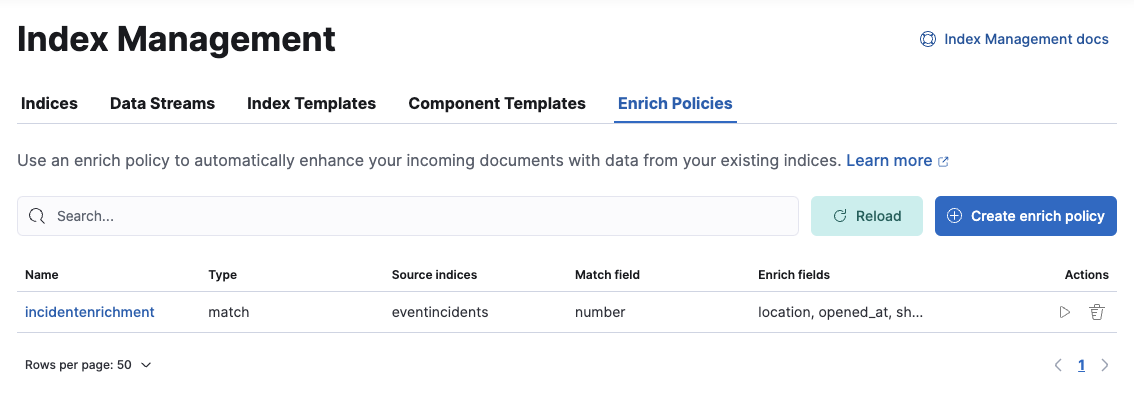
editIn support of our new ES|QL capabilities, we have added enrich policies to our Index Management experience. Users can now create their enrichment policies right from here and get started using it right away. Once configured, all enrich policies are available in the Enrich Policies tab.
Example of an ES|QL Query using an enrich policy with enrich:

Example of the enrich policies shown in the UI:
Start Discover ES|QL from global search
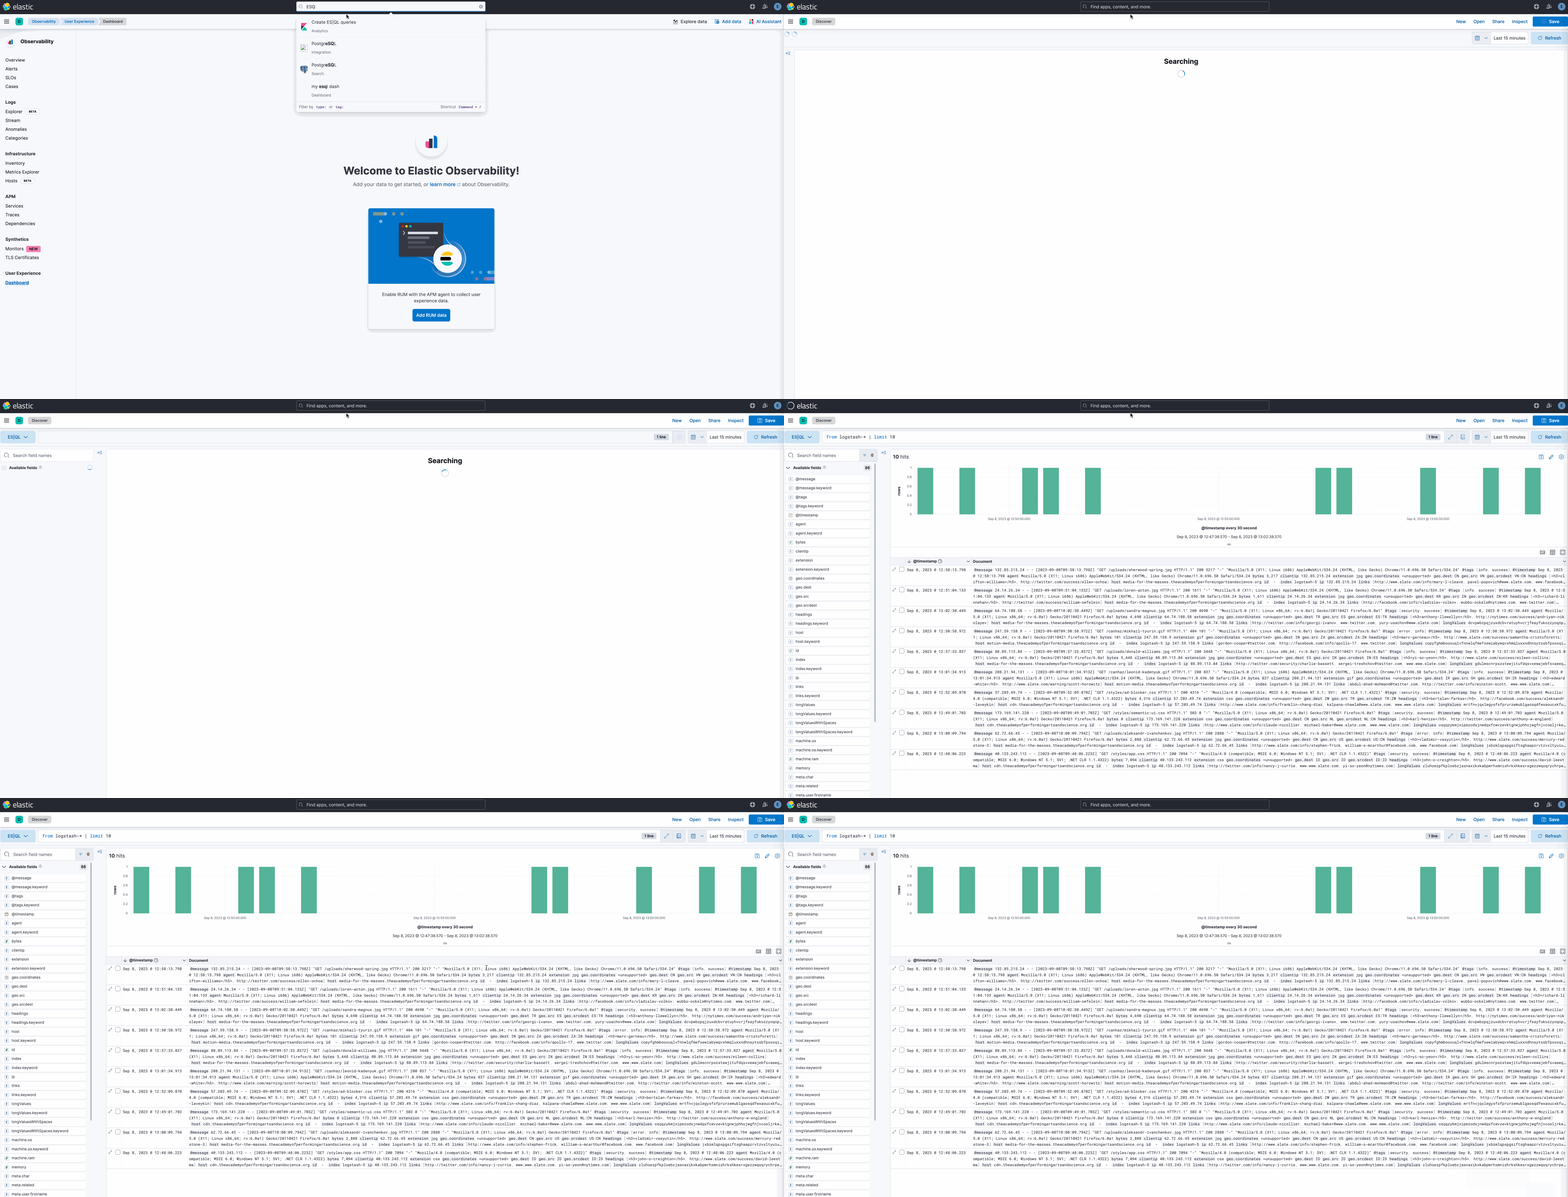
editDiscover searches are powered by KQL by default. You can easily switch to ES|QL mode within Discover and search your data with this new query language. You can also access ES|QL in Discover from the global search bar within Elastic. With just a few keystrokes, simply type in “ESQL” and you can access Discover with ES|QL enabled for you.
Access Elasticsearch connection details
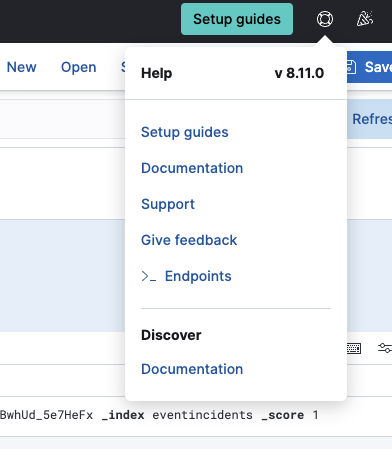
editYou can now view your Elasticsearch endpoint, Cloud ID, and even manage your API keys from many areas in Elastic such as integrations. You can also access the connection details on any page in Elastic using the help menu from the header bar.
AWS CloudFormation template updates
editWhen subscribing to Elastic using the AWS Marketplace, users have the option to quickly get set up with an AWS CloudFormation Template. This step allows you to create an Elastic deployment in the AWS region of your choice. We’ve updated the AWS CloudFormation Template with bug fixes and stability improvements to better help you get started.