What’s new in 8.8
editWhat’s new in 8.8
editHere are the highlights of what’s new and improved in 8.8. For detailed information about this release, check the release notes.
Previous versions: 8.7 | 8.6 | 8.5 | 8.4 | 8.3 | 8.2 | 8.1 | 8.0
Discover
editMachine learning pattern analysis
edit[preview] This functionality is in technical preview and may be changed or removed in a future release. Elastic will work to fix any issues, but features in technical preview are not subject to the support SLA of official GA features. You can now run a pattern analysis directly from Discover, making it easy to explore your machine learning log pattern data. In Discover, hover over a field to run and load the pattern analysis, then select one or more patterns to filter for or filter out, displaying only the logs you’re interested in.
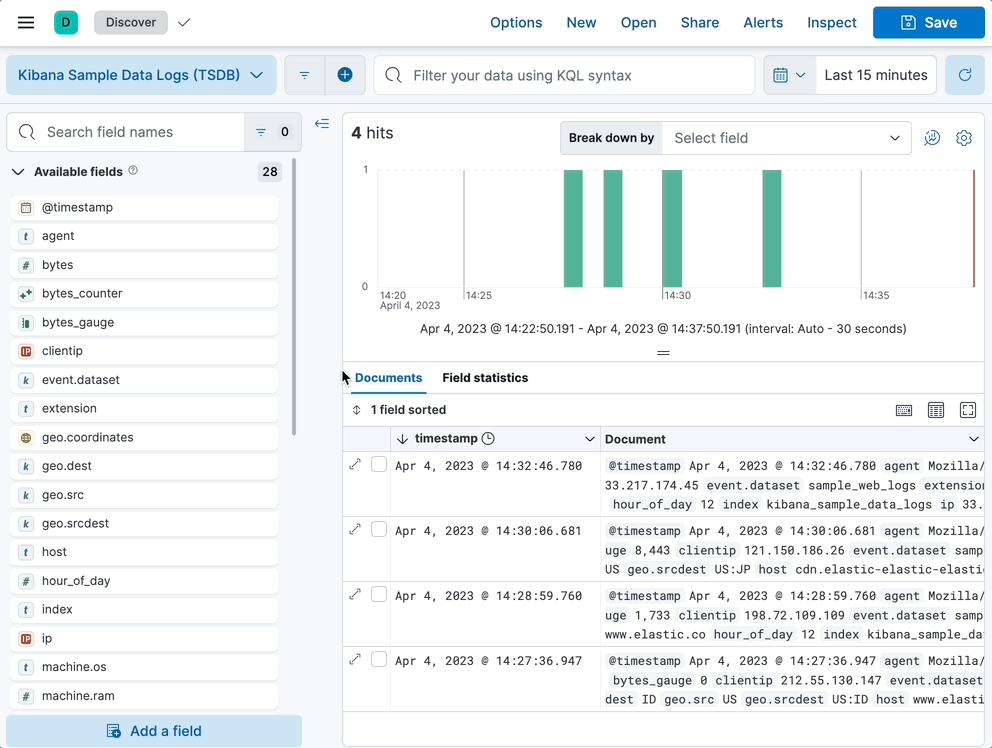
Add columns to the document table with drag & drop
editDiscover now provides you with a simple drag-and-drop experience that helps you explore your data in just a few clicks. From the Available fields list, drag the fields you want to explore to the document table, then watch as Discover automatically creates columns for each of your fields.
Lens
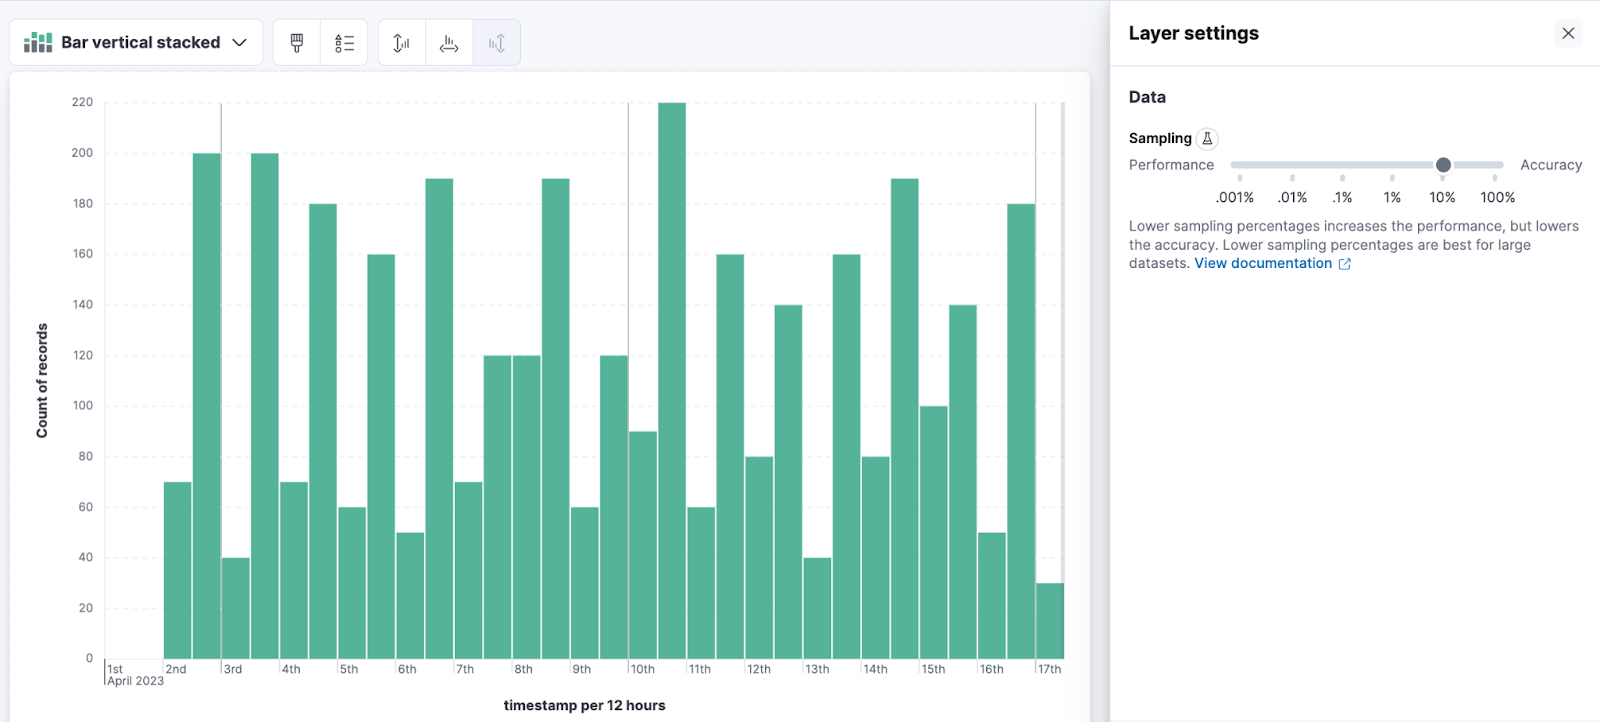
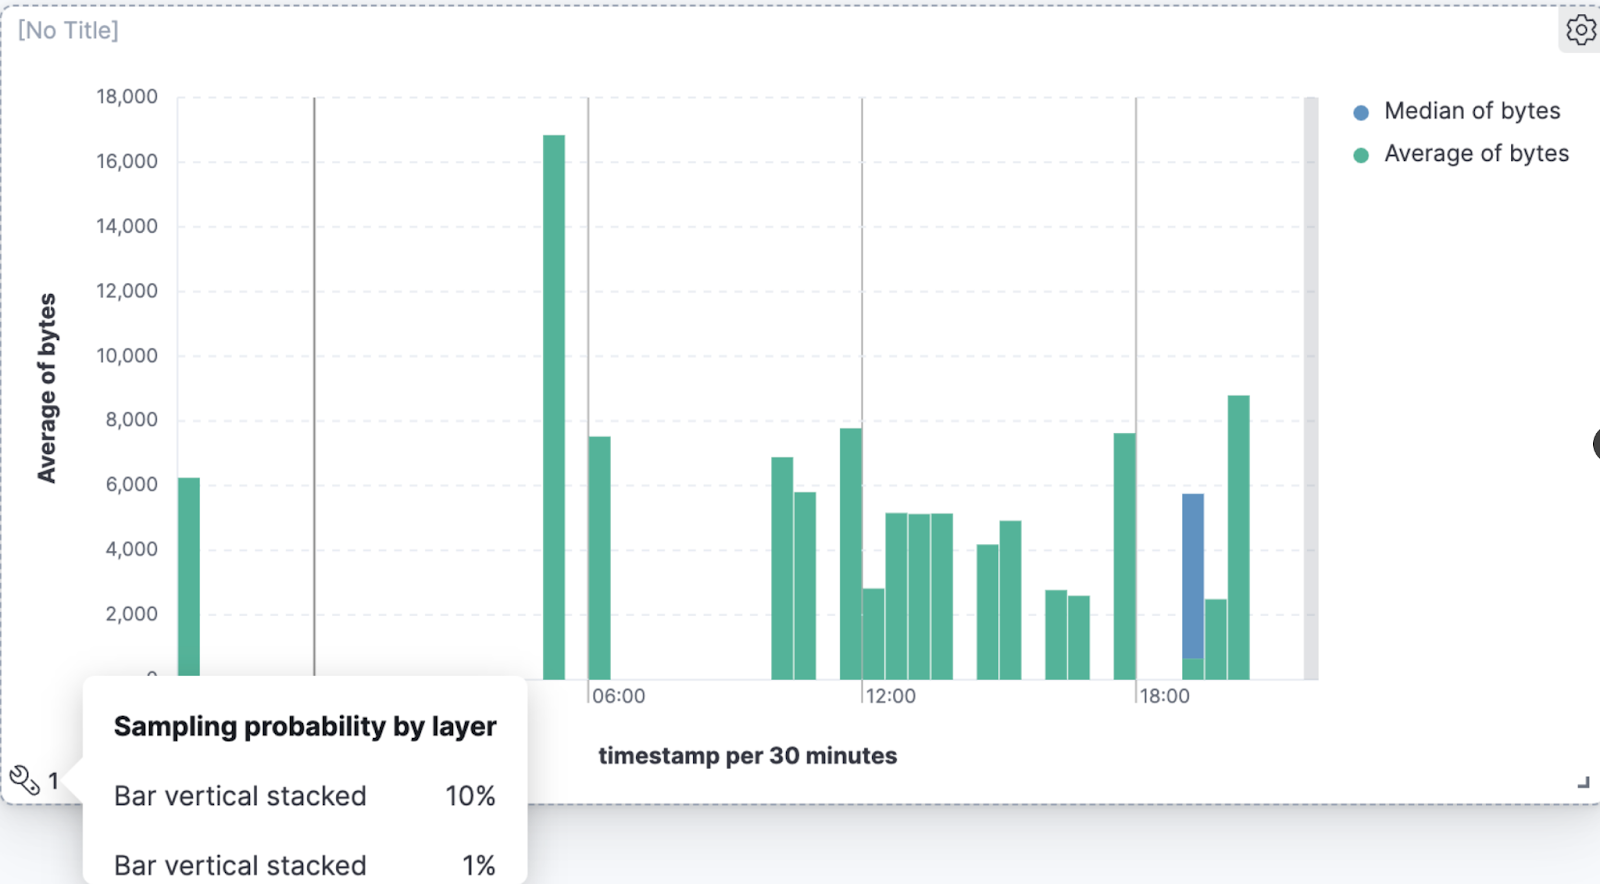
editBetter visualization loading time with sampling
editWhen you create visualizations for your dashboards, check out the new Sampling layer setting. Using the slider, select the percentage between performance and accuracy. Lowering the sampling percentage improves the visualization loading time, and raising the percentage improves the accuracy. When added to dashboards, the visualization now includes a sampling notification.
Improvements to metric charts
edit[preview] This functionality is in technical preview and may be changed or removed in a future release. Elastic will work to fix any issues, but features in technical preview are not subject to the support SLA of official GA features. When you create visualizations for your dashboards, you’ll find more design improvements and options for customizing your metric visualizations. The latest changes include:
- Improved text weight and size
- Display values with bytes and bits formatting, with prefix format support up to yottabyte and yottabit
- Display text string values
- Add icons
Dashboard
editA better way to change settings
editQuickly change your dashboard settings with a single click, and right from the dashboard. When editing your dashboards, the toolbar now includes a Settings option that opens a flyout, allowing you to change the title, description, tags, and more.
Maps
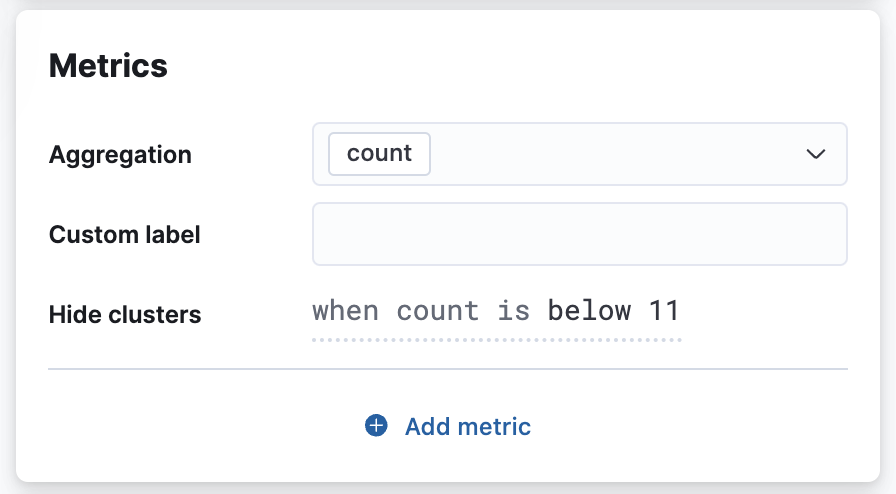
editReduce clutter with metric filtering
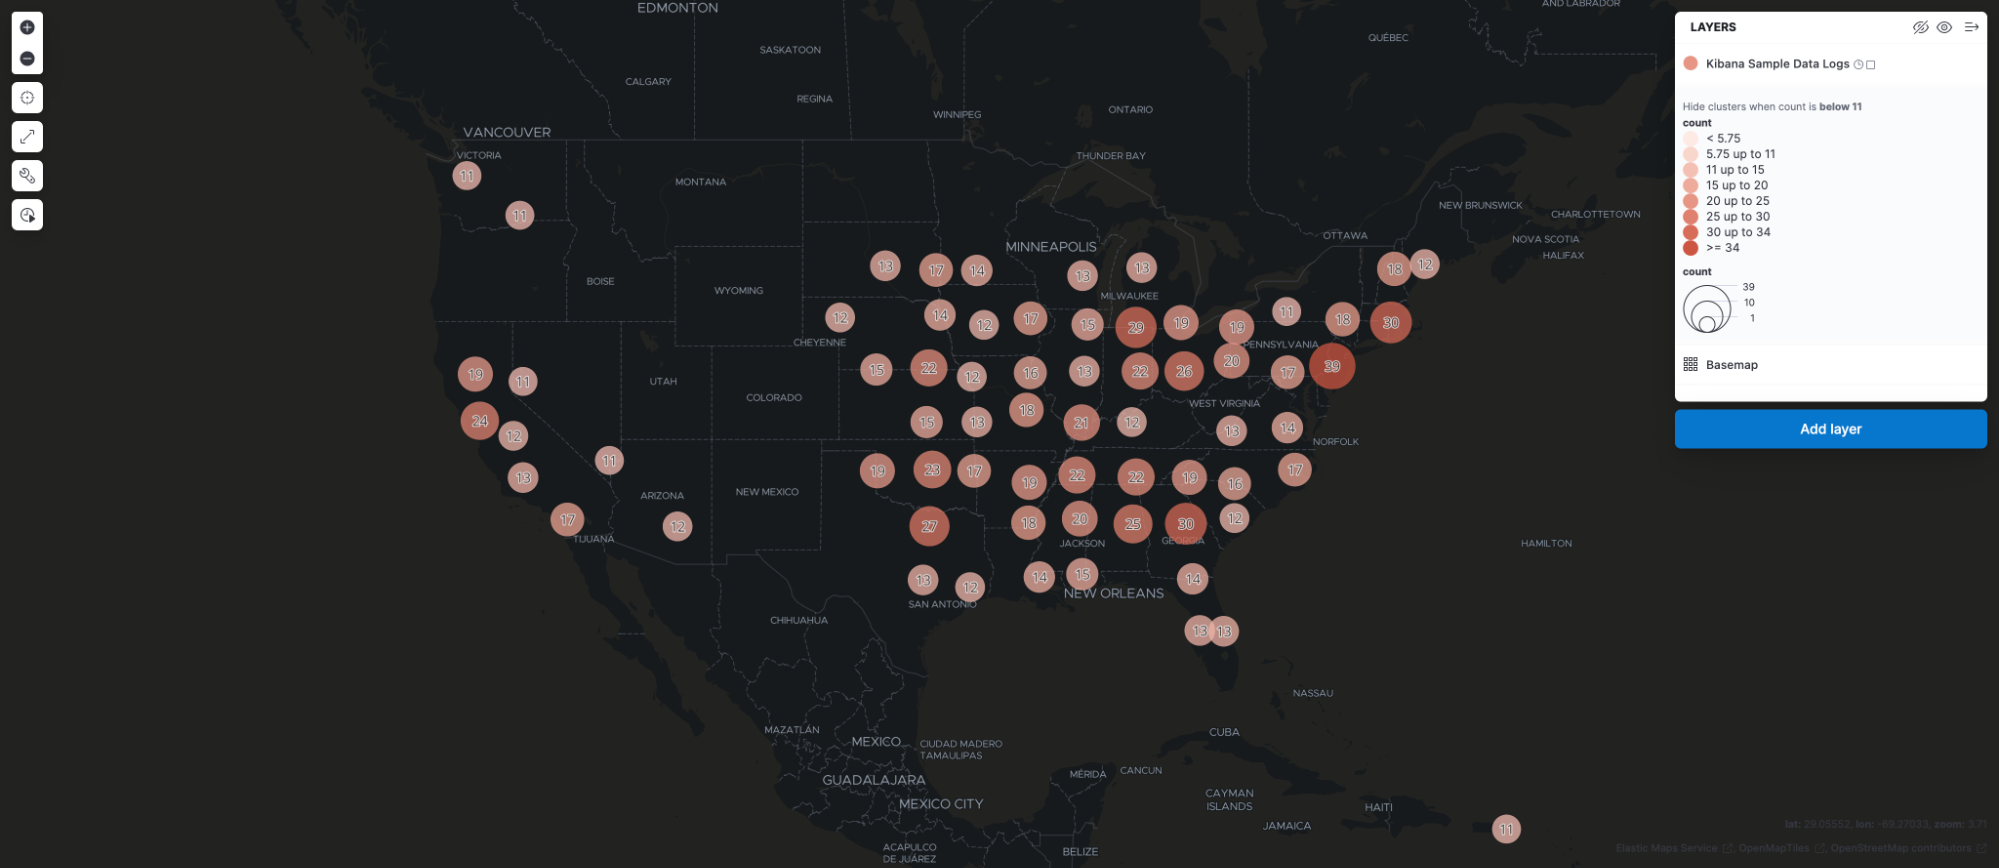
editUse metric filtering to hide aggregation buckets to reduce clutter and highlight areas of interest. Consider this map, where areas with more traffic are obscured by areas with little traffic.
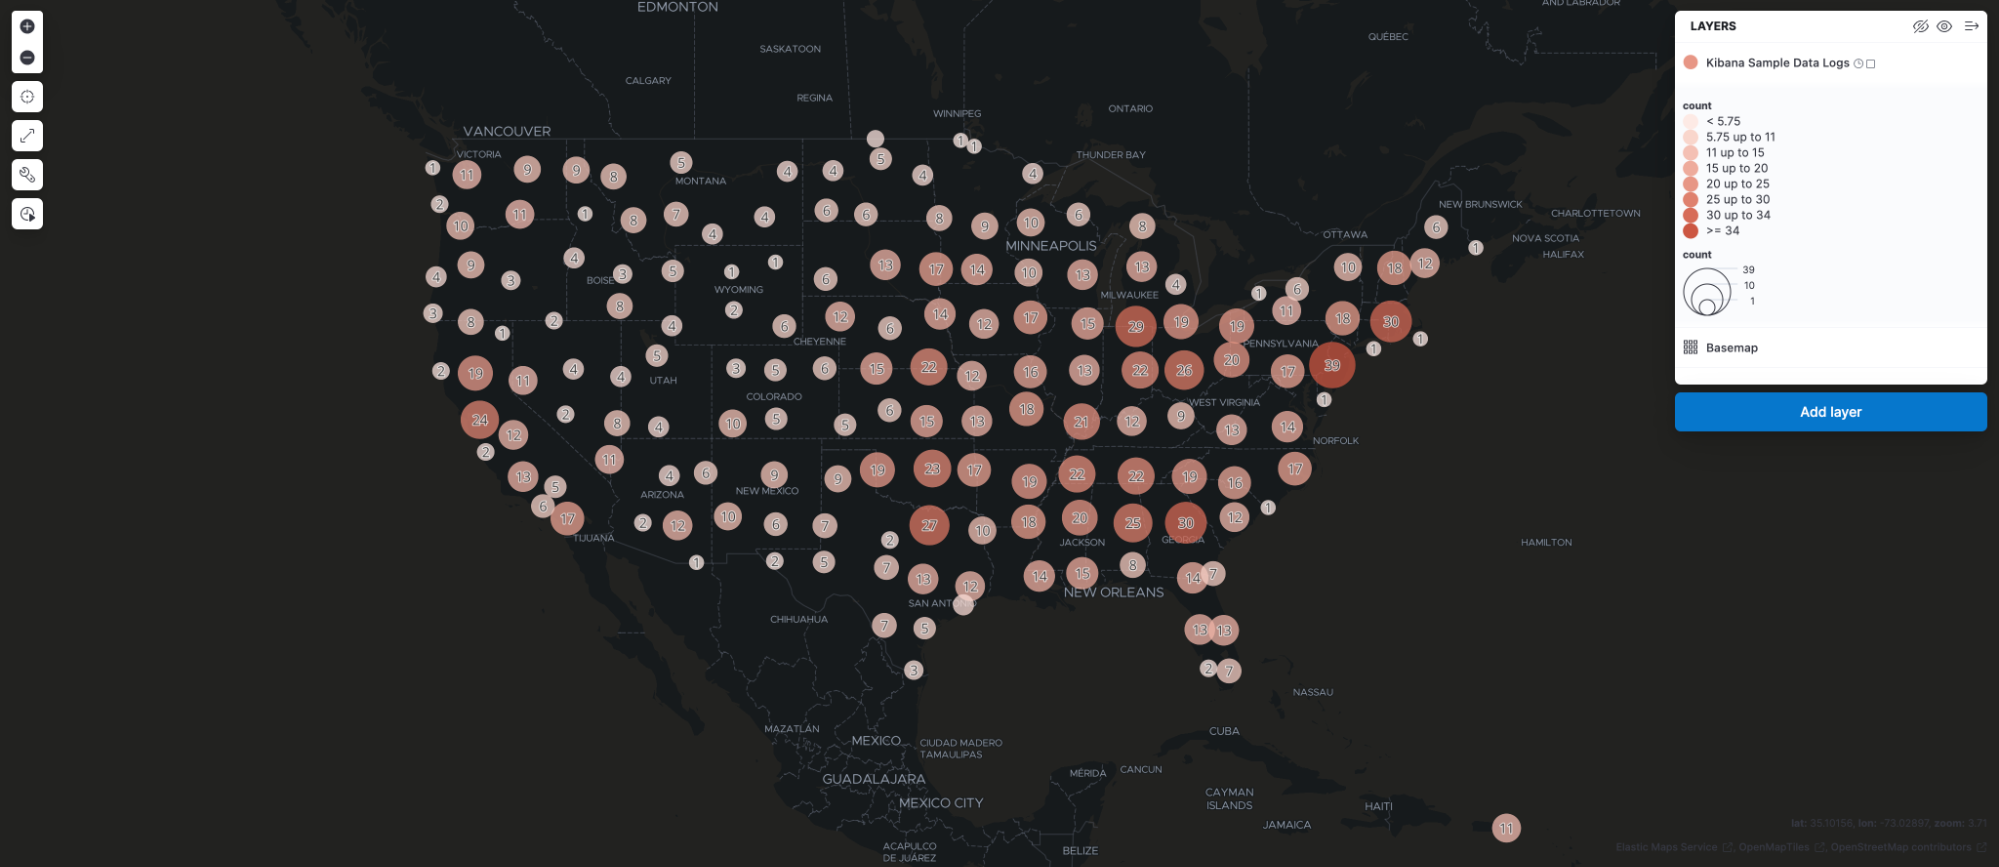
With configure metric filtering, you can hide the clusters with little web traffic.
The map now has less visual clutter and it’s easier to visualize areas with high web traffic, enabling your marketing team to better target high value areas.
Machine learning
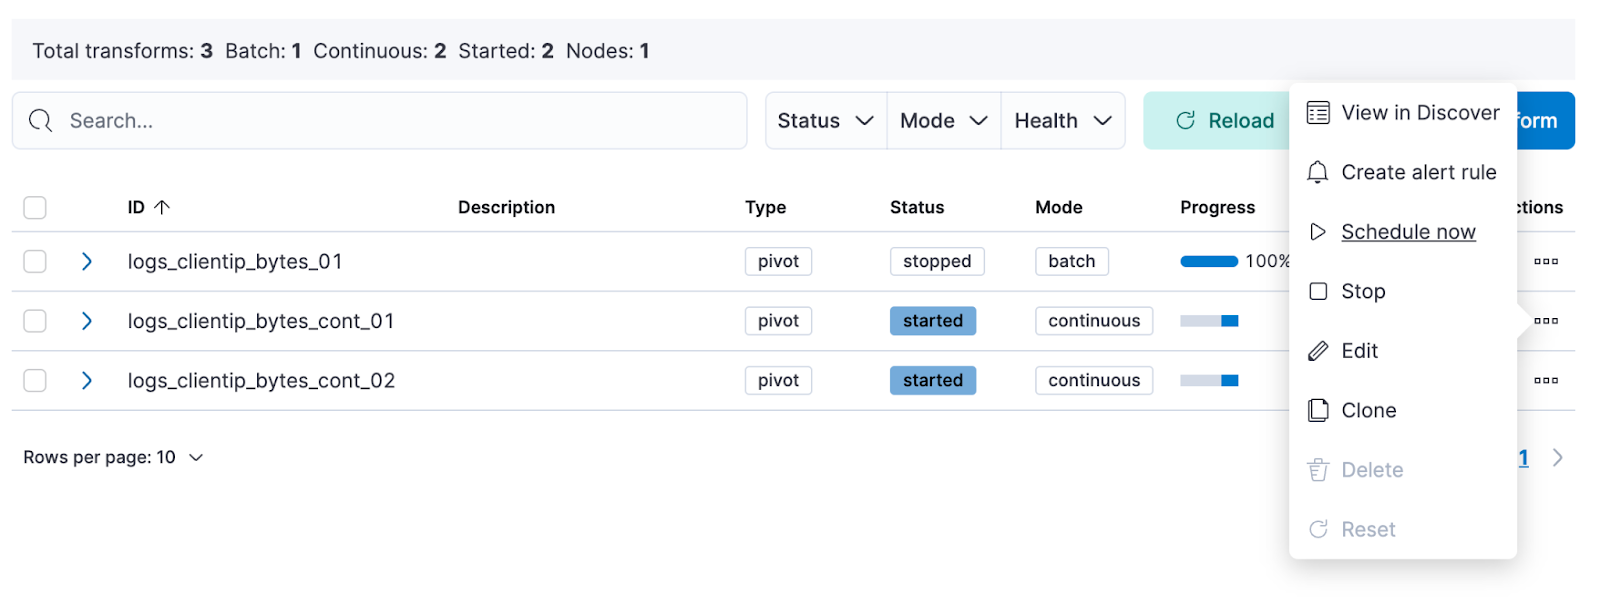
editTransform ‘schedule now’ added to UI
editThe transform UI has been updated to make use of the Schedule now functionality. This schedules a transform to instantly process new data without waiting for the configured interval between checks for changes in the source indices. This operation is useful for transforms with a longer frequency setting, where the transform can be activated to update directly after data has been uploaded. Use this feature on individual transforms and as a bulk action on multiple transforms.
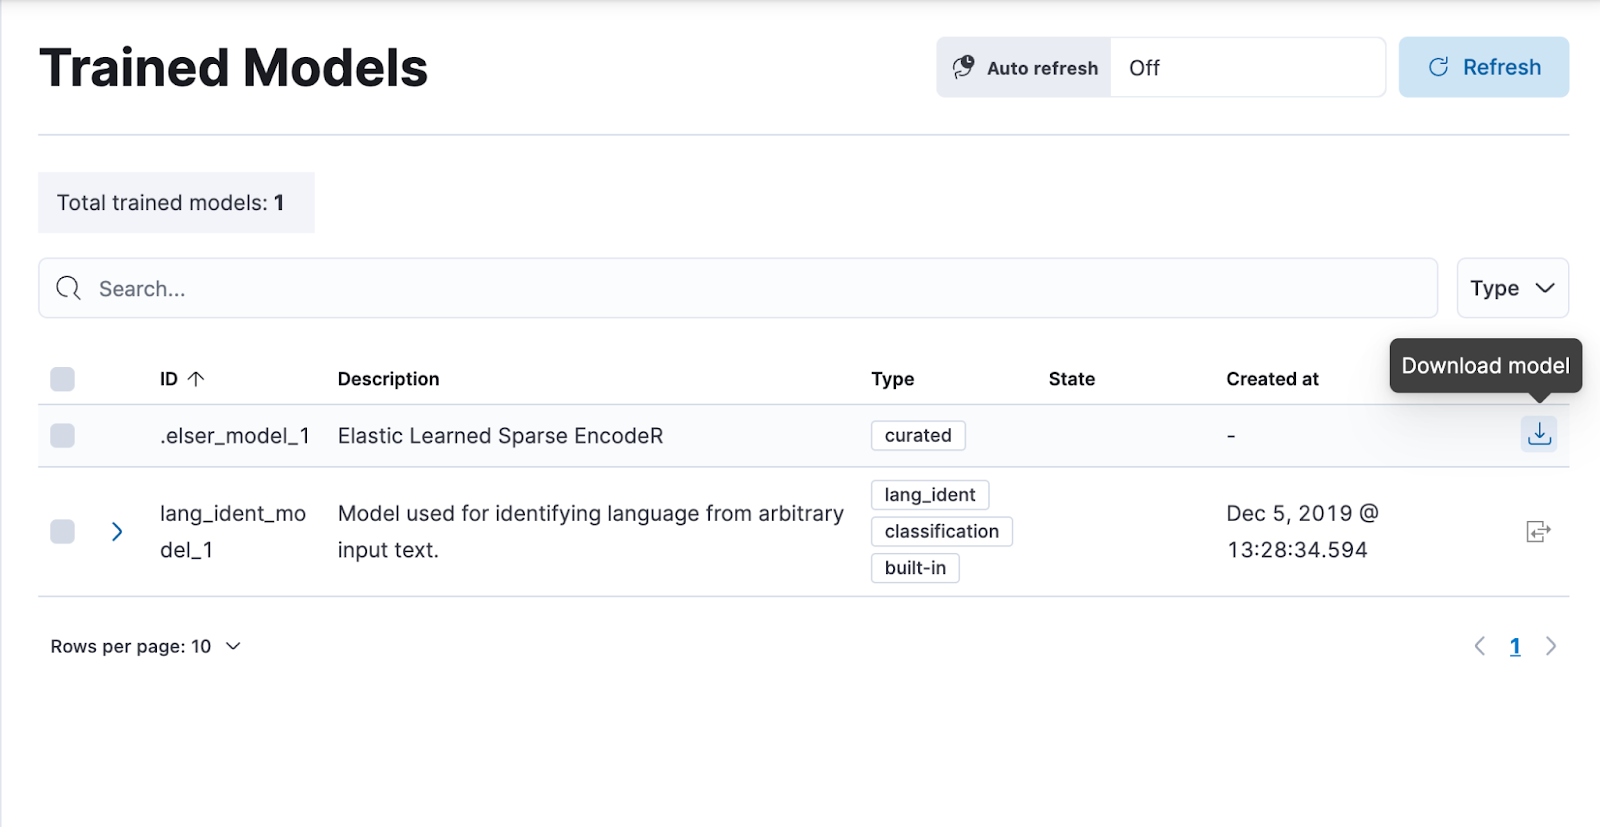
ELSER configuration on Trained Models UI
editElastic Learned Sparse EncodeR (ELSER) is a machine learning model newly added to the library. ELSER improves your search relevance by enabling you to perform semantic search. This search type operates on the meaning of words and does not search only on literal terms. The Trained Models UI enables you to easily download and deploy the model in your cluster and use ELSER in an inference pipeline or a text expansion query.
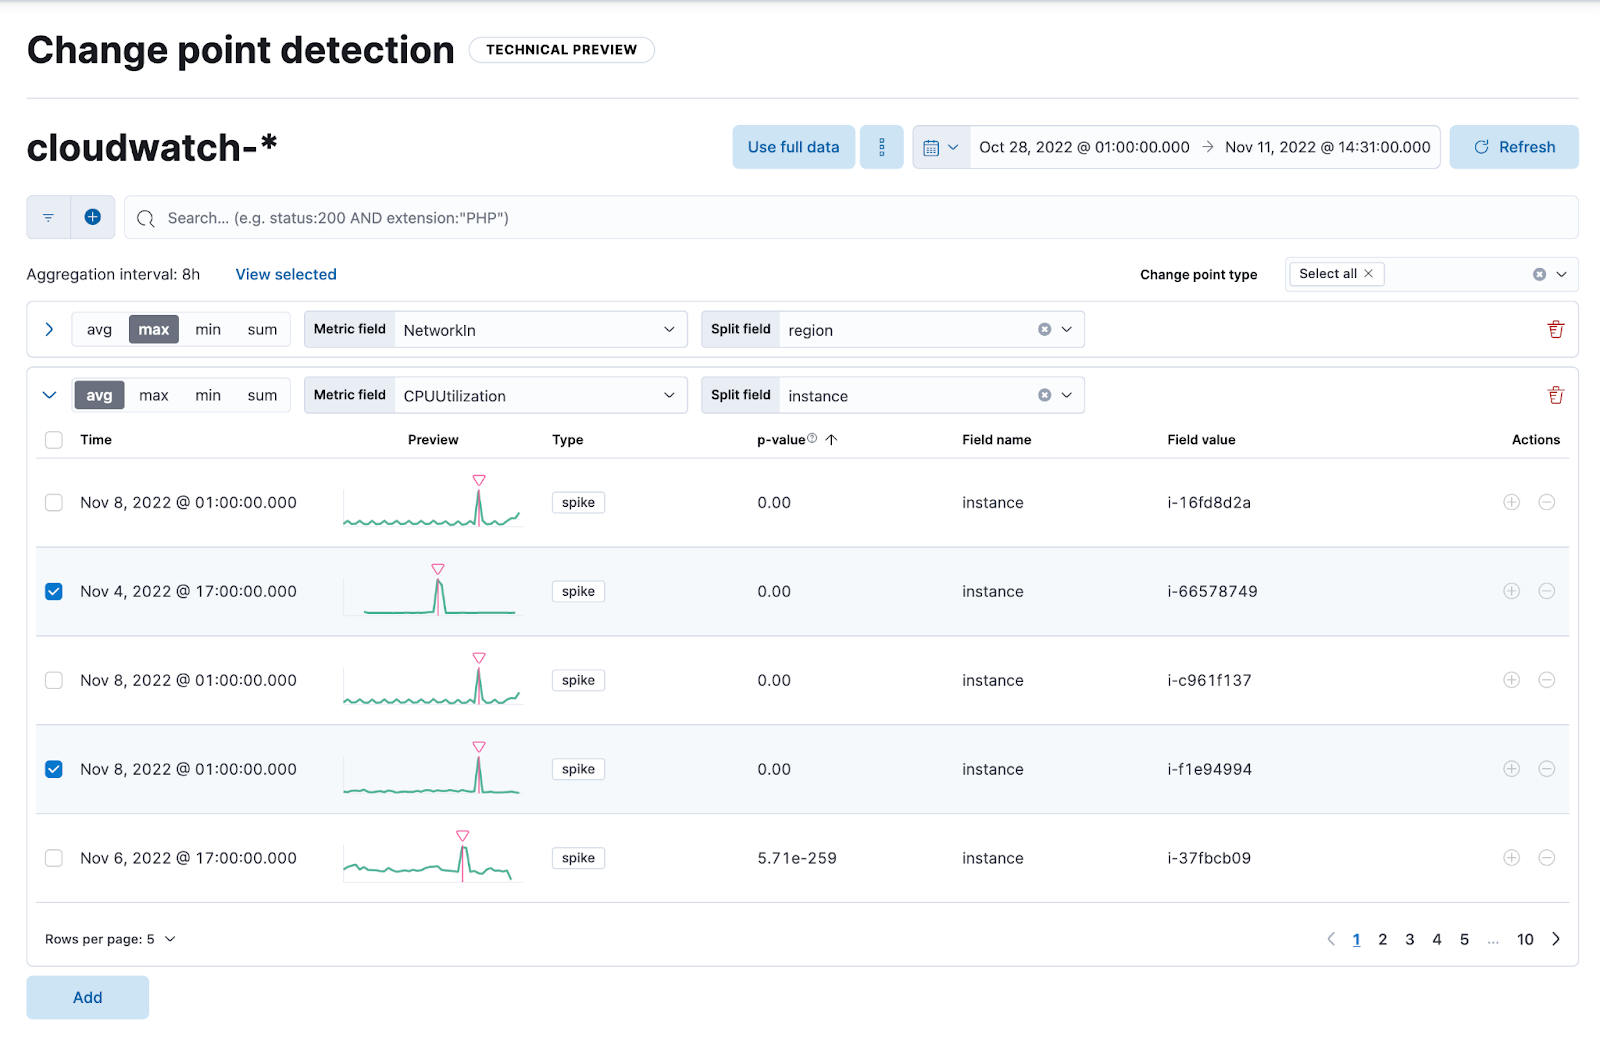
Change point detection—multiple metrics and split fields
editChange point detection was introduced in 8.7 as part of AIOps Labs. In 8.8, it supports multiple change point configurations, which enables you to view data from different metrics and partitions in a table layout with change point previews. It accommodates more results on a single page, provides more sorting possibilities, and makes it possible to zoom in on particular entries. It has updated controls for the metric and split fields, which provides easy access to the top values and distribution of the configuring field. The quick filter action simplifies the investigation of certain partitions or excludes them from the analysis.
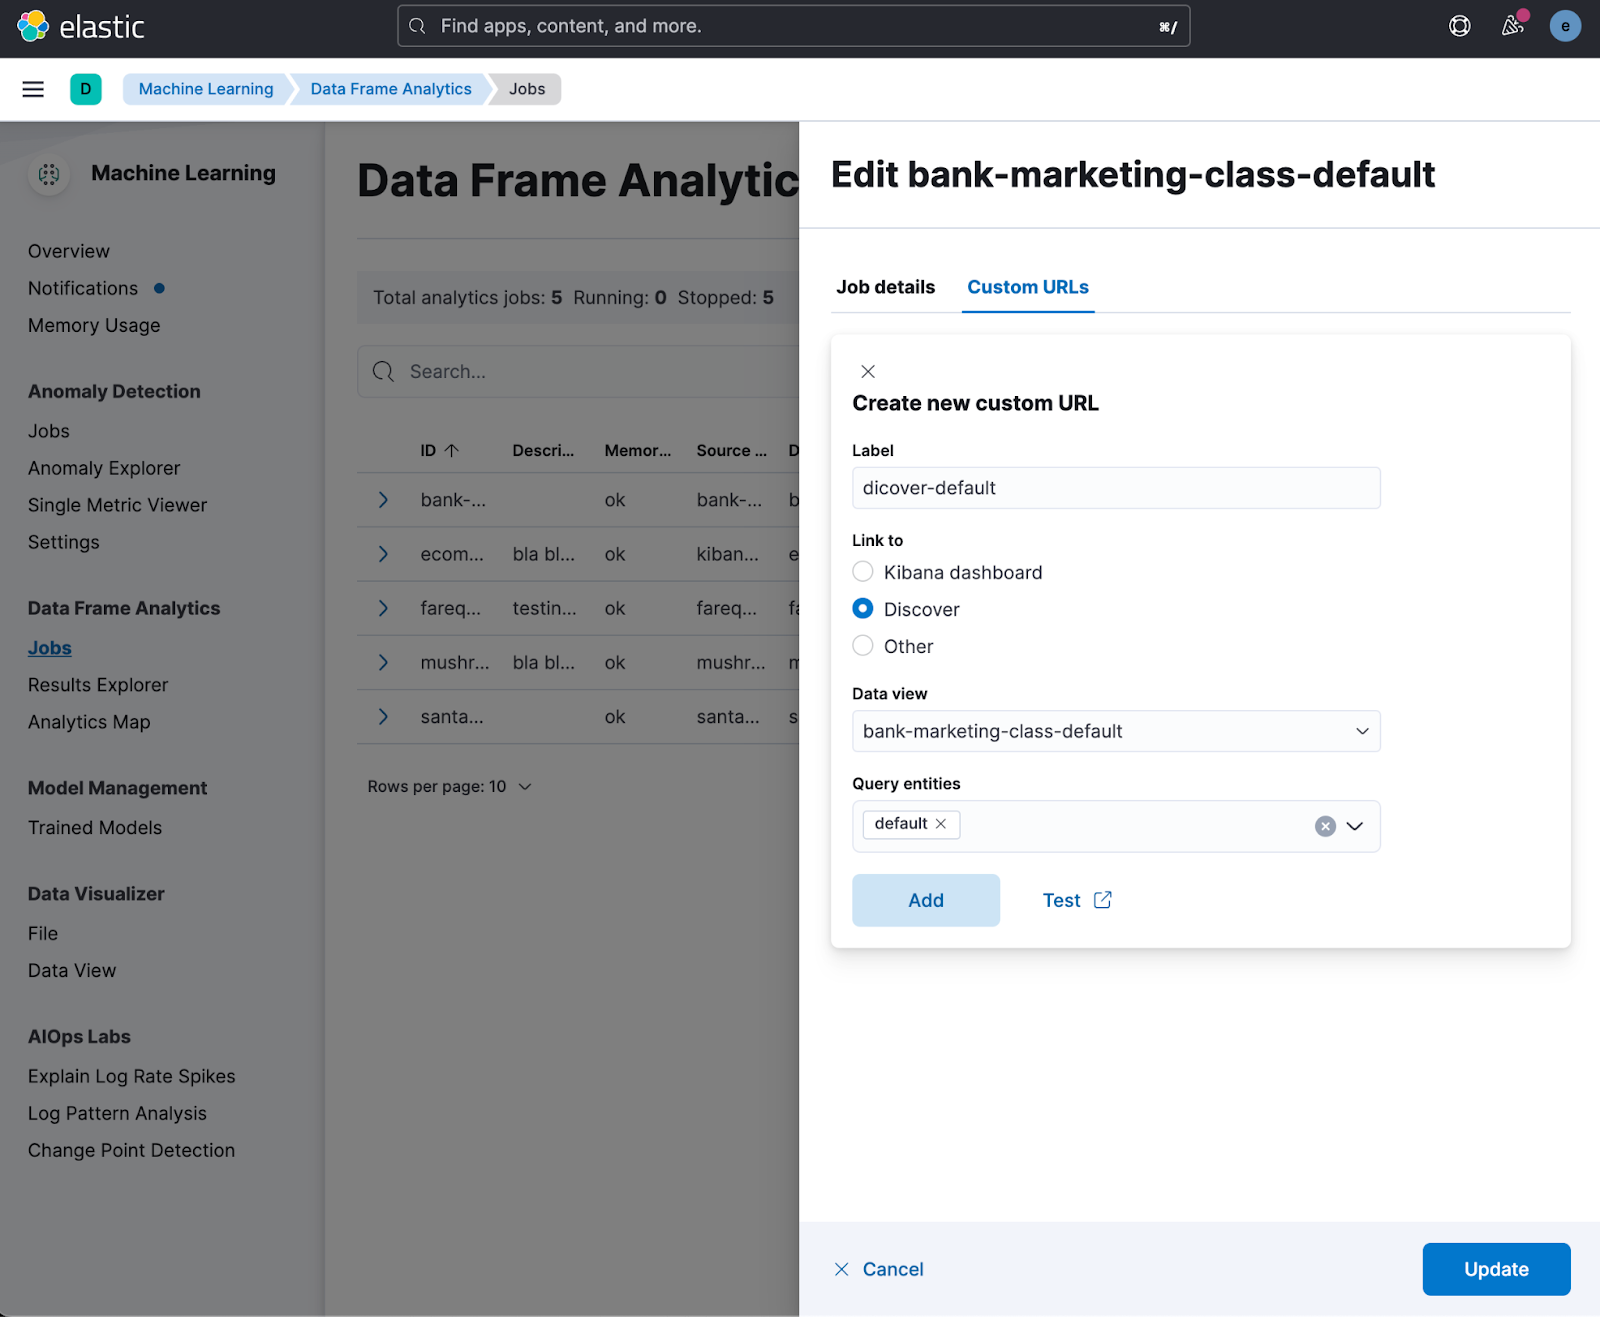
Data frame analytics drilldown actions
editStarting in 8.8, the results data grid provides a link in the Actions column to Discover filtering for the row’s field/values. Creating custom URLs for jobs is also supported from the jobs list. You can create a link to Discover, Dashboard, or an external URL. You can also test the configured custom URL.
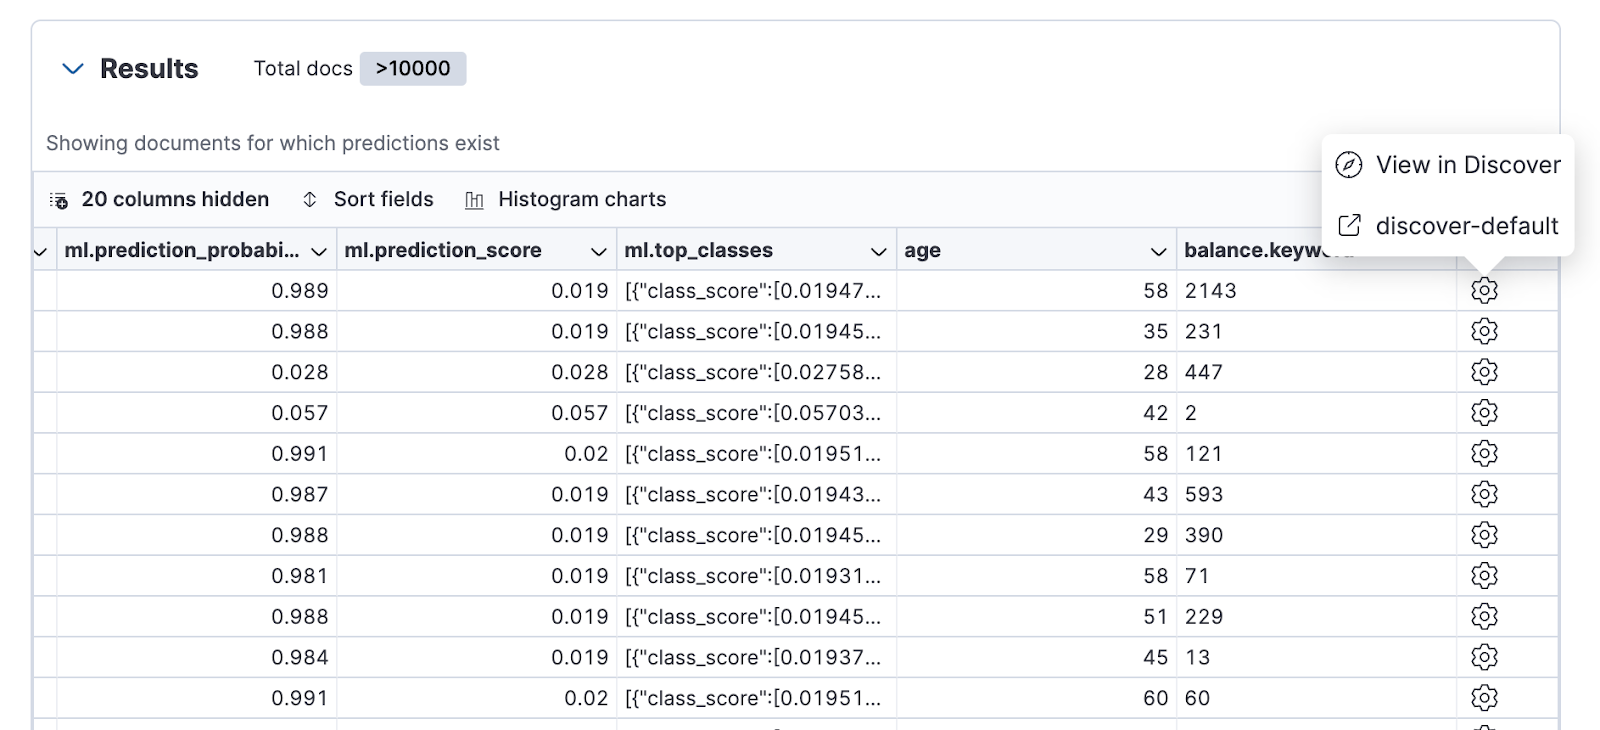
The custom URLs you create appear in the data frame analytics results table row. You can click through to any URL with the values from that row.
Alerting
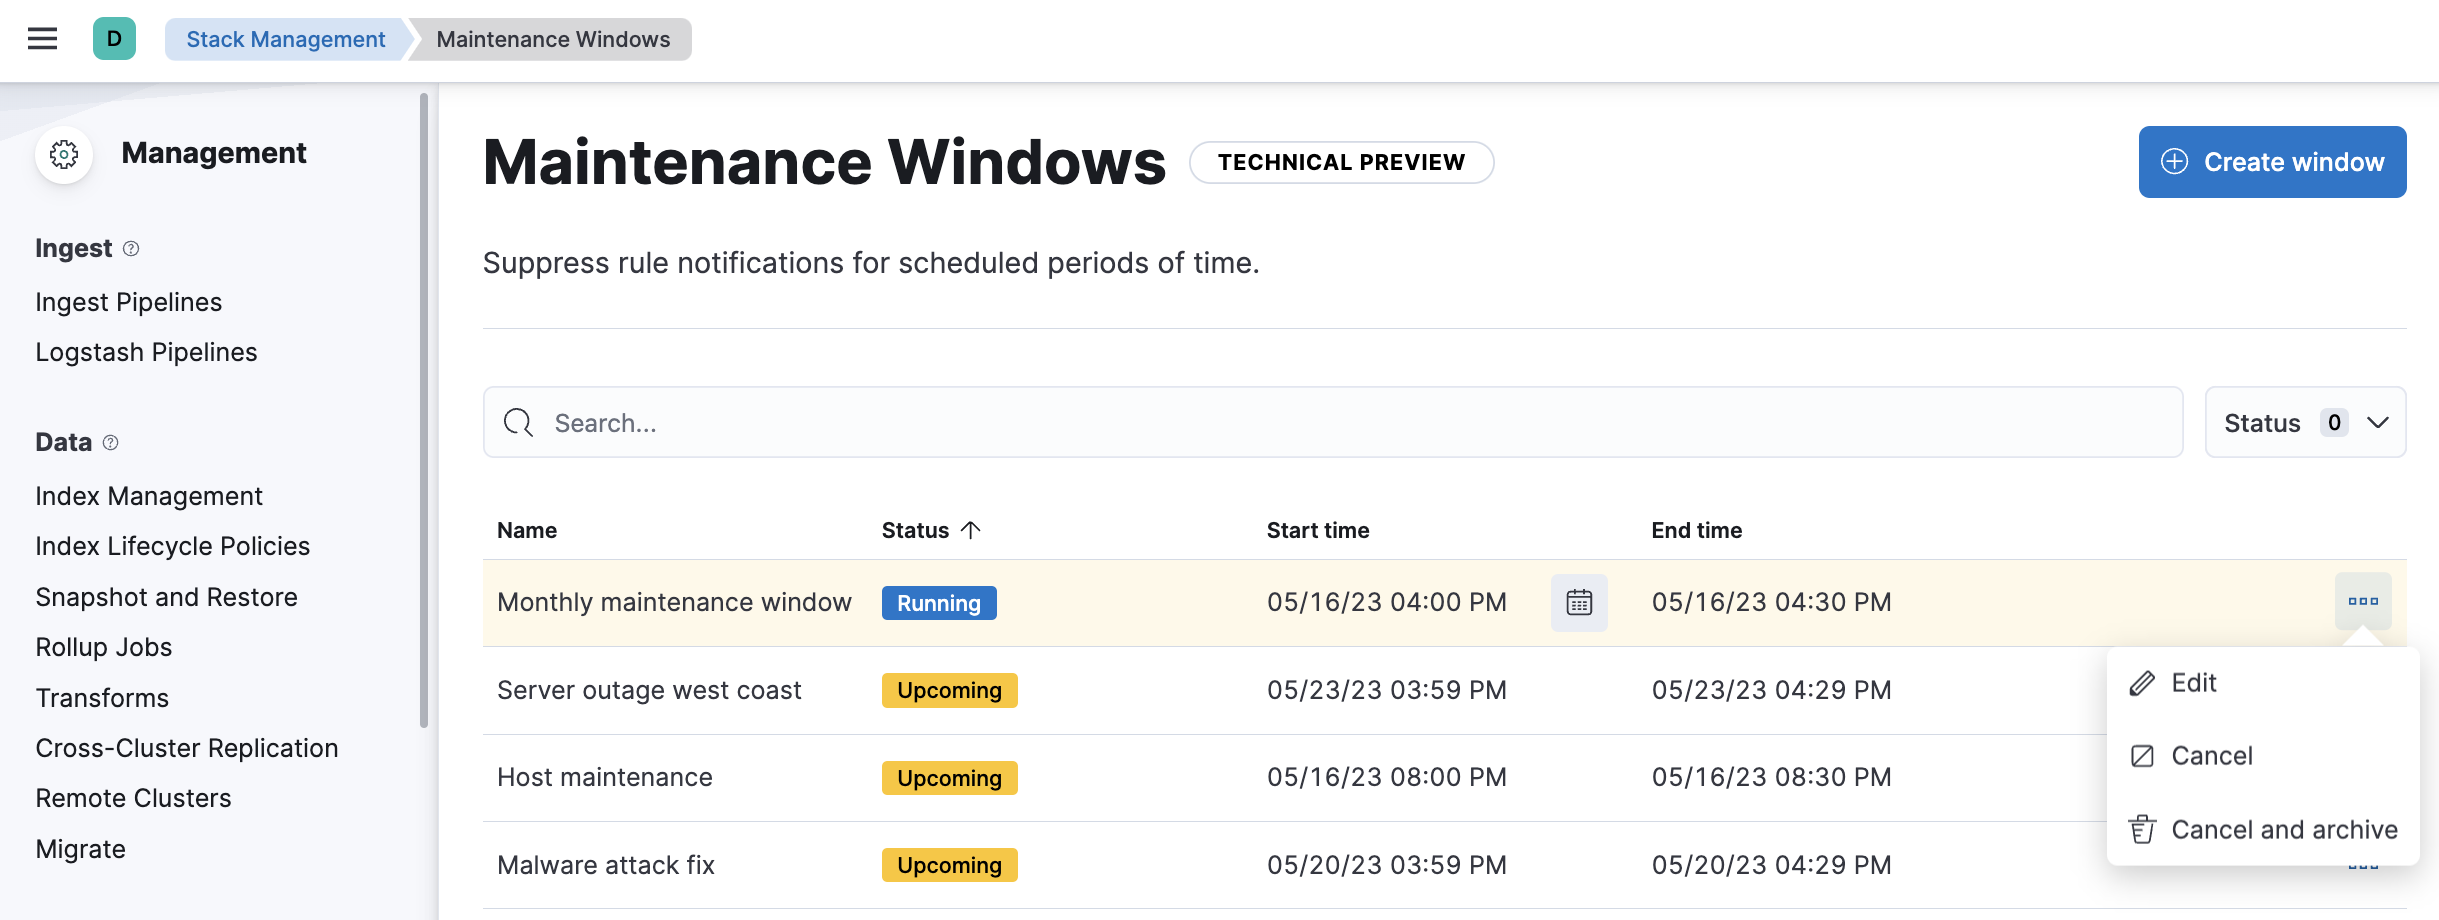
editMaintenance windows
editSchedule single or recurring maintenance windows to reduce alert noise and suppress notifications. For example, if you have a planned outage or event, a maintenance window prevents false alarms during this period.
Cases
editThese features are all available for cases in Stack Management, Observability, and the Elastic Security app.
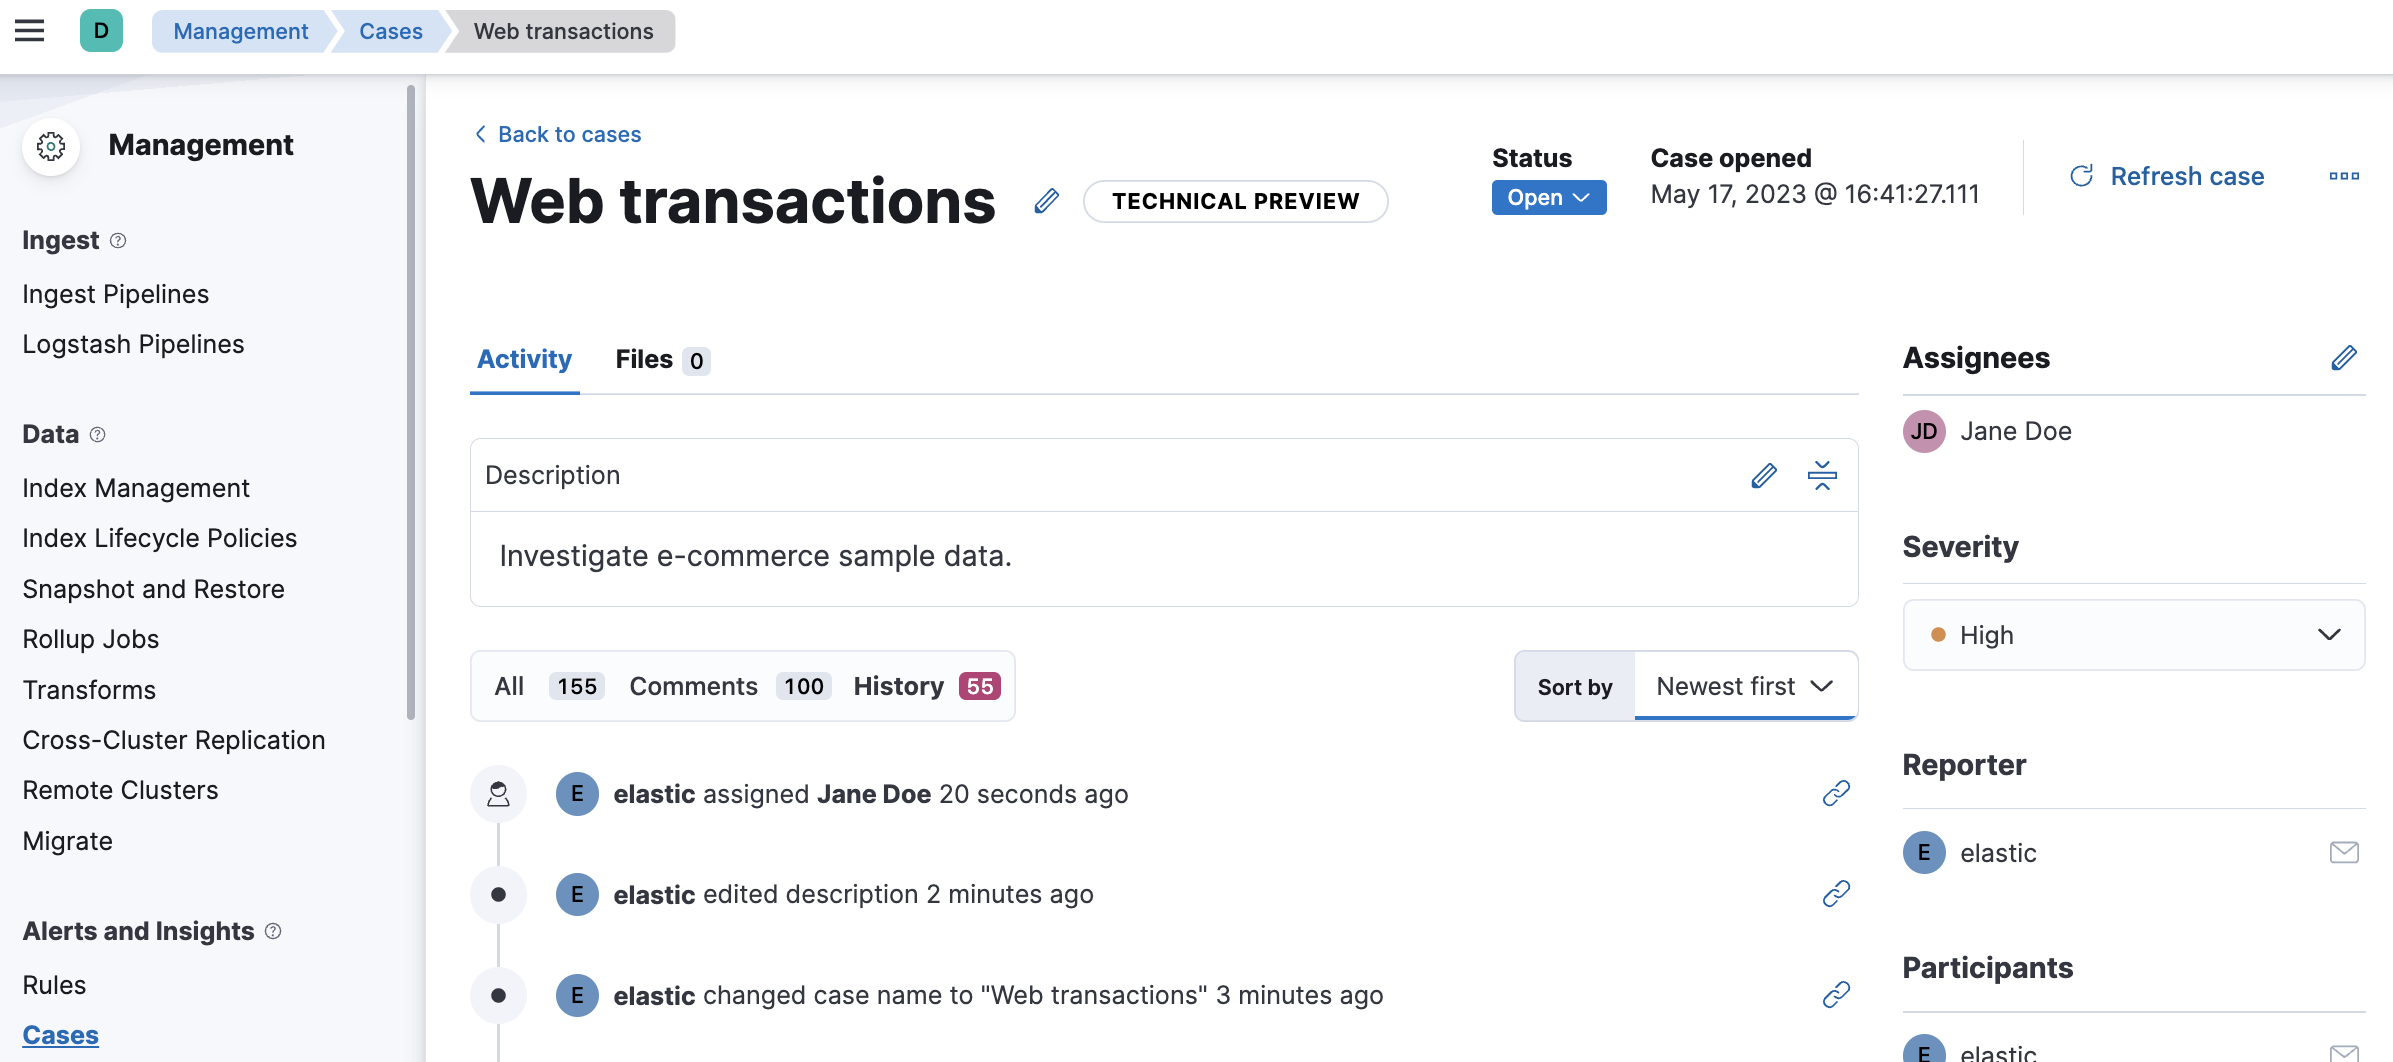
Case activities
editIn 8.8, when you view a case, there are new Comments and History filters on the Activity tab. These filters separate comments from user and system actions, such as alerts and user assignments. Pagination and sorting are now also provided on this tab.
Case attachments
editYou can now attach files to cases for better investigation processes. With the new capability, you can upload indicators of compromise (IOCs) and other files to support alert and case triage. For more information, check Add files.
Per-user dark mode
editContinuing our user-first effort for personalization and collaboration, you can now customize the theme by setting dark mode individually. Choose between dark mode, light mode, or the default theme in the space.
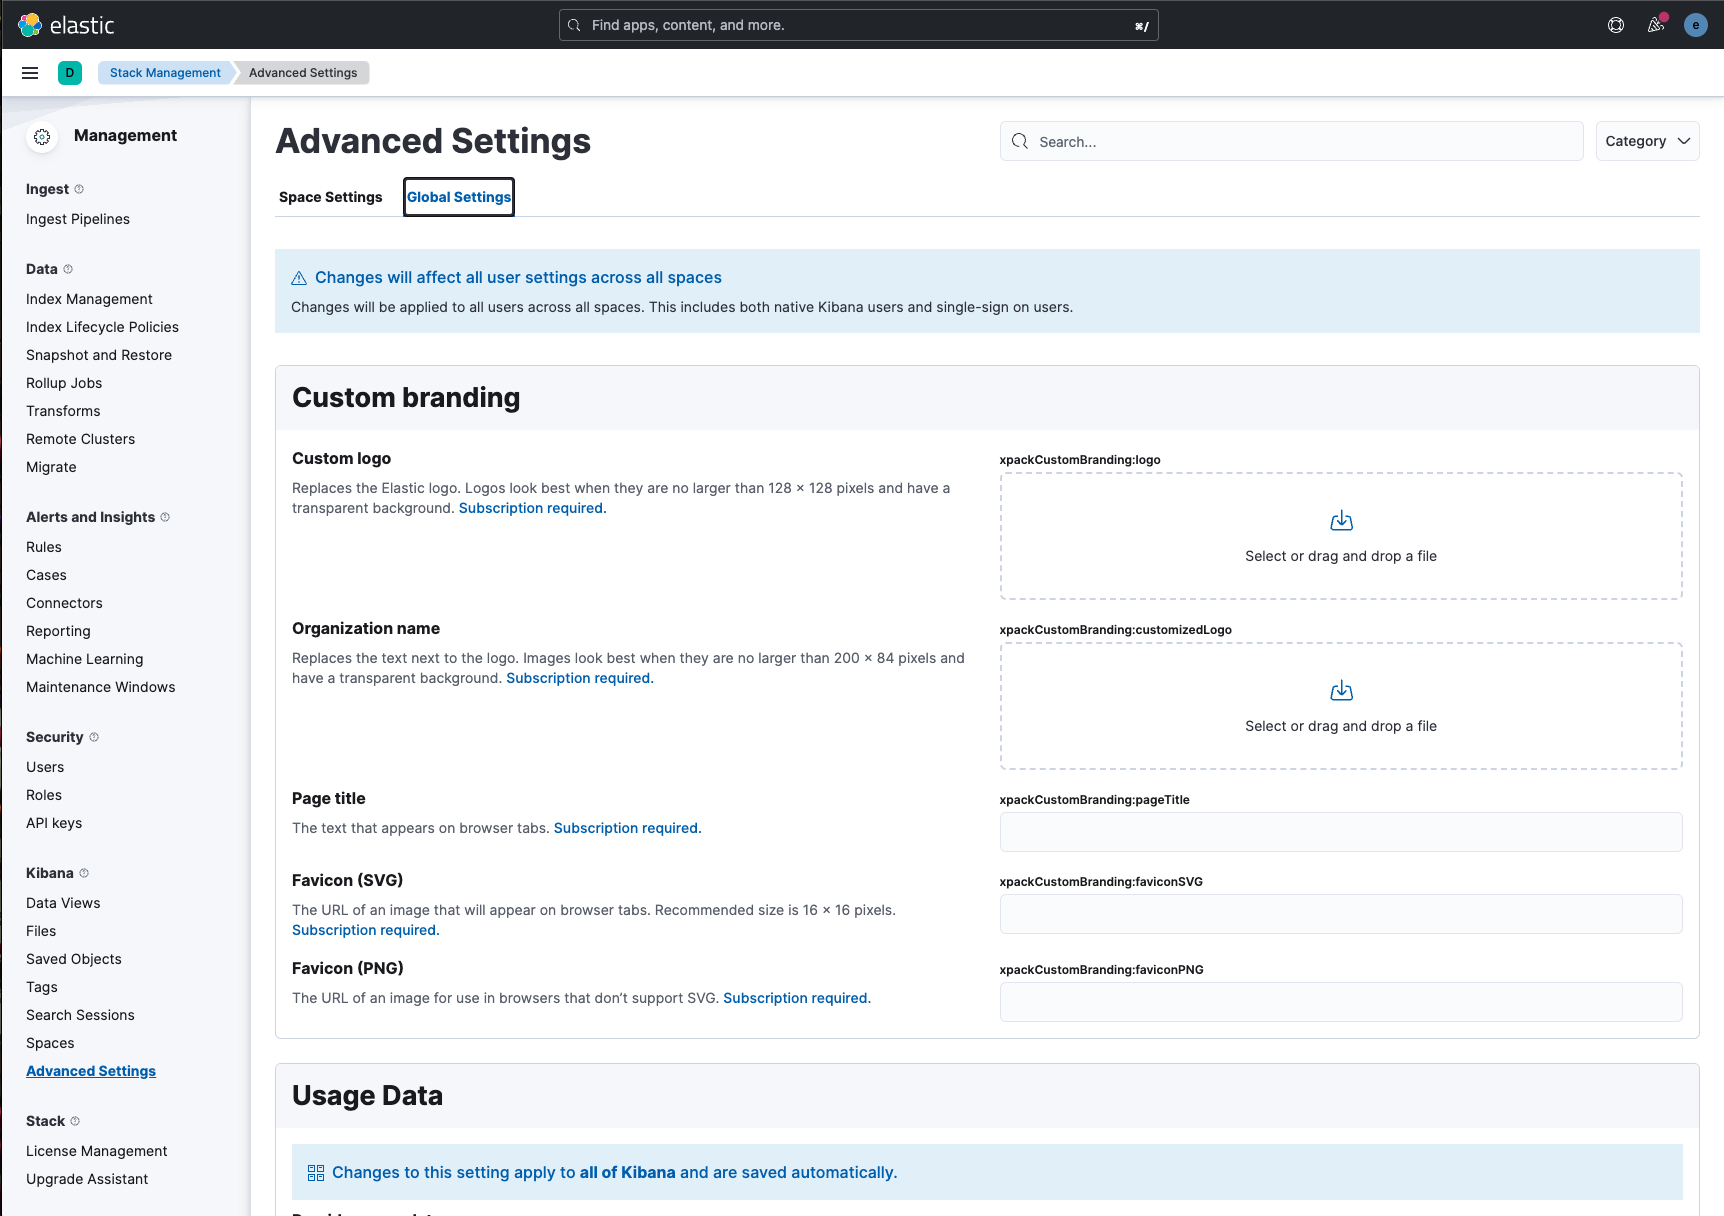
Custom Branding
editA frequently requested feature, Custom Branding enables you to embed Elastic in a corporate portal environment with your own branding.
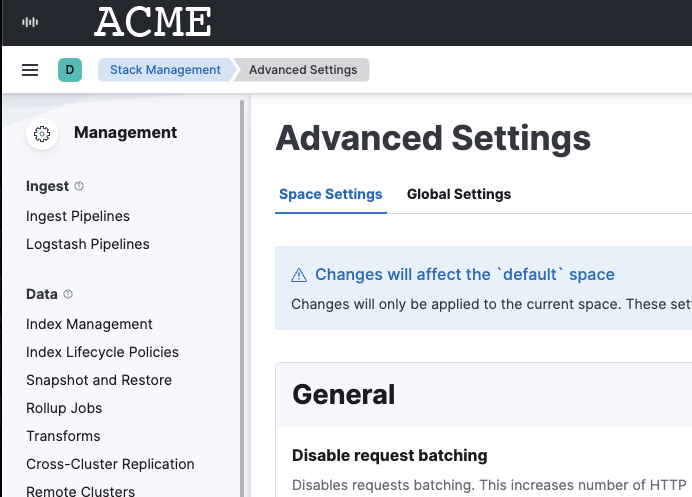
You can customize your logo, organization name, page title, and browser icon. Open Stack Management, select Advanced Settings, and then select the Global Settings tab.
To create a custom brand, you must have Kibana admin access. Custom branding is a subscription feature and and applies to all spaces.