What’s new in 8.7
editWhat’s new in 8.7
editHere are the highlights of what’s new and improved in 8.7. For detailed information about this release, check the release notes.
Previous versions: 8.6 | 8.5 | 8.4 | 8.3 | 8.2 | 8.1 | 8.0
Discover: Break down the histogram by value
editIn Discover, you can now resize the histogram and break down fields by value, which is often used for logs exploration. The updated histogram is especially useful for Observability use cases. For more information, check Discover.
Lens: Convert your visualizations
editConvert your TSVB and aggregation-based visualizations to the drag-and-drop Lens visualization editor, directly from your dashboards. In Edit mode, the TSVB and aggregation-based dashboard panels that display a dot support the Convert to Lens functionality. For more information, check Open and edit TSVB visualizations in Lens and Open and edit aggregation-based visualizations in Lens.
Dashboard
editTime slider updates
editSelecting just the right time range is now even easier with the improvements to the time slider control. Pin the start time to the beginning of your time range to show how data builds over a period of time. For more information, check Filter dashboard data with controls.
Complex filters
edit[preview] This functionality is in technical preview and may be changed or removed in a future release. Elastic will work to fix any issues, but features in technical preview are not subject to the support SLA of official GA features. Create and apply multiple filters simultaneously for nested queries, and use the logical OR and AND operators using the improved dropdown menu experience. For more information, check Additional filters with AND.
Interactive chart filters
editFiltering your data just got easier with interactive chart filters. When you right-click your chart data, you can select one or more filter values from the menu that appears, and link the filters with the OR operator.
Maps
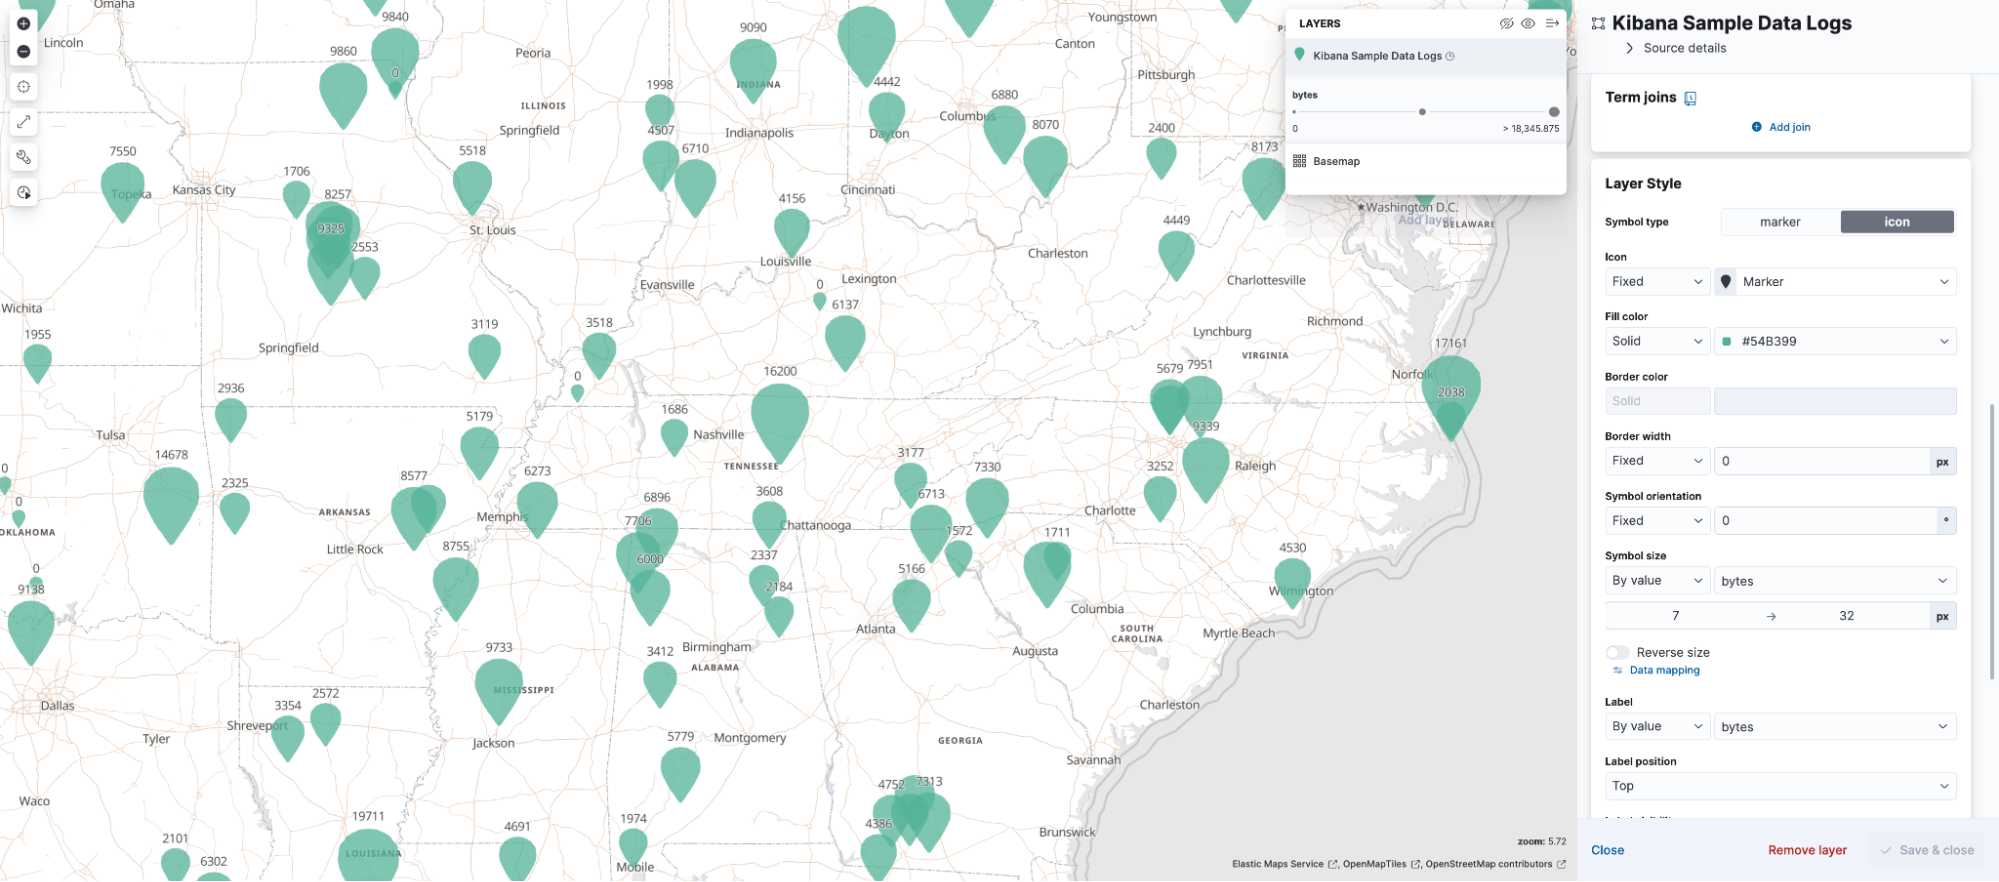
editLabel positioning
editUse the new Label position style setting to position labels above, below, or in the center of markers and icons.
Hexagon clustering
editHexagon clustering was added to Kibana 8.2, but only for geo_point fields. This release extends support for hexagon clustering to include geo_shape fields.
Controls time slider
editThe Maps time slider now uses the controls time slider, which includes enhancements such as pinning the start time. Refer to Controls for details.
Machine Learning
editNatural language processing (NLP)
editIn 8.7, the NLP capabilities of the Elastic product became generally available. Deploy and manage your trained NLP models to perform tasks, such as text classification (including zero-shot), question answering, named entity recognition, and more. Refer to Natural language processing for details.
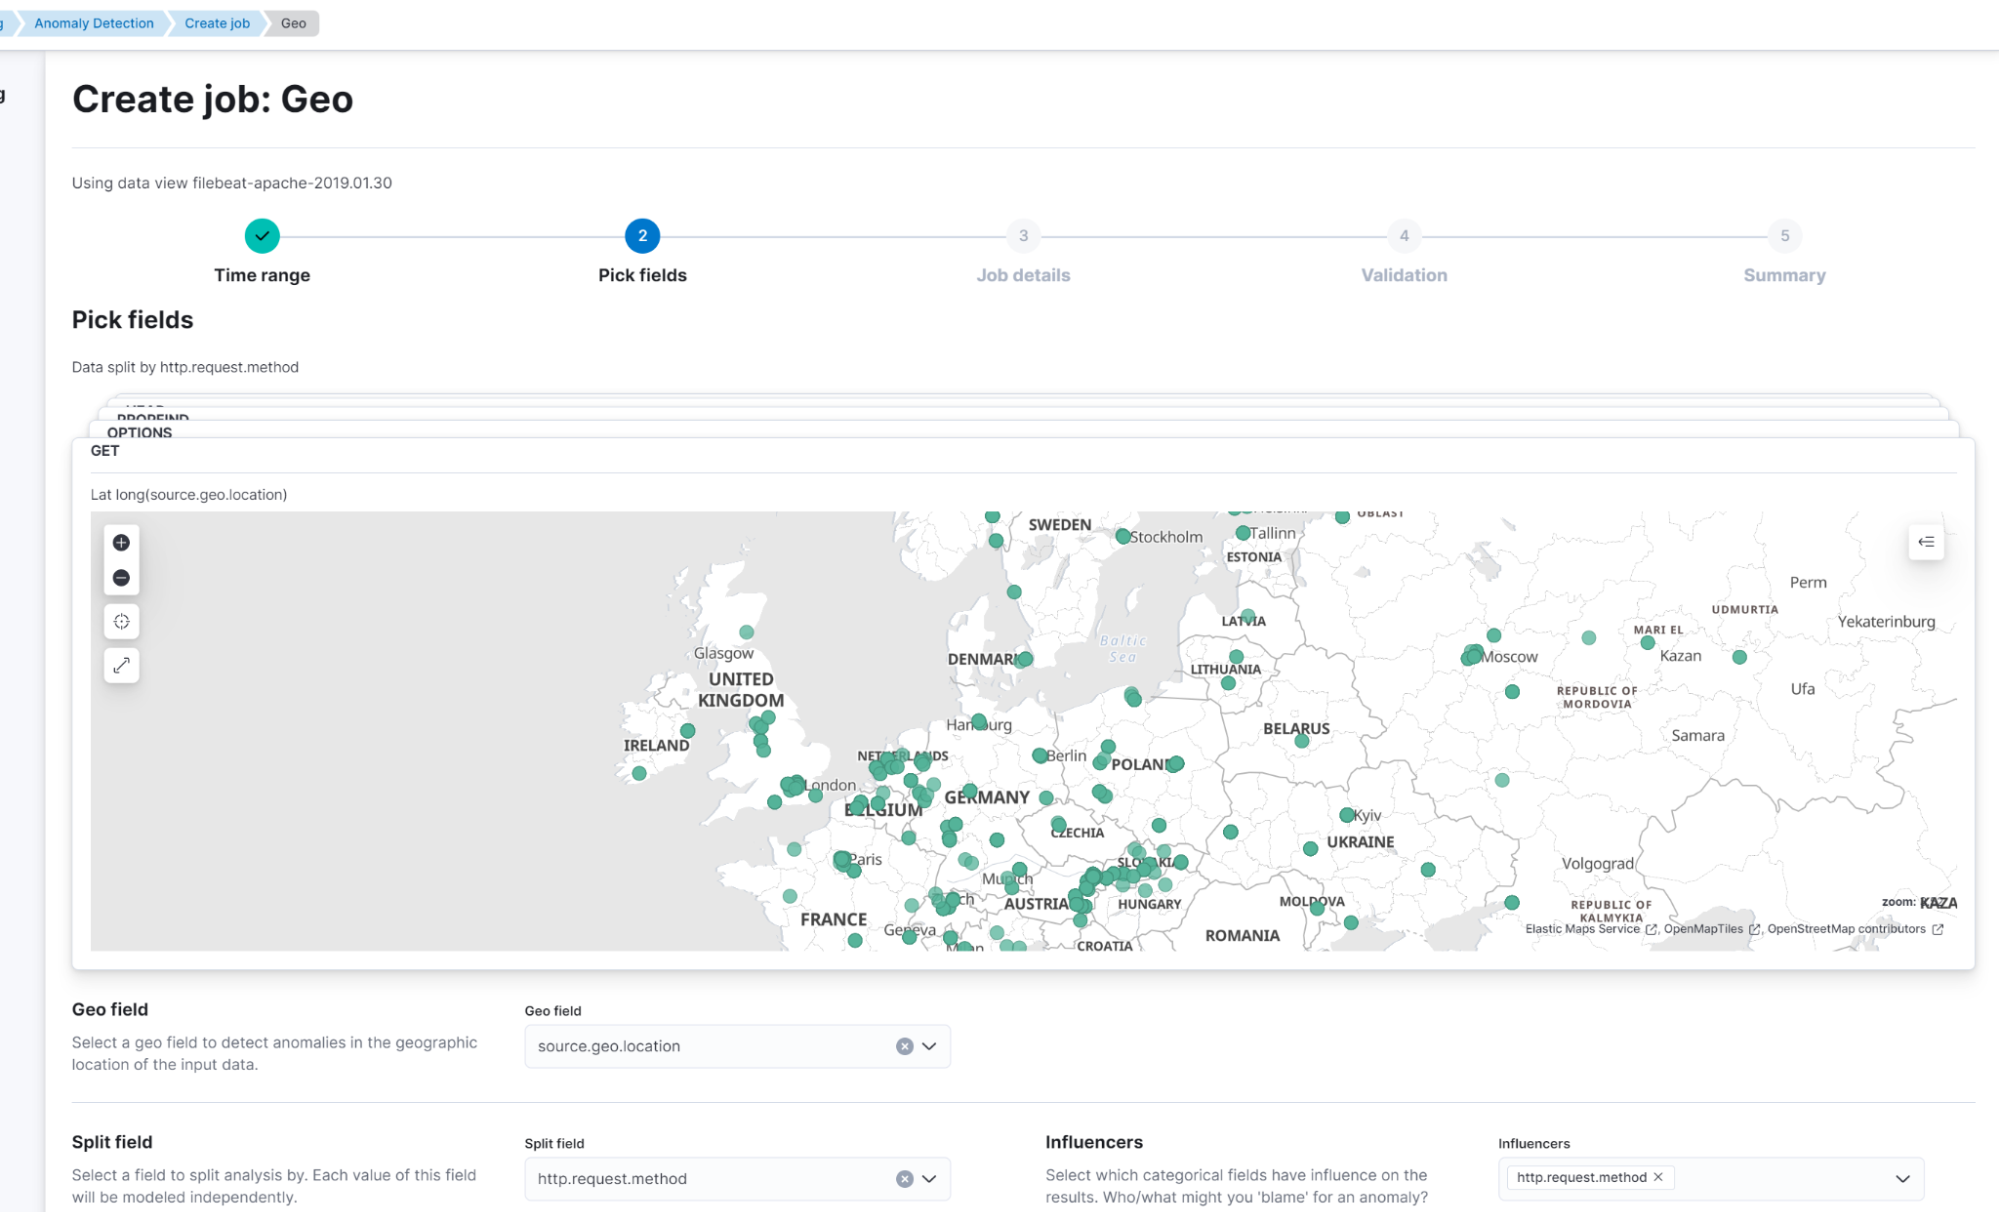
Anomaly detection jobs on geo data
editA new geo wizard is available for creating lat_long anomaly detection jobs. This makes it easier to create jobs to detect anomalies in the geographic location of your input data.
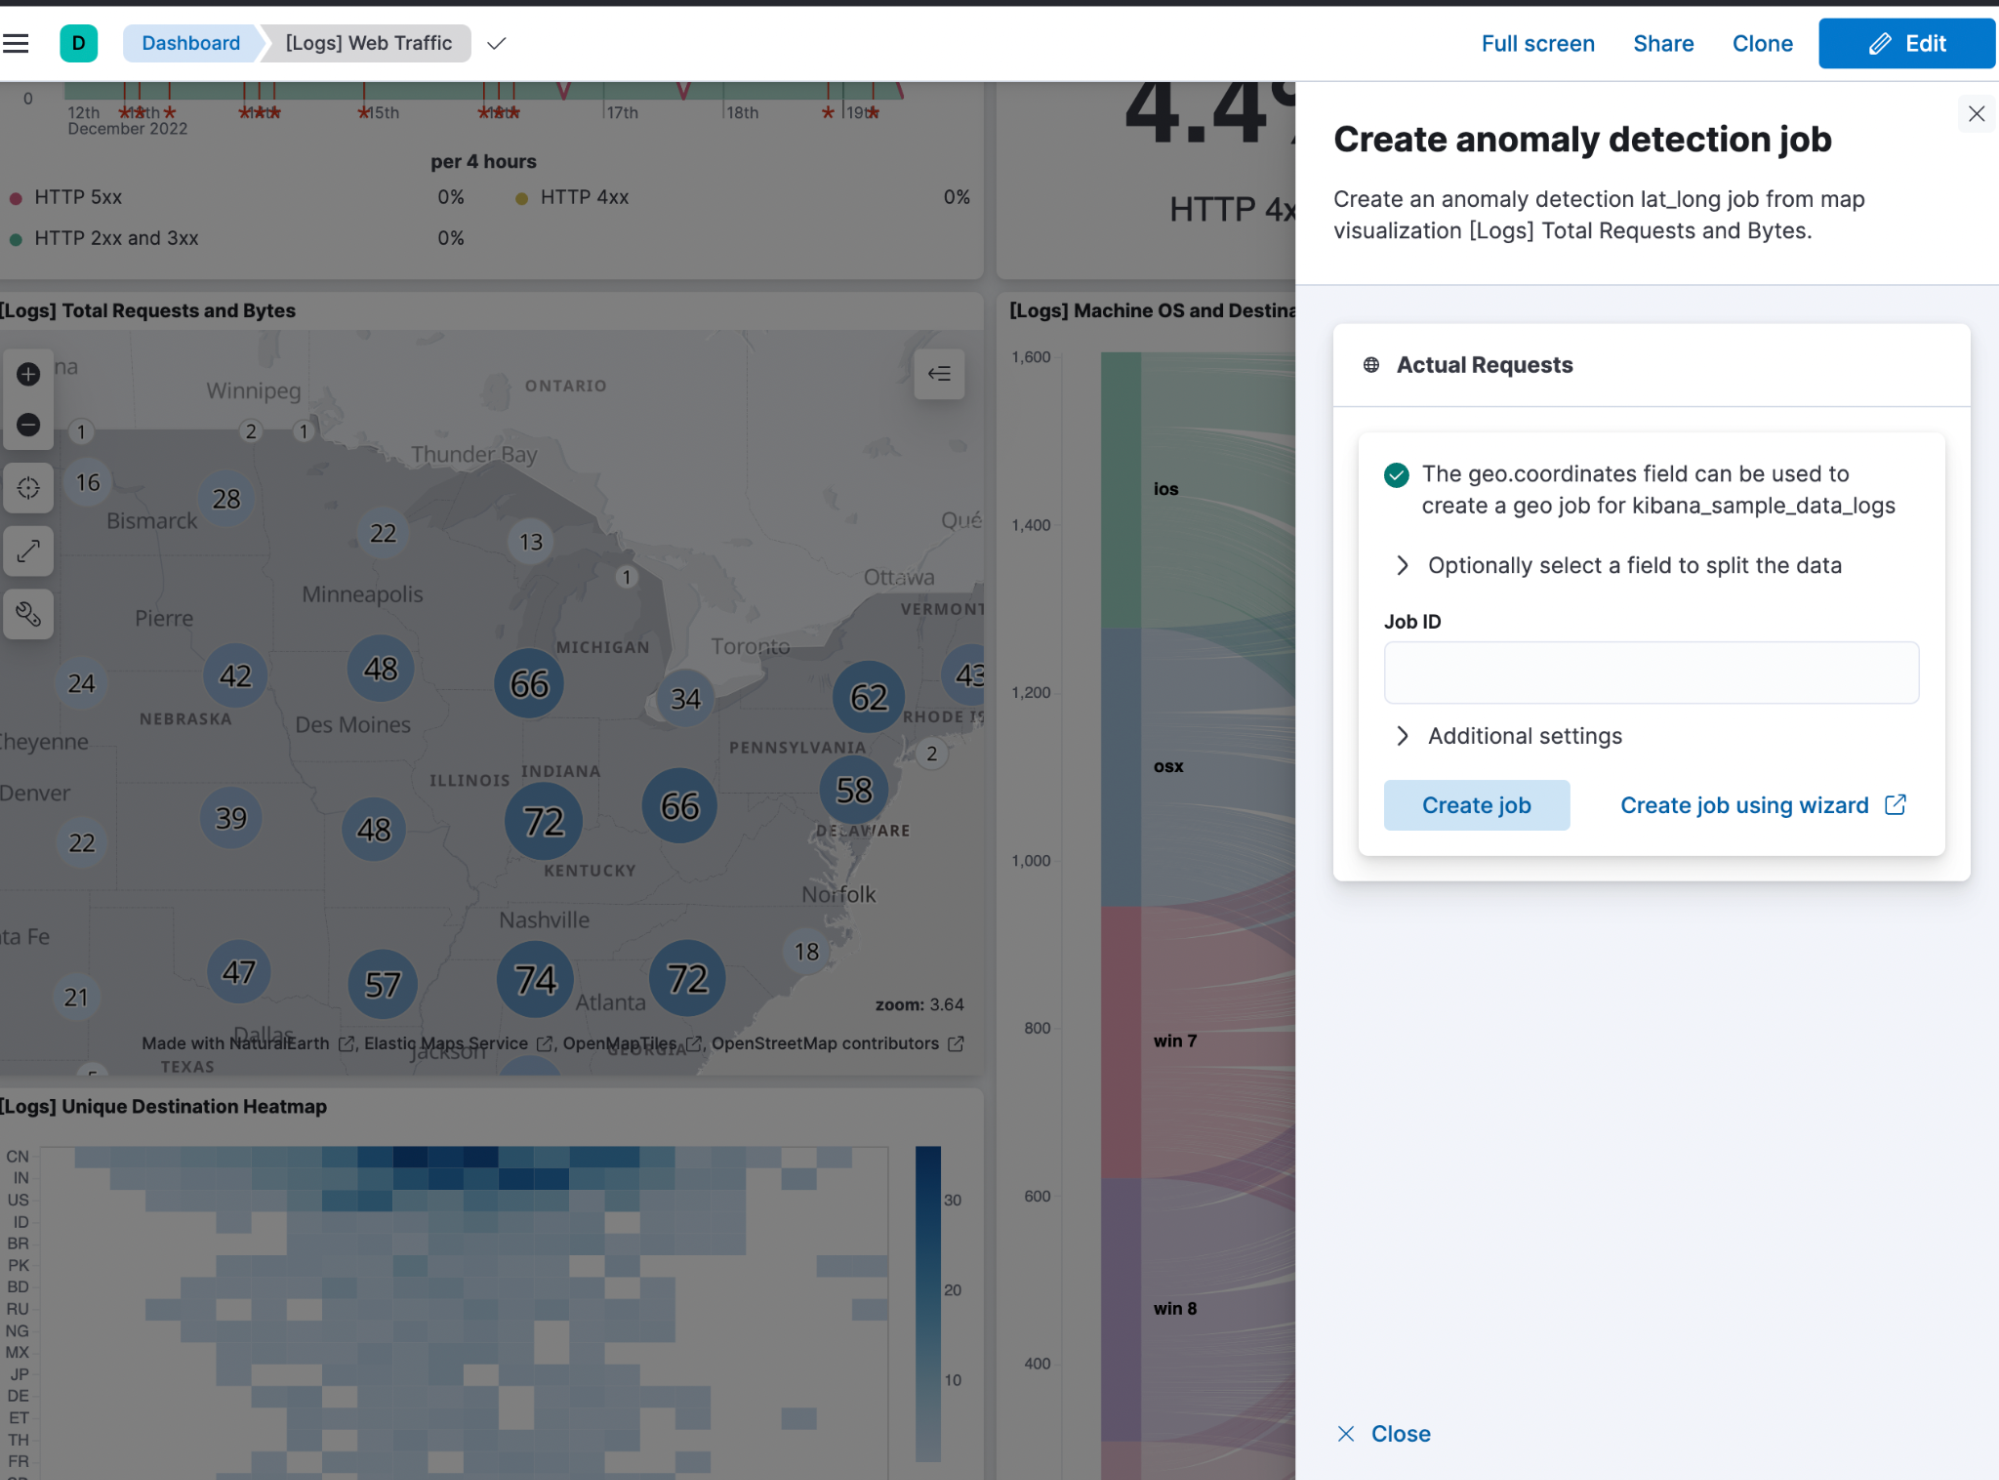
A new action enables you to quickly create anomaly detection jobs from map visualizations. You can create the jobs directly from a flyout in Dashboard. For a more advanced configuration, follow the link that takes you to the ML job wizard.
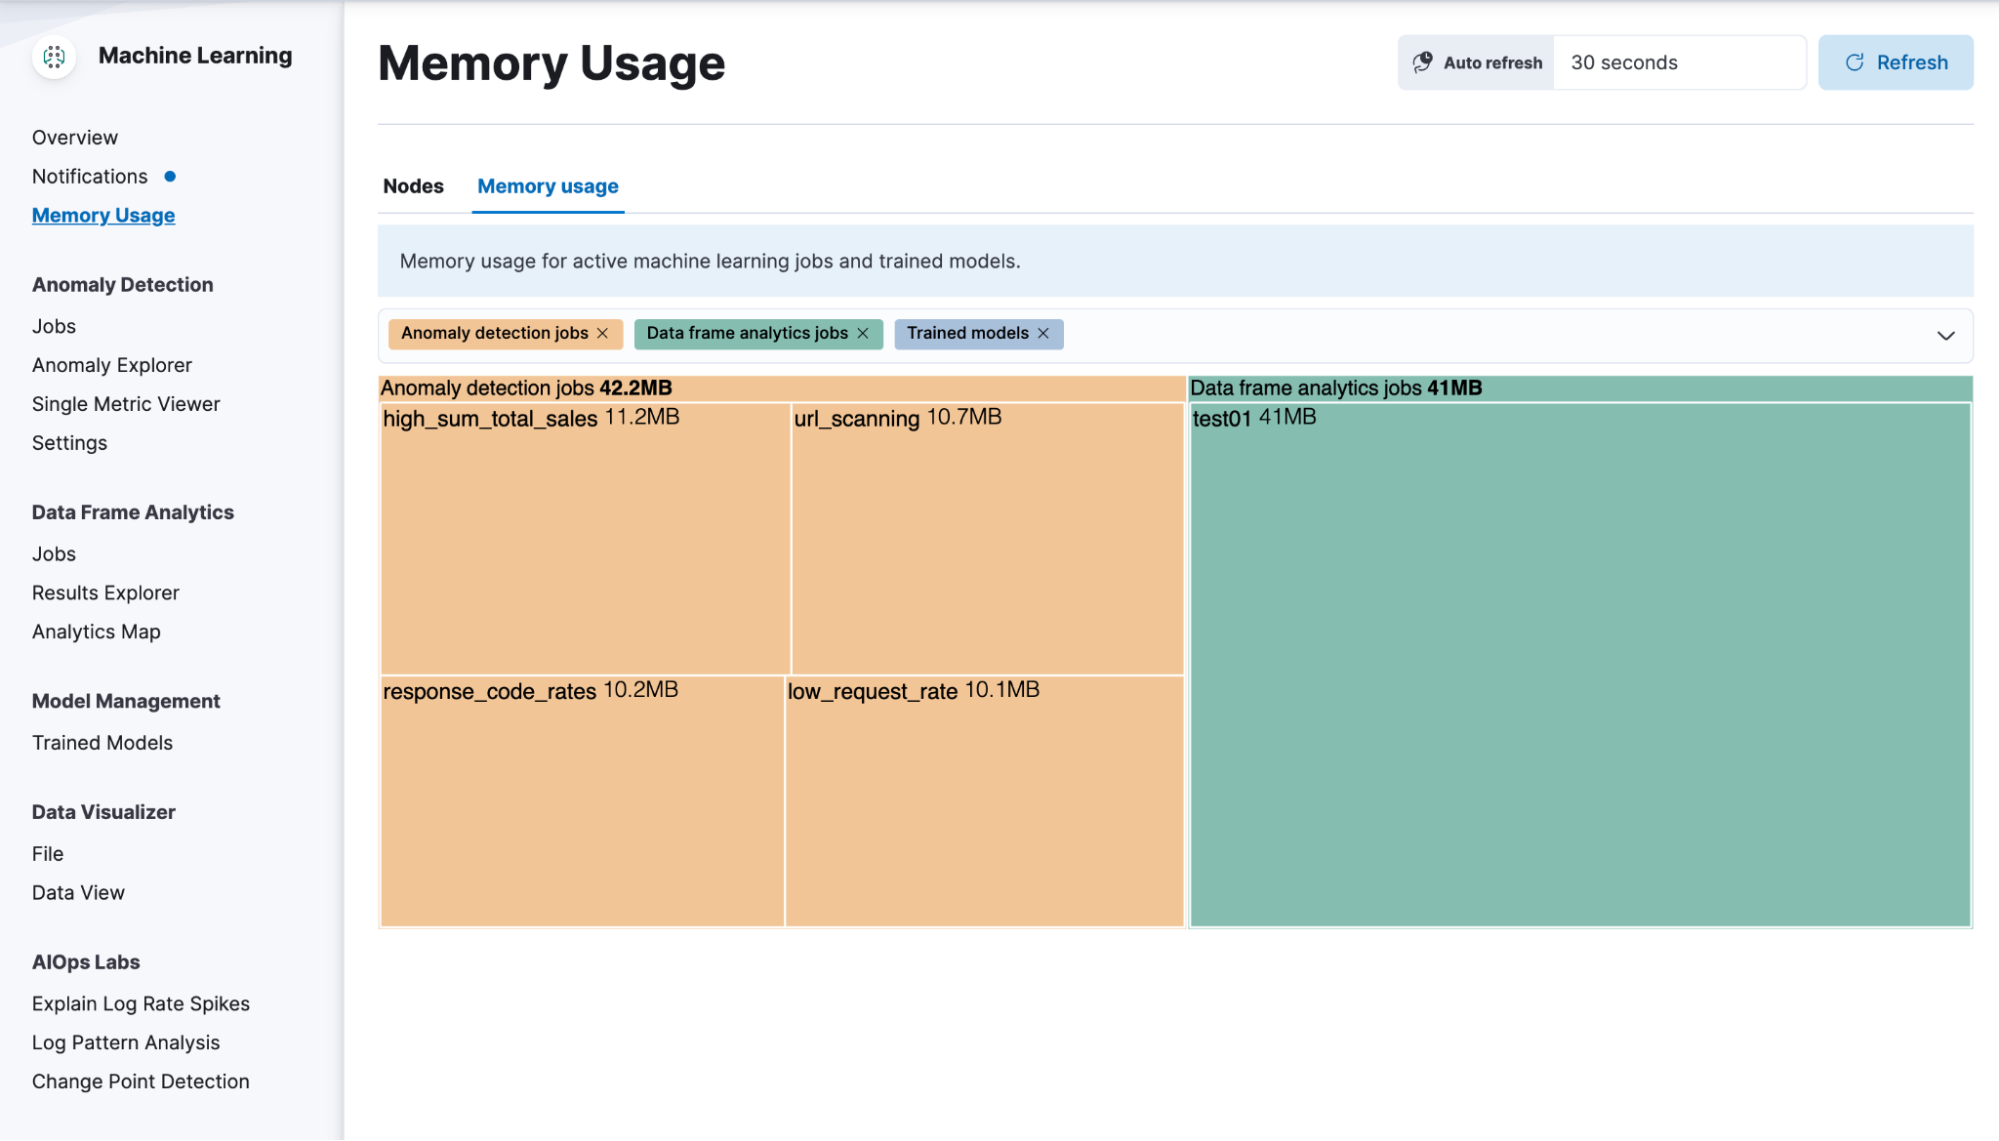
Memory usage by machine learning jobs
editBeginning in 8.7, you can view the memory usage of the open anomaly detection jobs and the started data frame analytics jobs in the Memory Usage view. This new view displays the total and available memory of your ML nodes, the memory usage of the deployed trained models, and active machine learning jobs.
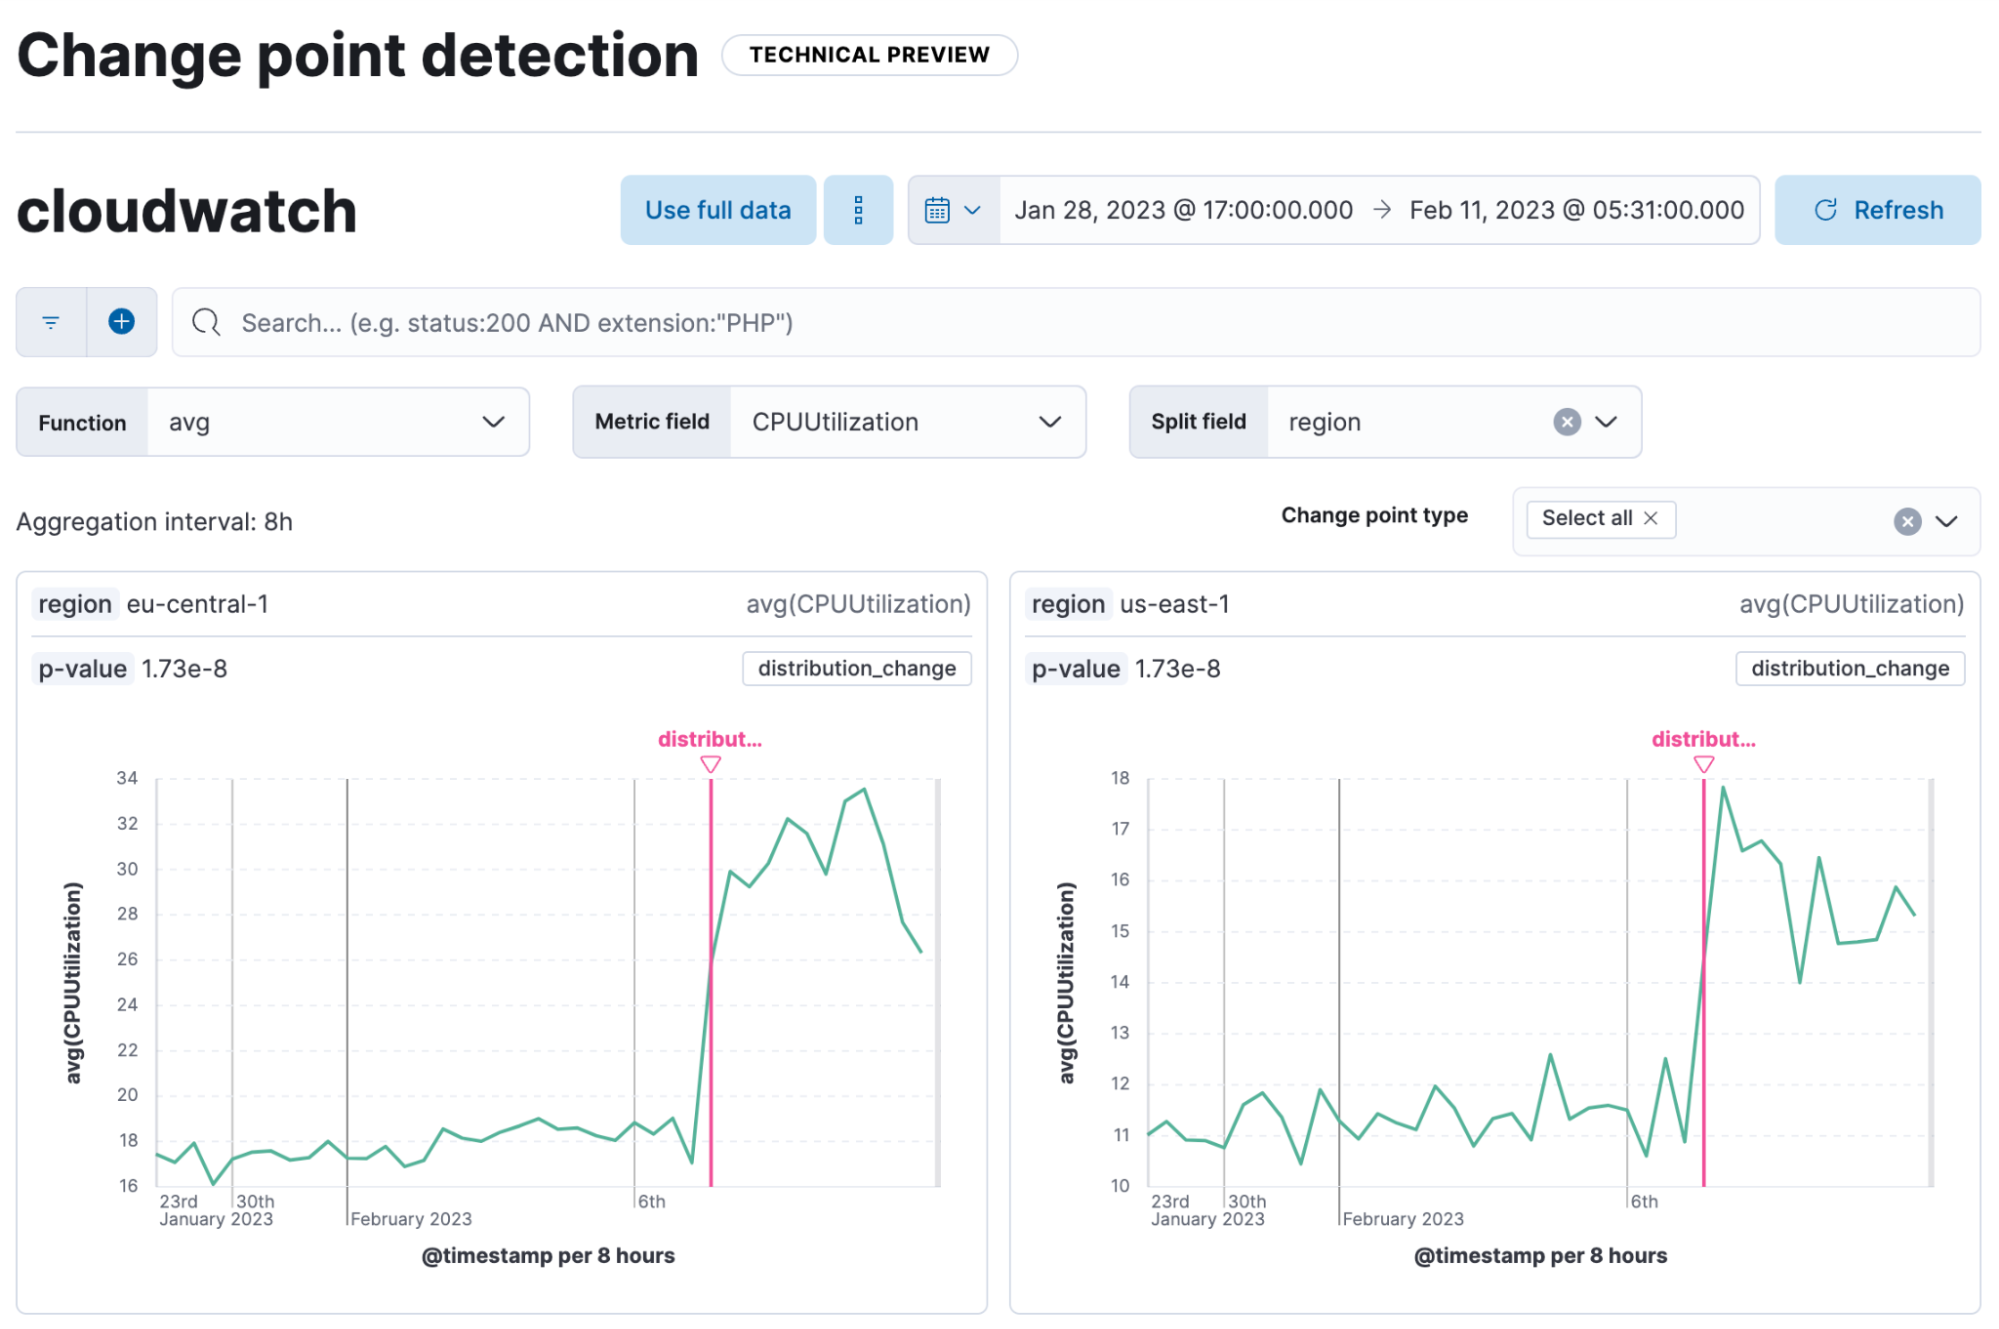
Change point detection in AIOps Labs
edit[preview] This functionality is in technical preview and may be changed or removed in a future release. Elastic will work to fix any issues, but features in technical preview are not subject to the support SLA of official GA features. Change point detection identifies distribution changes, dips, spikes, and other statistically significant change points in a metric. The Change point detection UI visualizes the change points in a bucket identified by the change point aggregation.
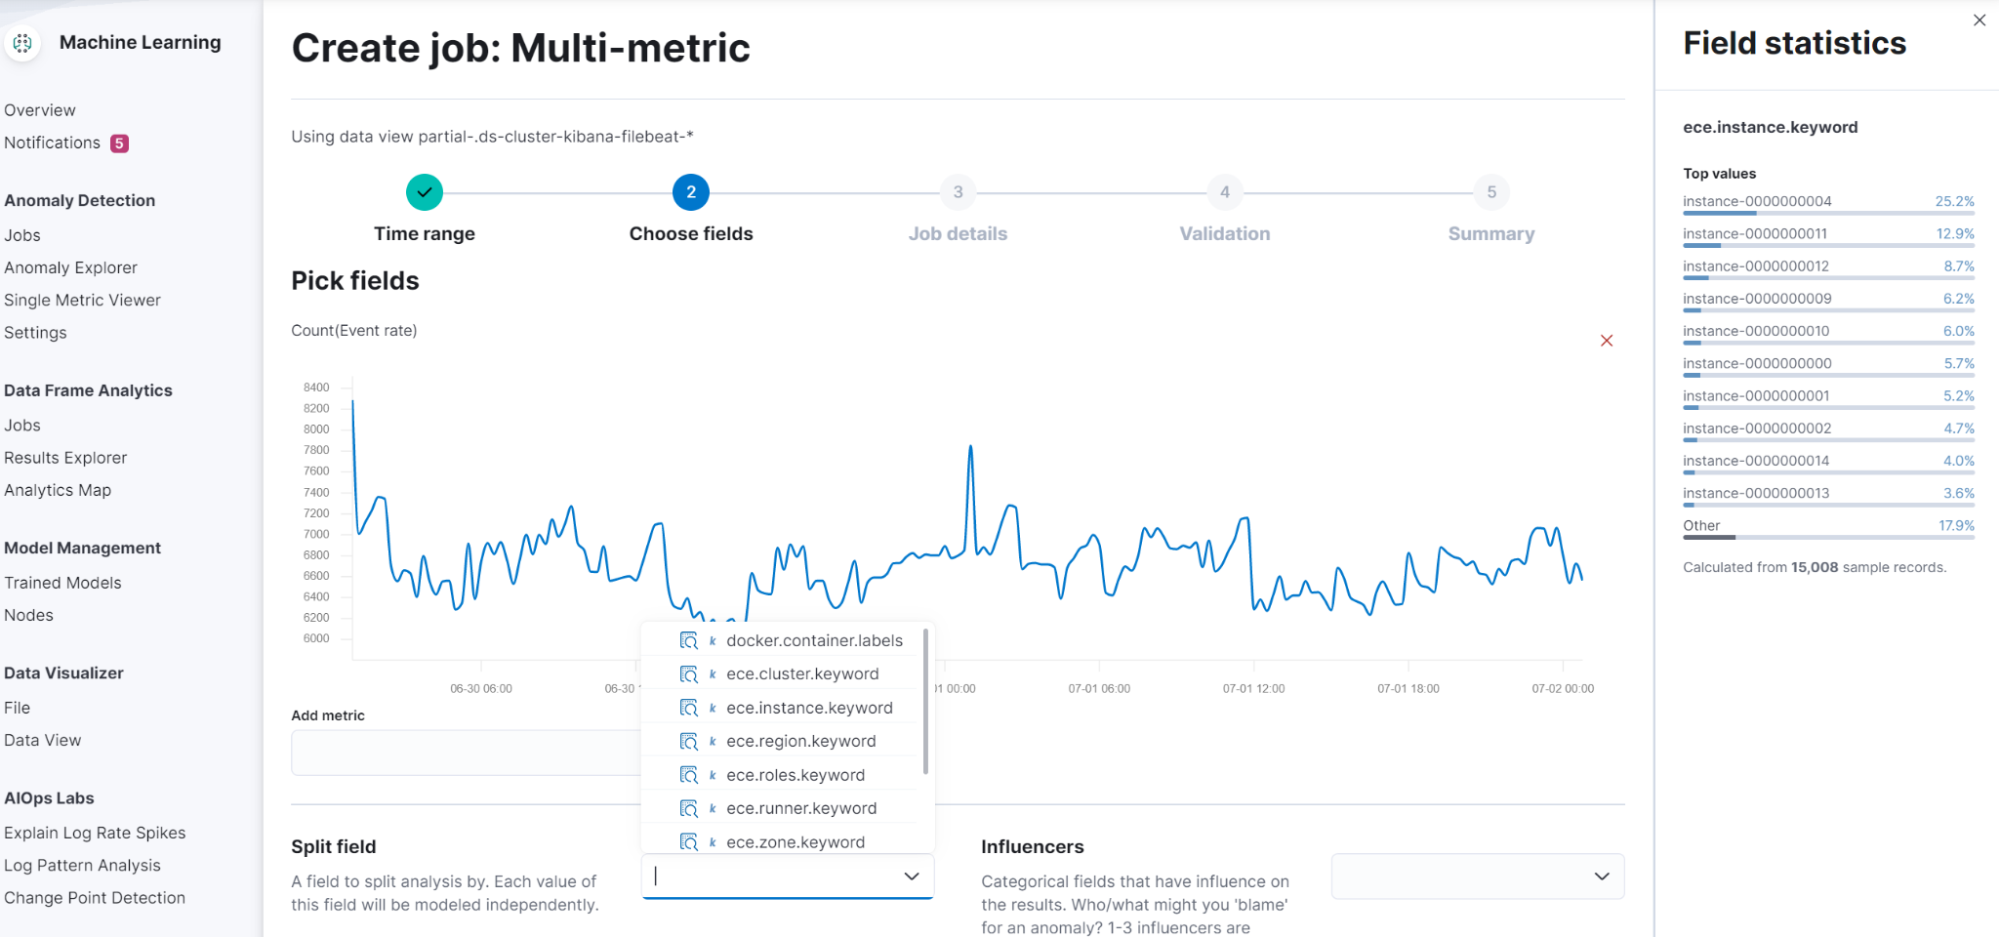
Field statistics in machine learning job and transform wizards
editYou are now able to view the statistics of the selectable fields in the anomaly detection, the data frame analytics, and the transforms wizards. The field statistics provide more meaningful context to help you select relevant fields.
Alerting
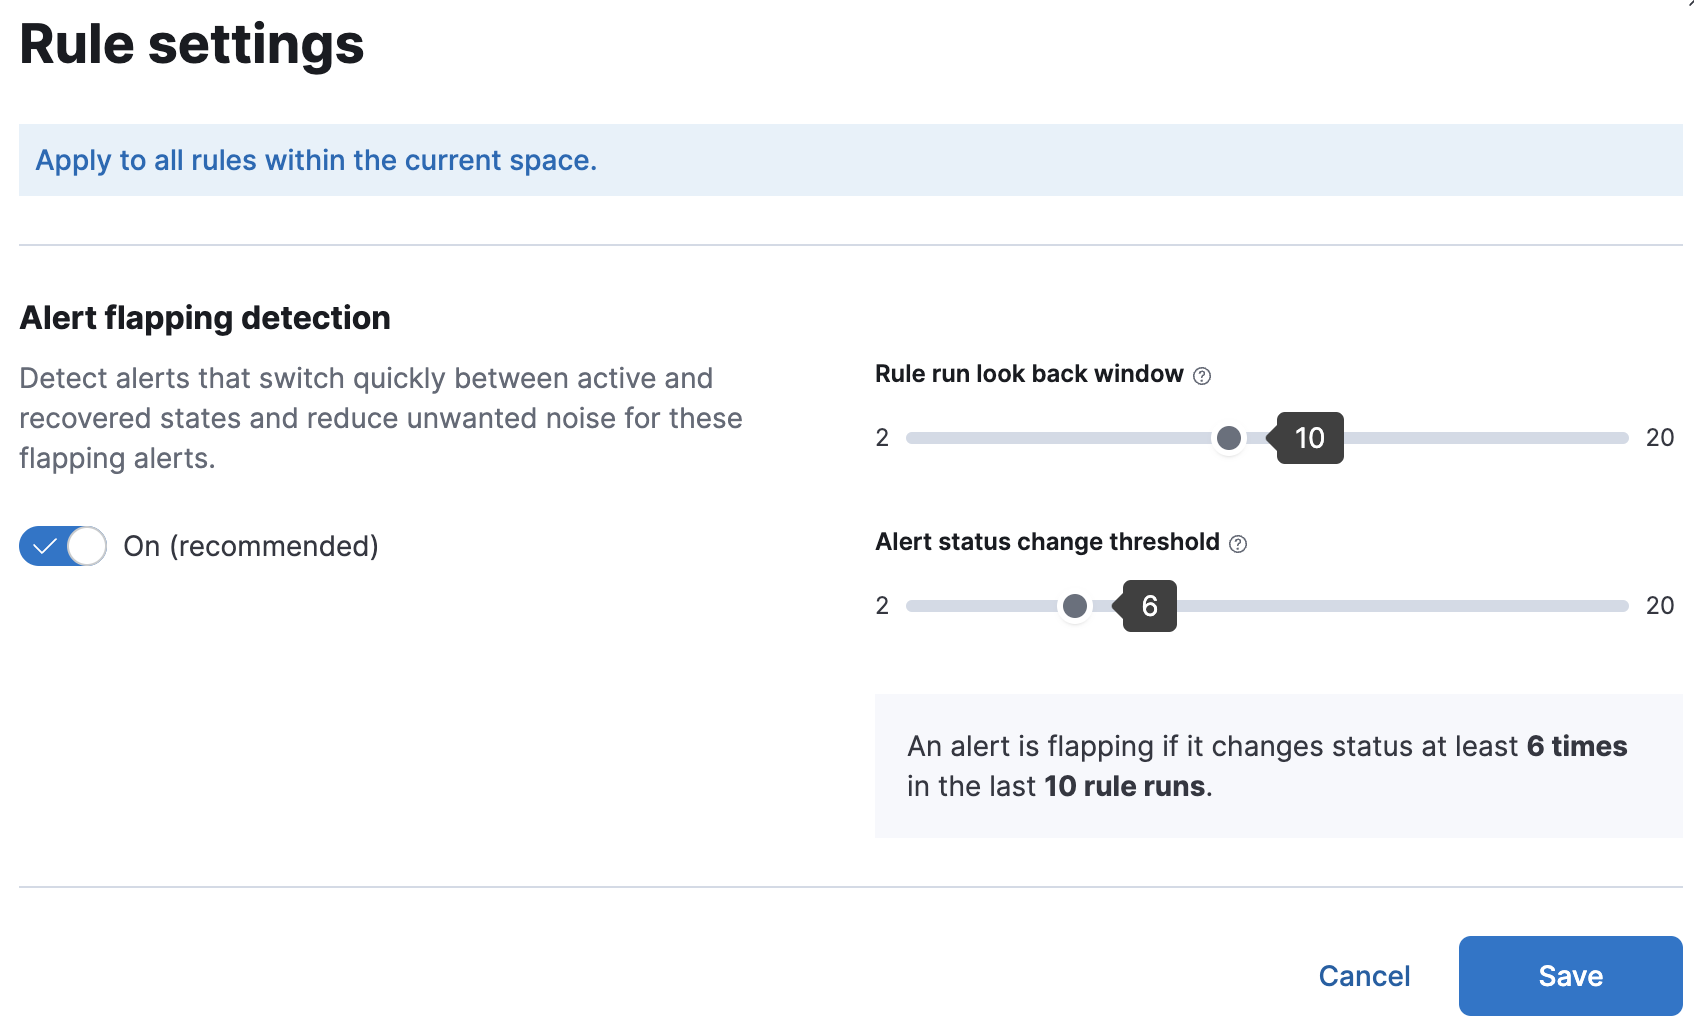
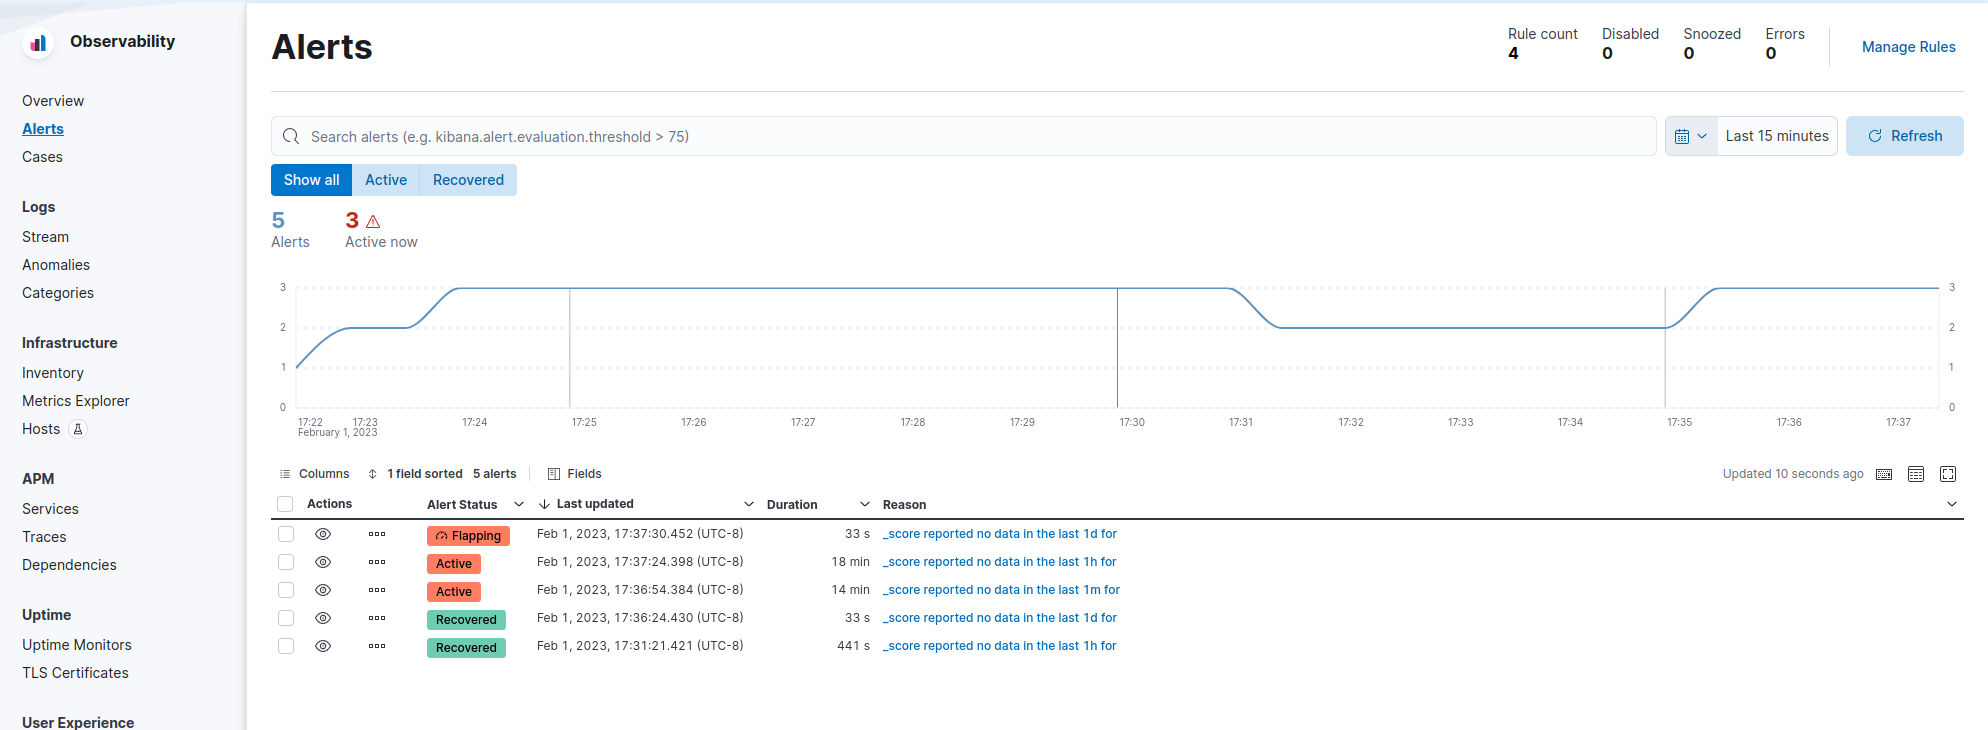
editAlert flapping detection
editFlapping occurs when the state of monitored assets, such as services, change too frequently, resulting in multiple alerts that might distract you from more important issues. To reduce the time to respond (MTTR), you can now identify frequent changes in your monitored assets by using pre-built configurations, highlighting alerts in the UI, and suppressing related notifications. For more information, check Create and manage rules.
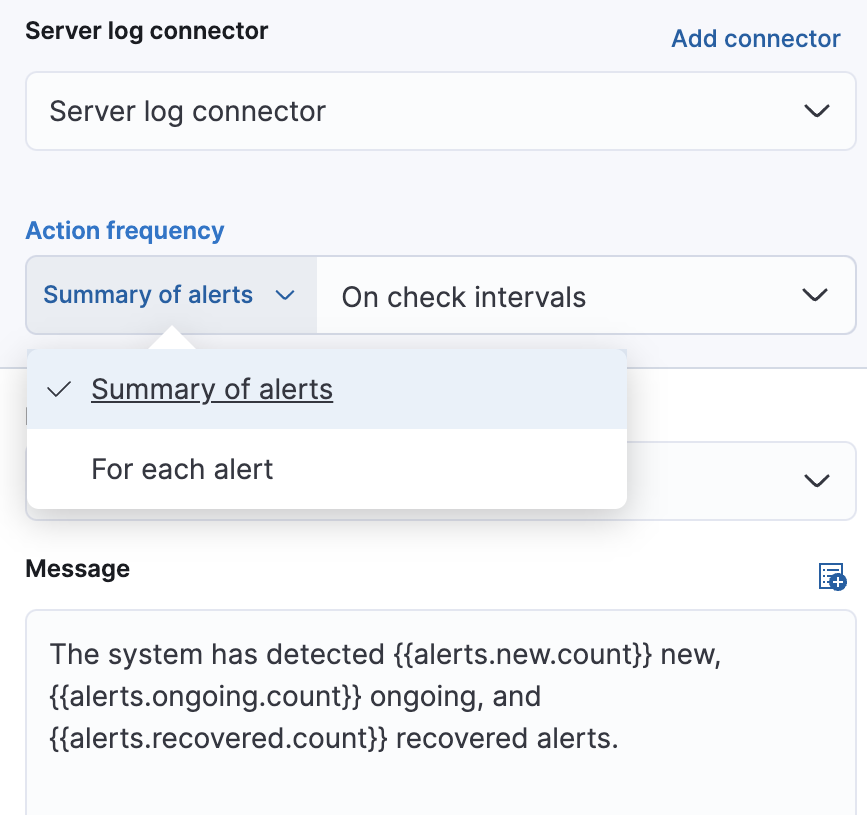
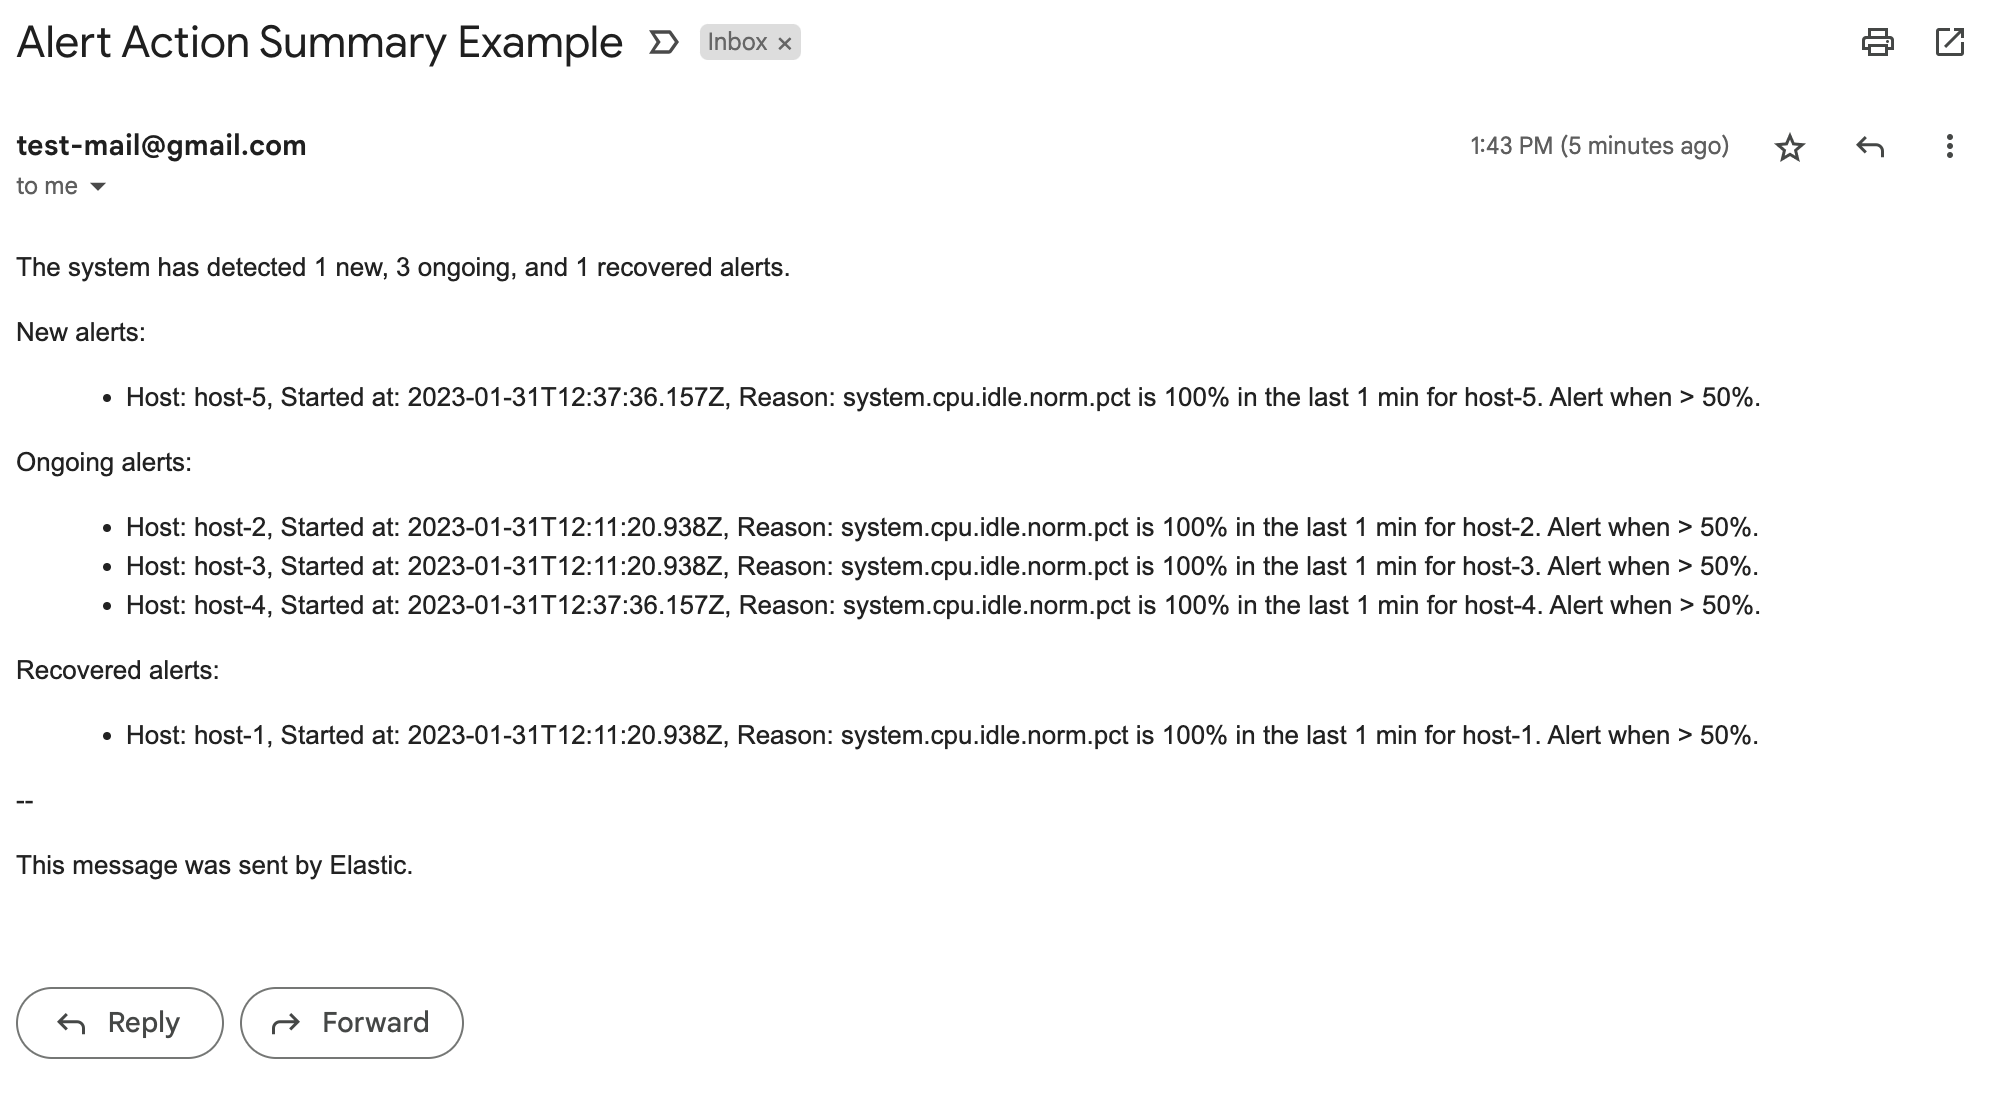
Alert action summarization
editCurrently, alert actions are triggered when the rule runs or when the alert status changes. This behavior might lead to a notification storm when an alerting rule detects a high cardinality of alerts. These situations increase the time to respond to each event and affect the overall MTTR. With the new alert actions summarization feature, you can define how to aggregate several actions into a single one with these options:
- Summary of alerts on check intervals For example, all the alerts that are detected by the same rule run will be sent in a single notification.
- Summary of alerts on custom action intervals For example, all the alerts that are detected in the last 10 hours will be sent in a single email.
This feature aims to improve the way you consume notifications from third parties and improve the MTTR by reducing unnecessary noise. For more information, check Alerting.
New actions in Case management
editThe Case table view streamlines case management with these new actions:
- More sorting and filtering options (by severity, status, last updates, and more)
- Bulk action for maintaining case assignees
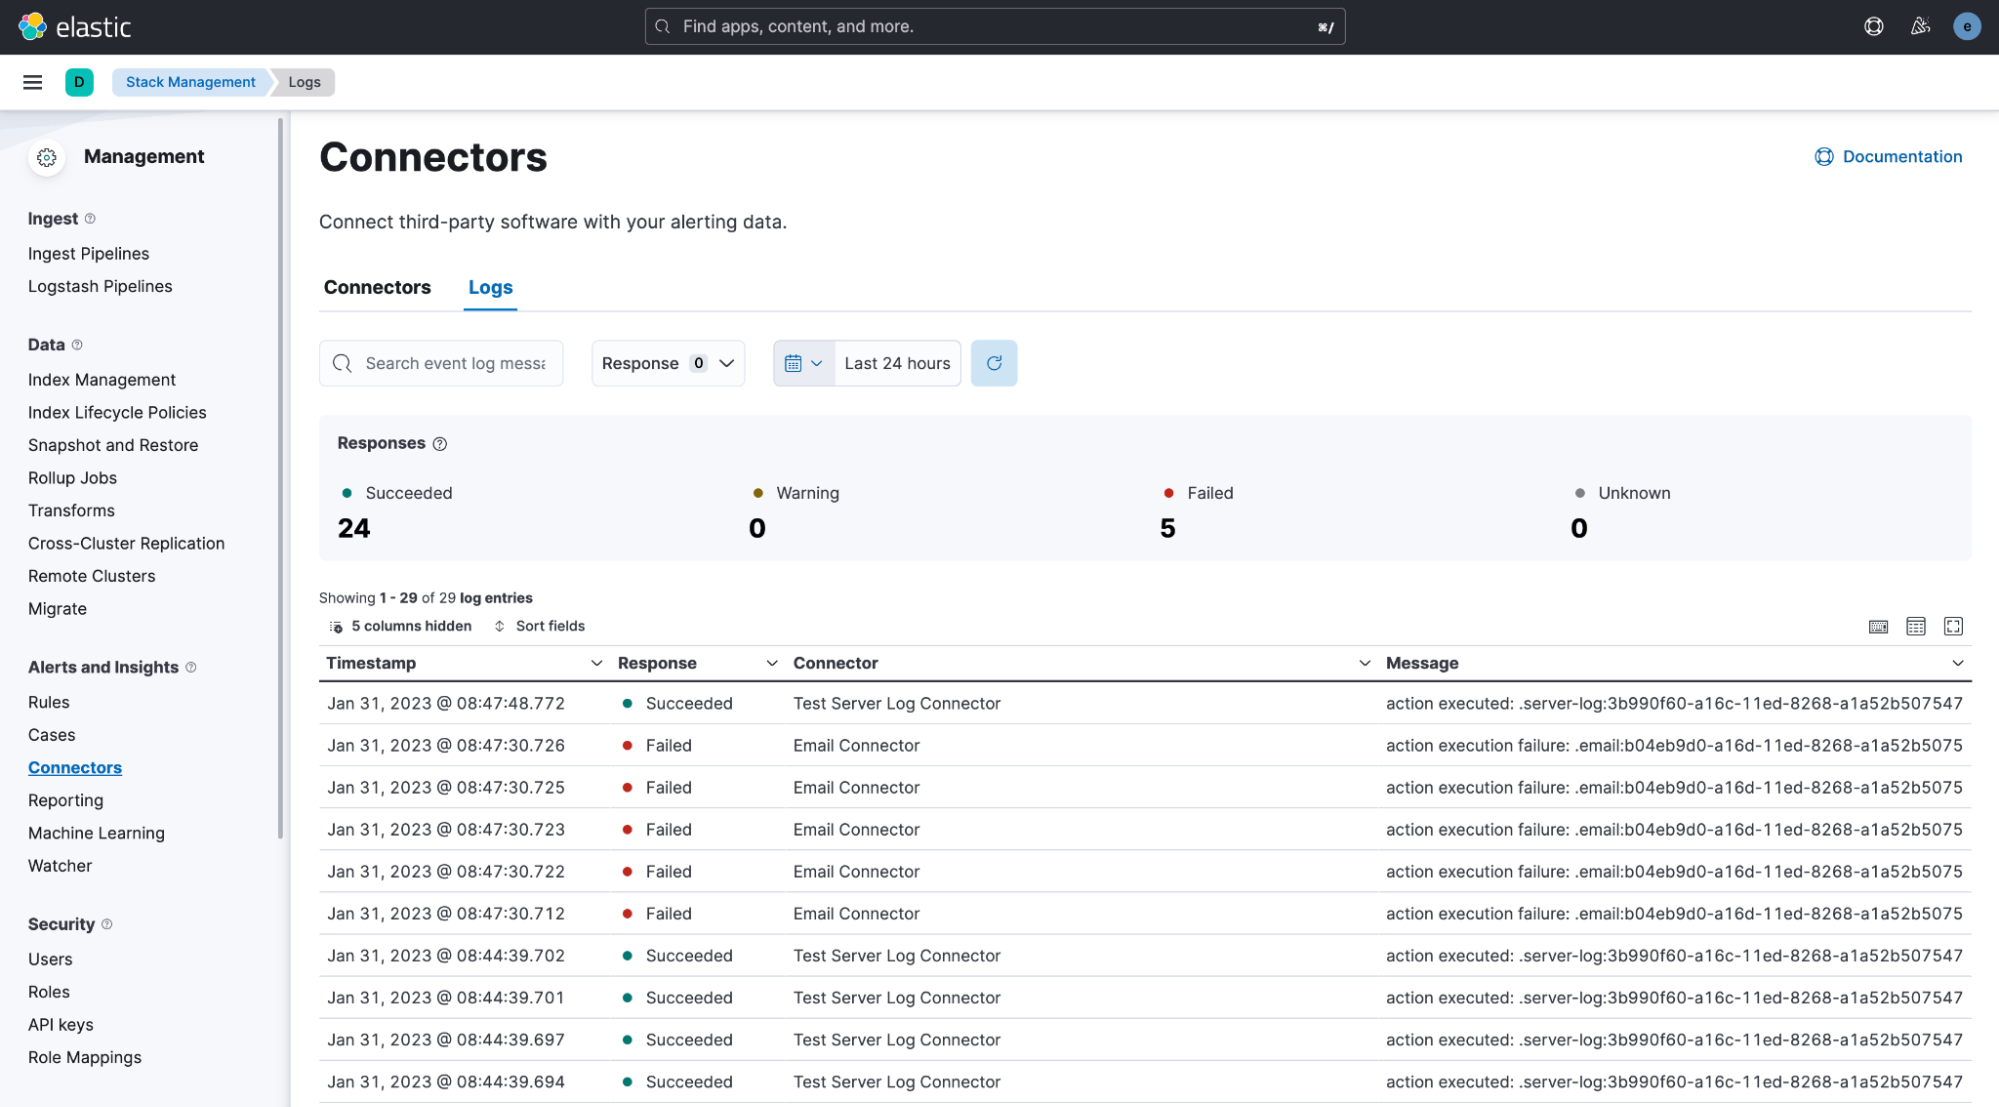
New connector log
editA new connector log is available for you to troubleshoot connector behaviors and react when something goes wrong.
Bulk action for enabling rules
editA new bulk action for enabling and disabling rules is now supported in the Rule table view.
Kibana Security
editControl concurrent user sessions
editAdministrators can now control the number of concurrent user sessions by configuring
a limit through the maxSessions setting, for increased security. Once the limit is reached,
a newly created user session will displace the oldest one (by creating a timestamp) for the same user.

Kibana audit logging enhanced
editSince its introduction, the Kibana audit logging has been enhanced with additional data of security audit interest. This release adds the client IP address field.