Create and manage rules
editCreate and manage rules
editThe Stack Management > Rules UI provides a cross-app view of alerting. Different Kibana apps like Observability, Security, Maps and Machine Learning can offer their own rules. Rules provides a central place to:
- Create and edit rules
- Manage rules including enabling/disabling, muting/unmuting, and deleting
- Drill down to rule details
- Configure settings that apply to all rules in the space
For more information on alerting concepts and the types of rules and connectors available, go to Alerting.
Required permissions
editAccess to rules is granted based on your alerting features privileges. For more information, go to Security.
Create and edit rules
editSome rules must be created within the context of a Kibana app like Metrics, APM, or Uptime, but others are generic. Generic rule types can be created in Rules by clicking the Create rule button. This will launch a flyout that guides you through selecting a rule type and configuring its conditions and actions.
After a rule is created, you can open the action menu (…) and select Edit rule to re-open the flyout and change the rule properties.
Rule type and conditions
editDepending on the Kibana app and context, you might be prompted to choose the type of rule to create. Some apps will preselect the type of rule for you.
Each rule type provides its own way of defining the conditions to detect, but an expression formed by a series of clauses is a common pattern. For example, in a metric threshold rule, the WHEN clause enables you to select an aggregation operation to apply to a numeric field.
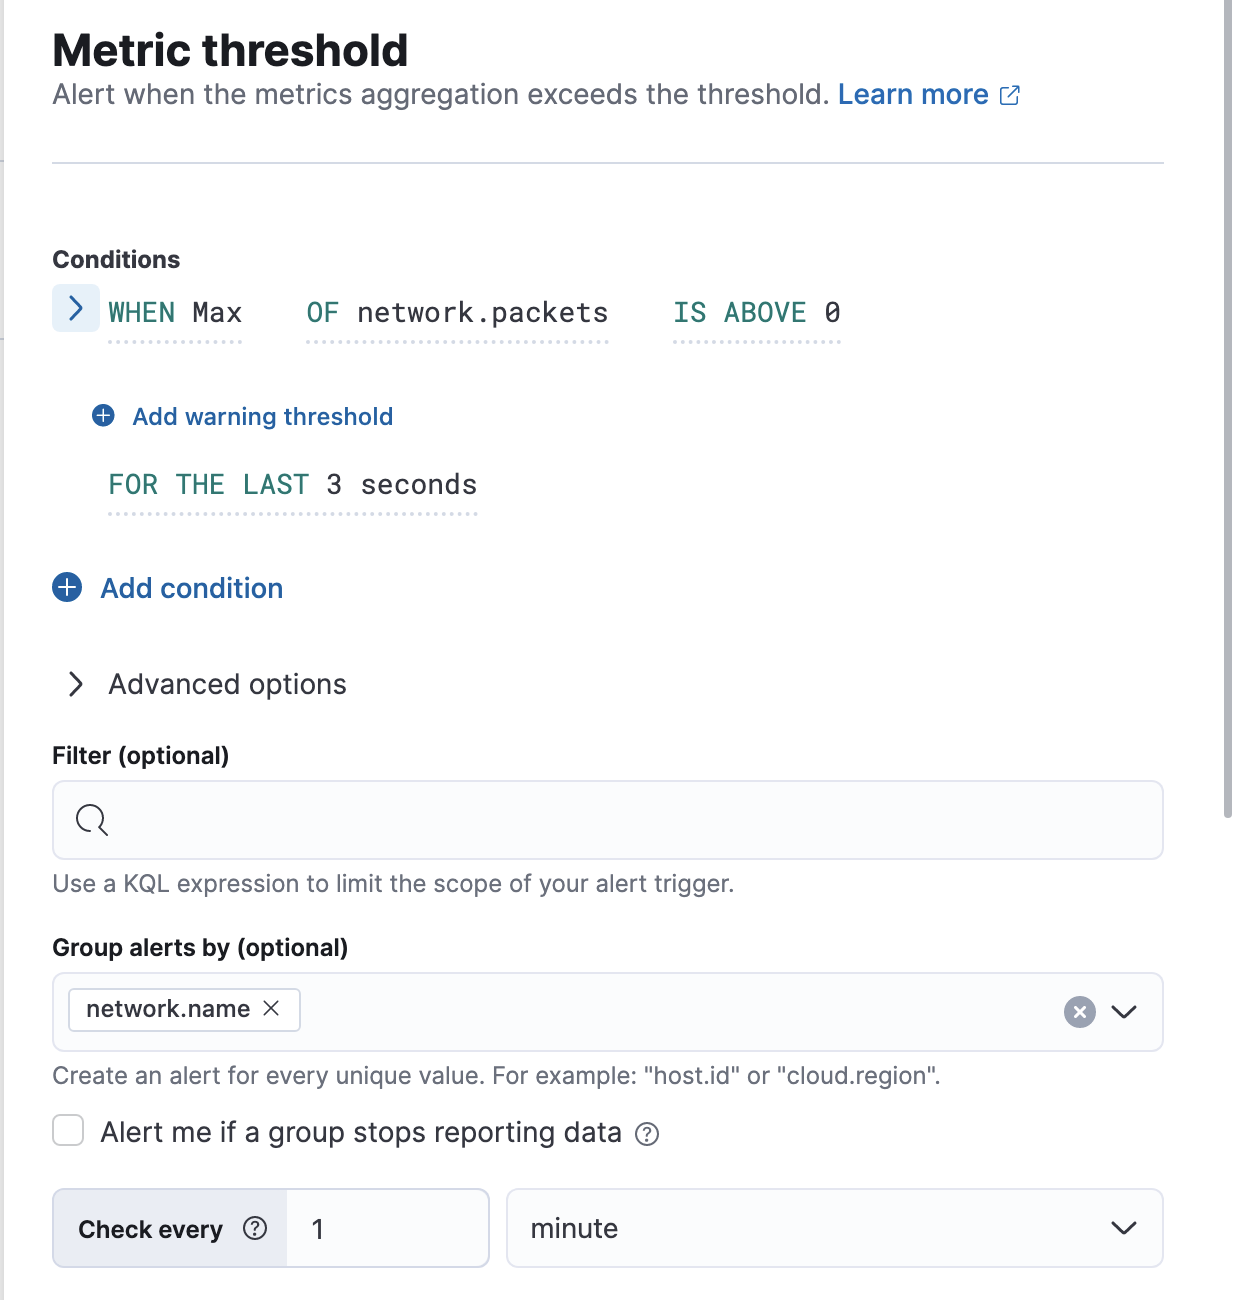
All rules must have a check interval, which defines how often to evaluate the rule conditions. Checks are queued; they run as close to the defined value as capacity allows.
For details on what types of rules are available and how to configure them, refer to Rule types.
Actions
editYou can add one or more actions to your rule to generate notifications when its conditions are met and when they are no longer met.
Each action uses a connector, which provides connection information for a Kibana service or third party integration, depending on where you want to send the notifications. If no connectors exist, click Add connector to create one.
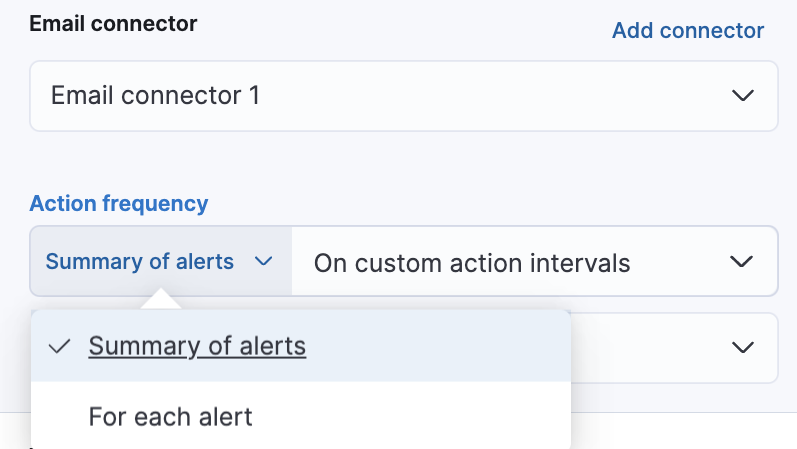
After you select a connector, set the action frequency. If the rule type supports alert summaries, you can choose to create a summary of alerts on each check interval or on a custom interval. For example, if you create a metrics threshold rule, you can send email notifications that summarize the new, ongoing, and recovered alerts each day:
If you choose a custom action interval, it cannot be shorter than the rule’s check interval.
Alternatively, you can set the action frequency such that the action runs for each alert. If the rule type does not support alert summaries, this is your only available option. You must choose when the action runs (for example, at each check interval, only when the alert status changes, or at a custom action interval). You must also choose an action group, which affects whether the action runs (for example, the action runs when the issue is detected or when it is recovered). Each rule type has a specific set of valid action groups.
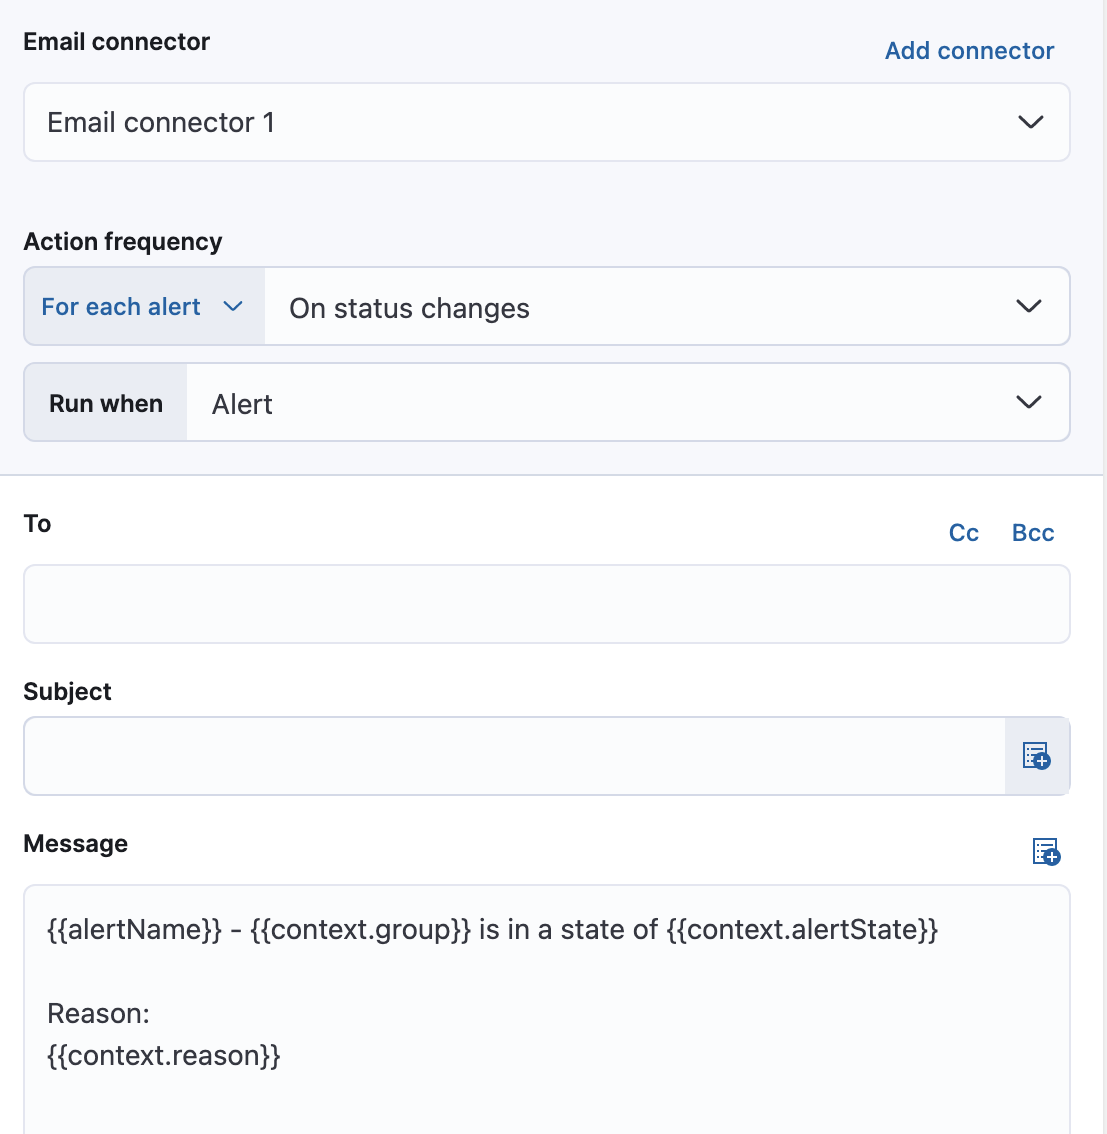
Each connector enables different action properties. For example, an email connector enables you to set the recipients, the subject, and a message body in markdown format. For more information about connectors, refer to Connectors.
If you are not using alert summaries, actions are triggered per alert and a rule can end up generating a large number of actions. Take the following example where a rule is monitoring three servers every minute for CPU usage > 0.9, and the action frequency is On check intervals:
- Minute 1: server X123 > 0.9. One email is sent for server X123.
- Minute 2: X123 and Y456 > 0.9. Two emails are sent, one for X123 and one for Y456.
- Minute 3: X123, Y456, Z789 > 0.9. Three emails are sent, one for each of X123, Y456, Z789.
In this example, three emails are sent for server X123 in the span of 3 minutes for the same rule. Often, it’s desirable to suppress these re-notifications. If
you set the action frequency to On custom action intervals with an interval of 5 minutes, you reduce noise by getting emails only every 5 minutes for
servers that continue to exceed the threshold:
- Minute 1: server X123 > 0.9. One email will be sent for server X123.
- Minute 2: X123 and Y456 > 0.9. One email will be sent for Y456.
- Minute 3: X123, Y456, Z789 > 0.9. One email will be sent for Z789.
To get notified only once when a server exceeds the threshold, you can set the action frequency to On status changes. Alternatively, if the rule type supports alert summaries, consider using them to reduce the volume of notifications.
Action variables
editYou can pass rule values to an action at the time a condition is detected. To view the list of variables available for your rule, click the "add rule variable" button:
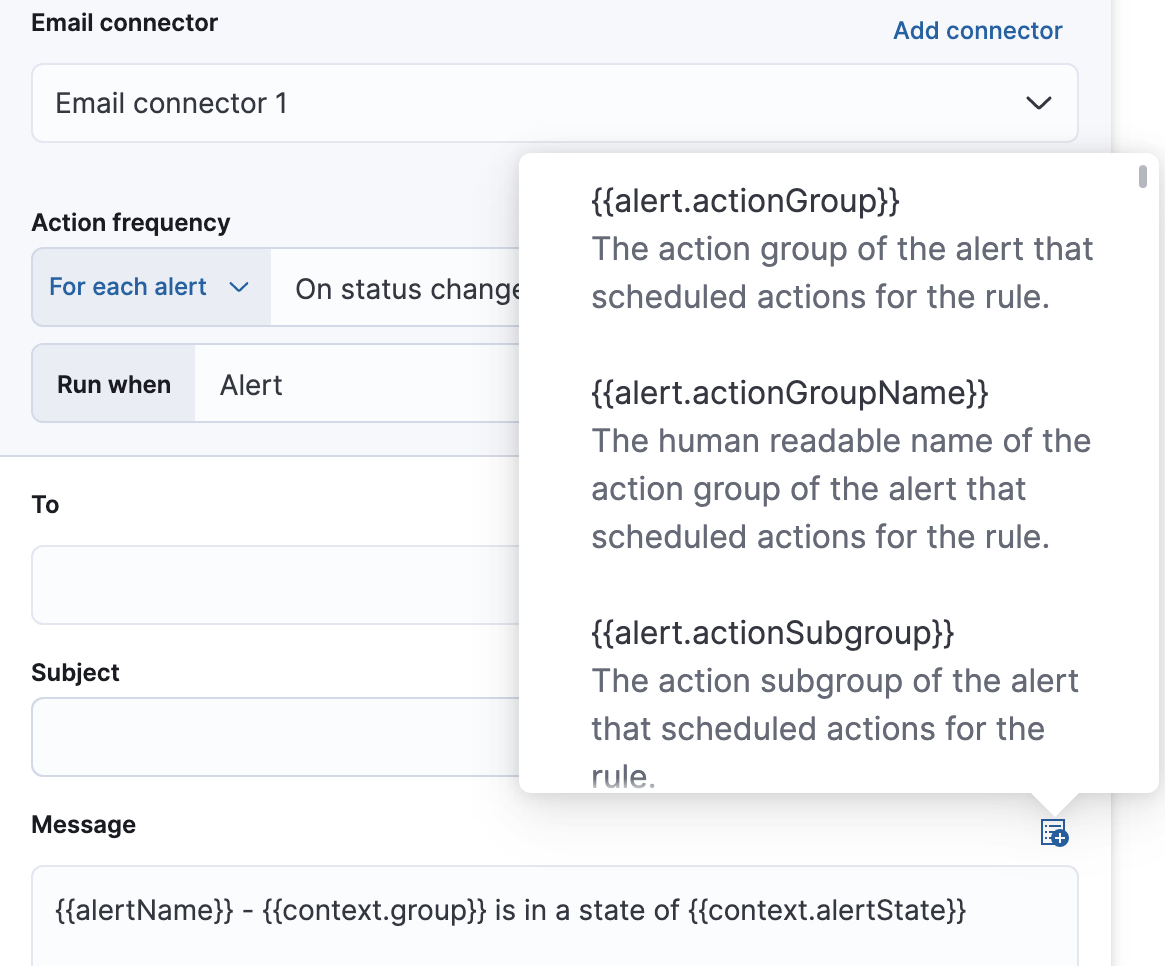
For more information about common action variables, refer to Rule action variables.
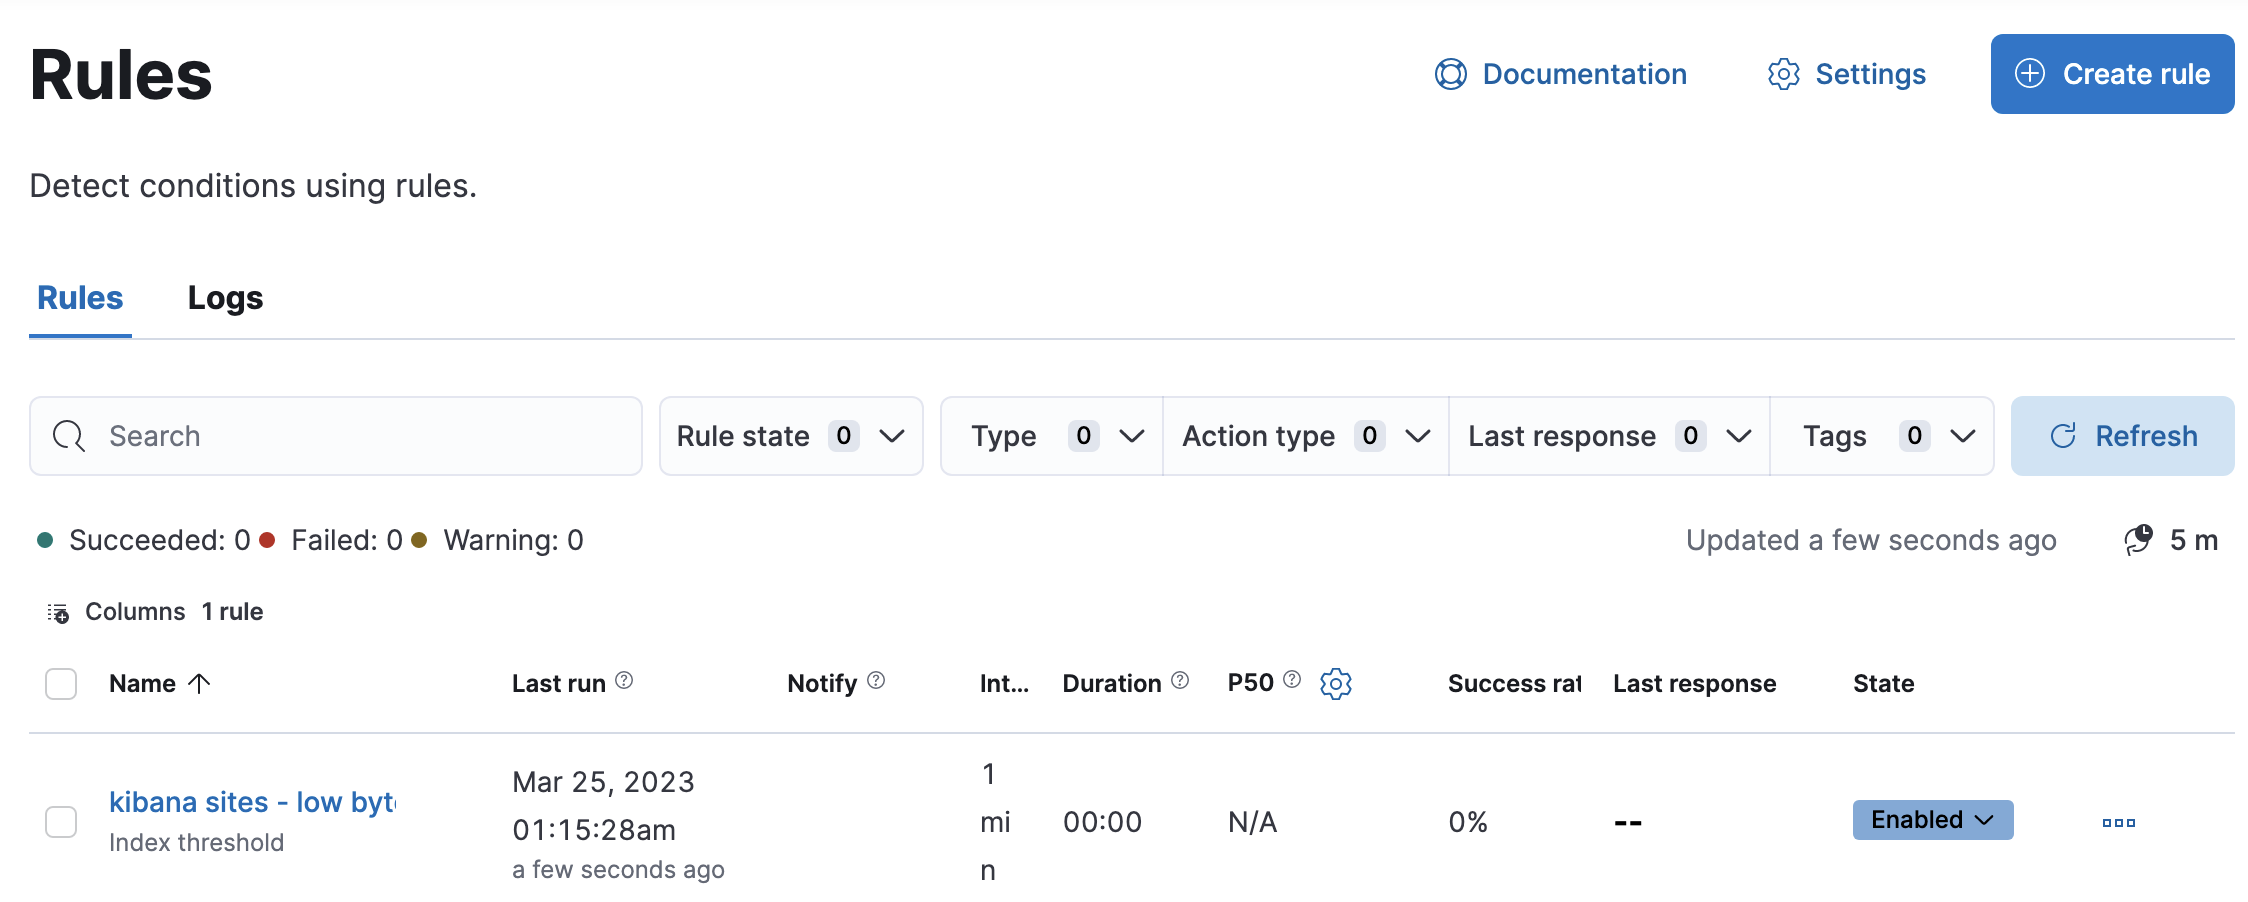
Snooze and disable rules
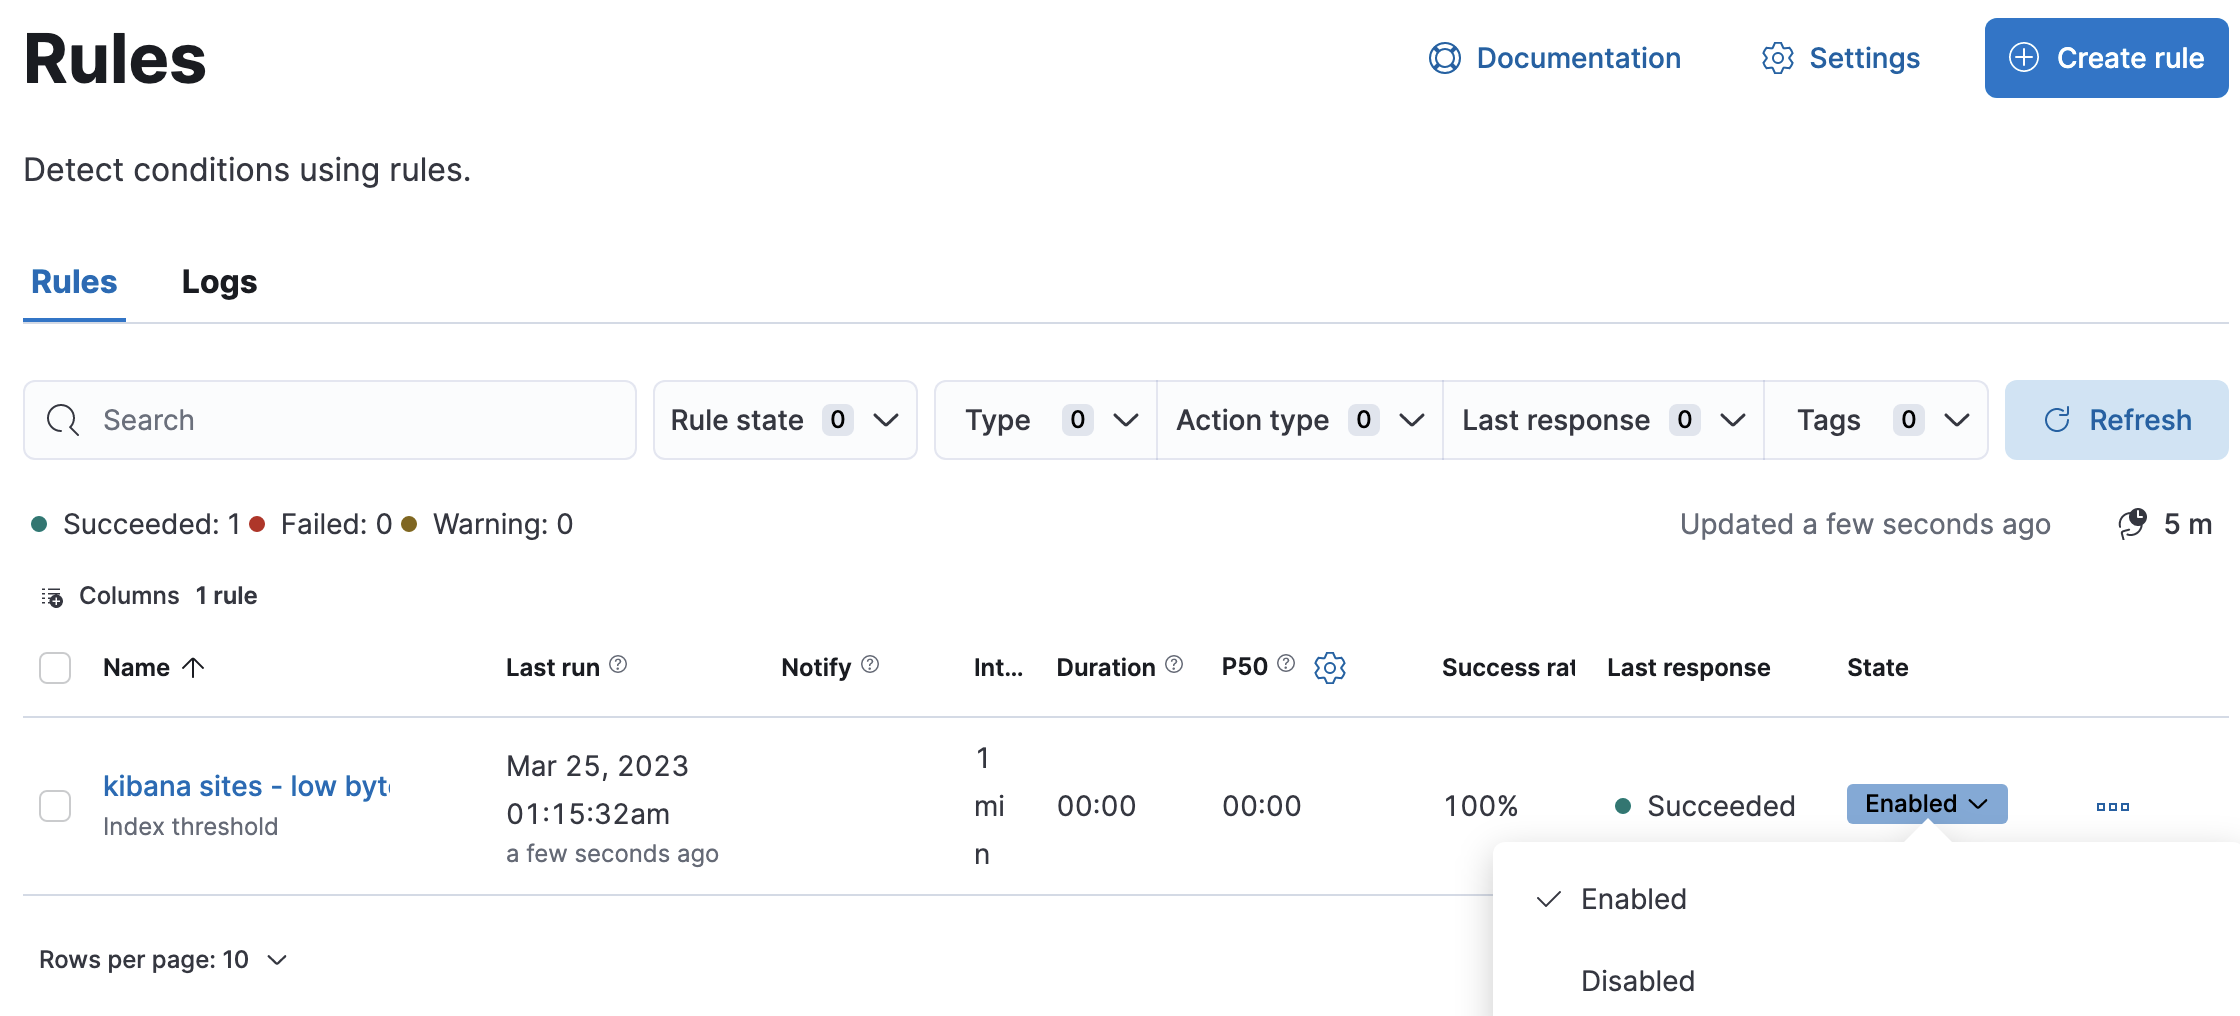
editThe rule listing enables you to quickly snooze, disable, enable, or delete individual rules. For example, you can change the state of a rule:
When you snooze a rule, the rule checks continue to run on a schedule but the alert will not trigger any actions. You can snooze for a specified period of time, indefinitely, or schedule single or recurring downtimes:
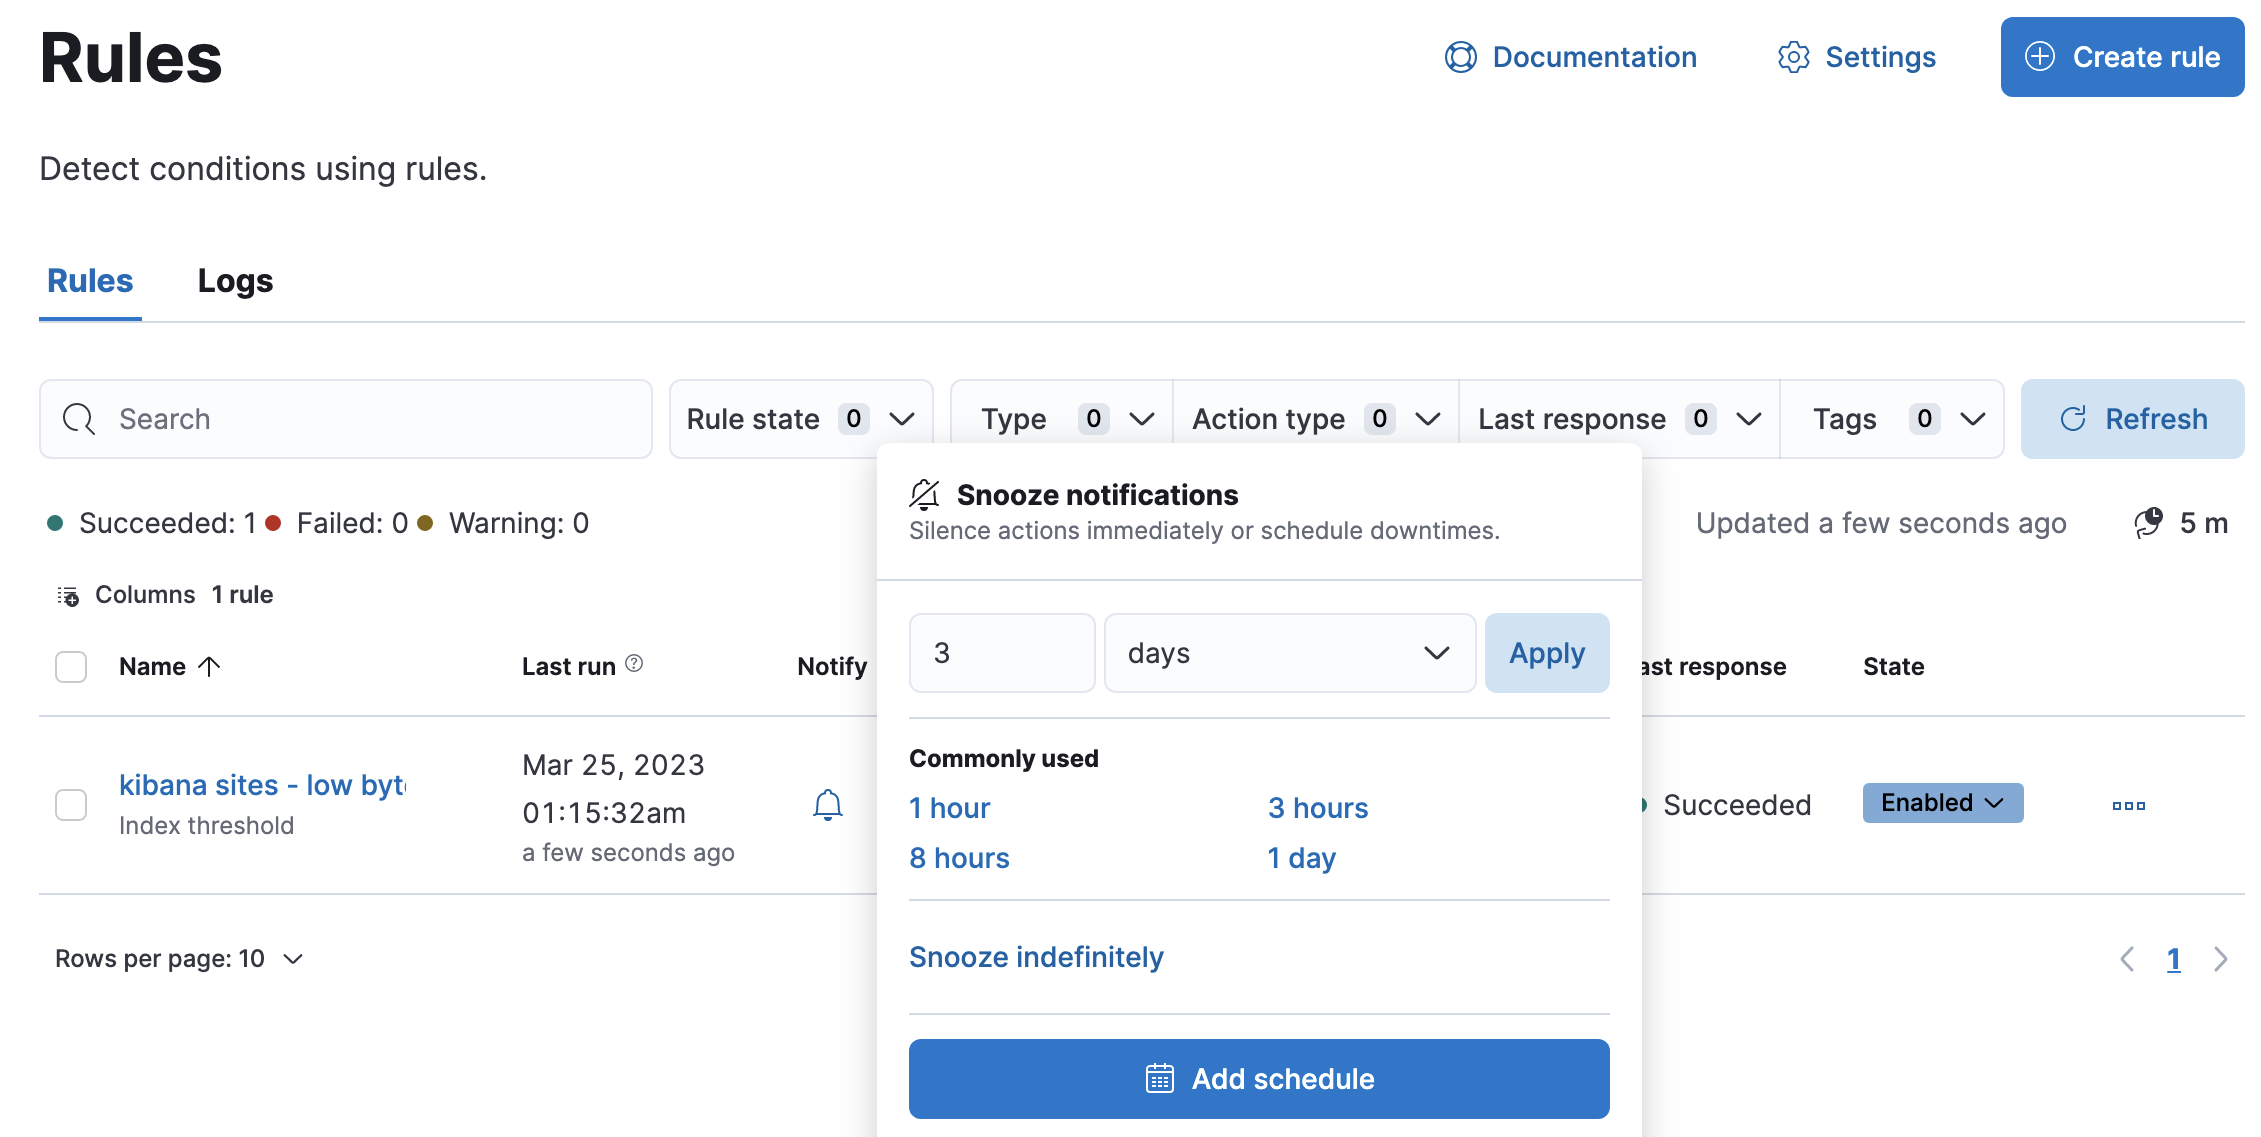
When a rule is in a snoozed state, you can cancel or change the duration of this state.
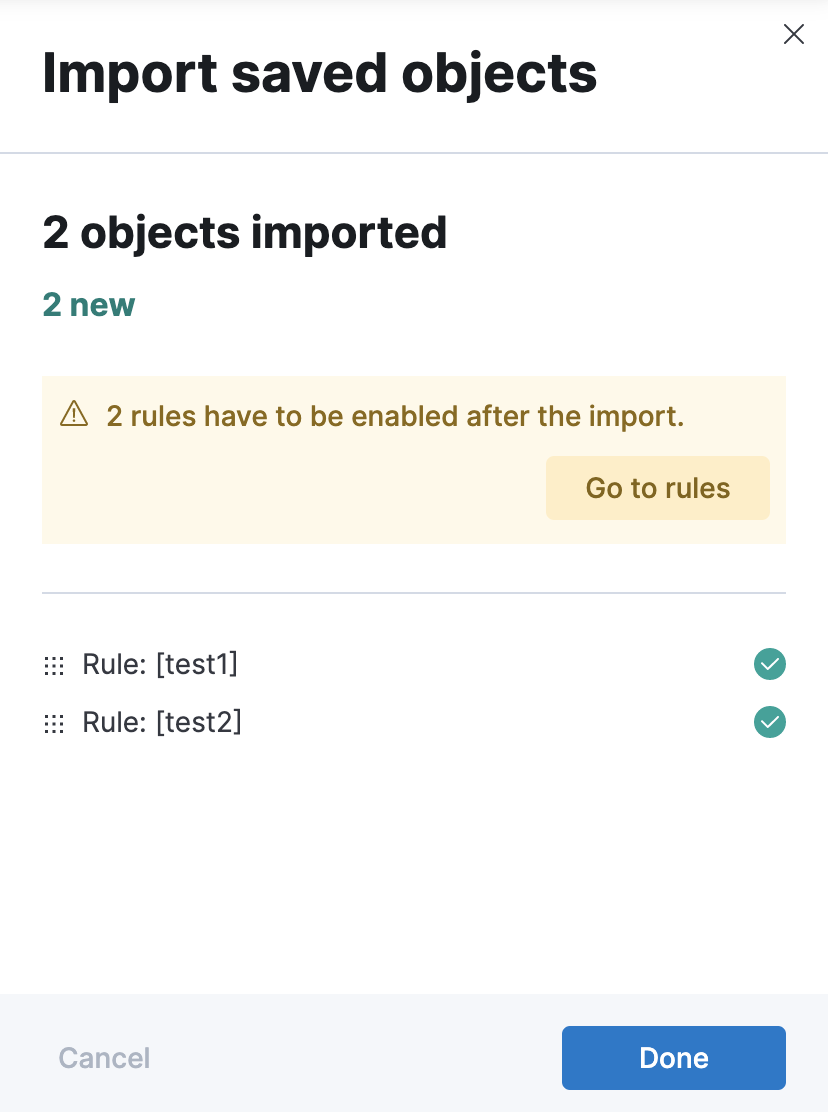
Import and export rules
editTo import and export rules, use Saved Objects.
Some rule types cannot be exported through this interface:
Security rules can be imported and exported using the Security UI.
Stack monitoring rules are automatically created for you and therefore cannot be managed in Saved Objects.
Rules are disabled on export. You are prompted to re-enable the rule on successful import.
View rule details
editYou can determine the health of a rule by looking at the Last response column in Stack Management > Rules. A rule can have one of the following responses:
-
failed - The rule ran with errors.
-
succeeded - The rule ran without errors.
-
warning - The rule ran with some non-critical errors.
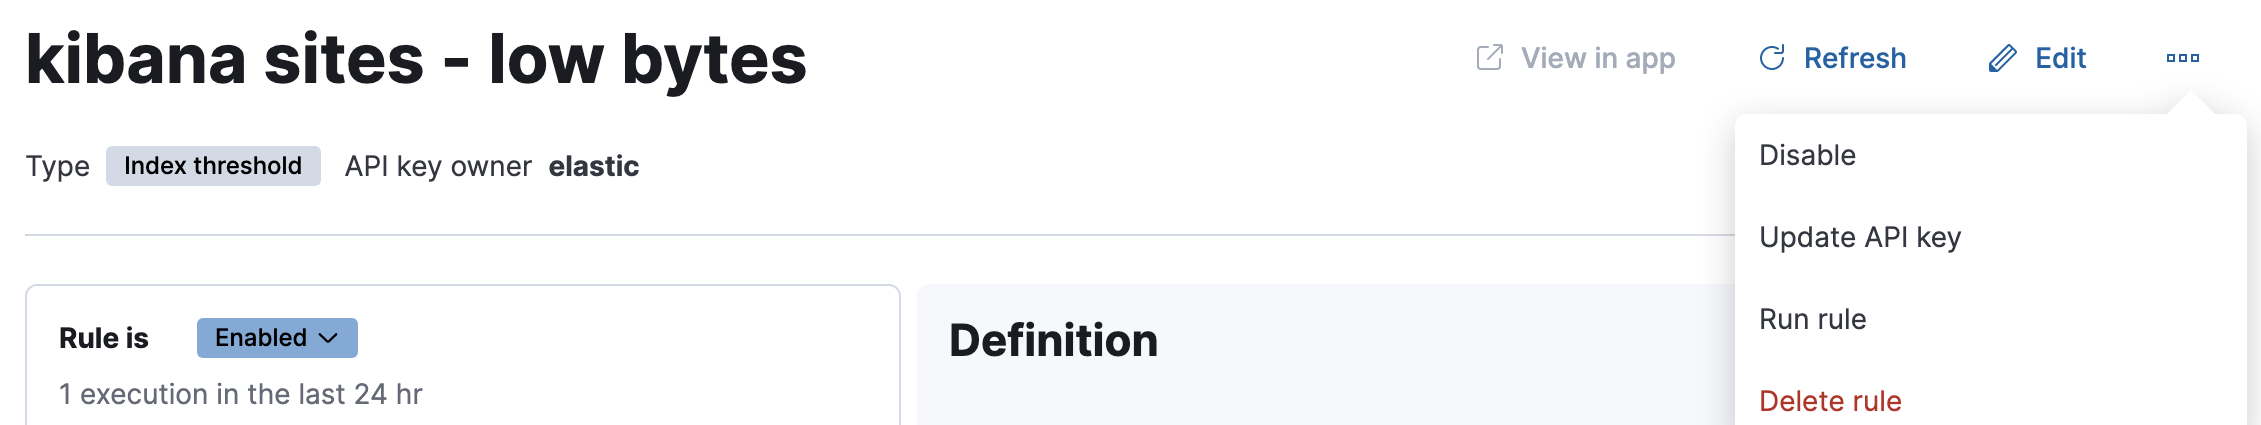
Click the rule name to access a rule details page:
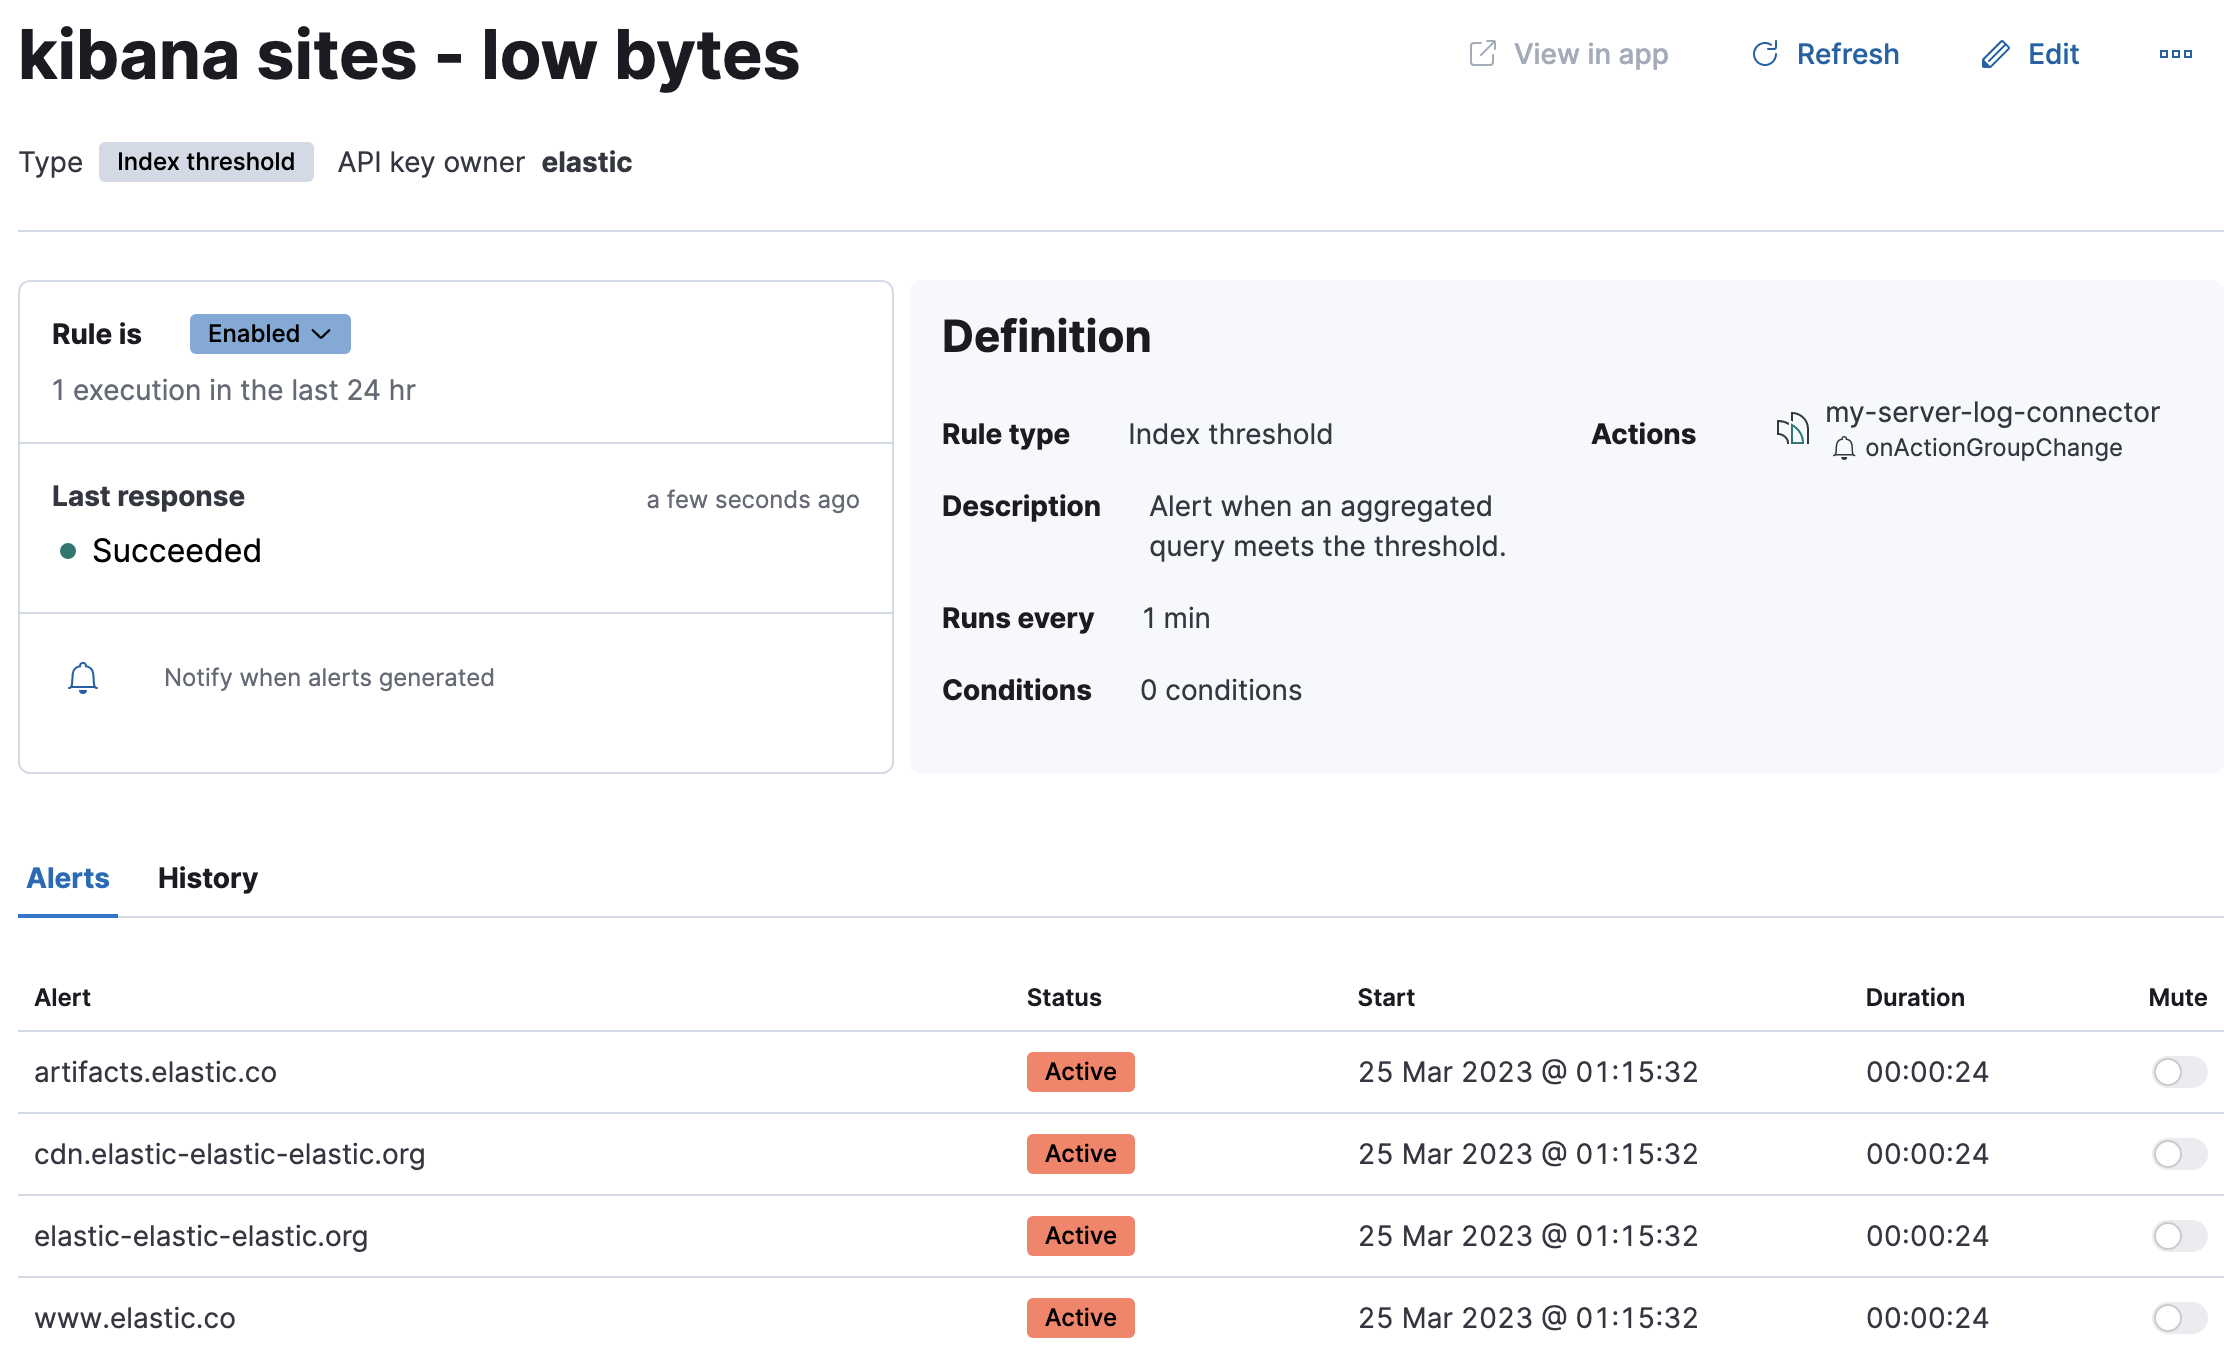
In this example, the rule detects when a site serves more than a threshold number of bytes in a 24 hour period. Four sites are above the threshold. These are called alerts - occurrences of the condition being detected - and the alert name, status, time of detection, and duration of the condition are shown in this view. Alerts come and go from the list depending on whether the rule conditions are met.
When an alert is created, it generates actions. If the conditions that caused the alert persist, the actions run again according to the rule notification settings. There are three common alert statuses:
-
active - The conditions for the rule are met and actions should be generated according to the notification settings.
-
flapping - The alert is switching repeatedly between active and recovered states.
-
recovered - The conditions for the rule are no longer met and recovery actions should be generated.
The flapping state is possible only if you have enabled alert flapping detection in Stack Management > Rules > Settings. For each space, you can choose a look back window and threshold that are used to determine whether alerts are flapping. For example, you can specify that the alert must change status at least 6 times in the last 10 runs. If the rule has actions that run when the alert status changes, those actions are suppressed while the alert is flapping.
You can suppress future actions for a specific alert by turning on the Mute toggle. If a muted alert no longer meets the rule conditions, it stays in the list to avoid generating actions if the conditions recur. You can also disable a rule, which stops it from running checks and clears any alerts it was tracking. You may want to disable rules that are not currently needed to reduce the load on Kibana and Elasticsearch.