Elastic Stack 6.7.0 released
Version 6.7 of the Elastic Stack is here, and oh what a release it is. We're not sure if Christmas came early, late, or if all our Christmases came at once!
In this announcement blog, we cover some of the release highlights. Be sure to dig into the individual announcement posts to dig into all the details. Or even better take the new version for a spin. Version 6.7 is available on our Elasticsearch Service - the only hosted Elasticsearch offering to offer these new features. Or you can download the stack for a self-managed experience in your preferred deployment environment.
Elastic Maps: Expanding Mapping Capability for Geo Data in Kibana
Geo is an important part of search, and this location-based data powers use cases from ranking neighborhood restaurants, to understanding where the latest marketing campaign has the biggest impact, to hunting down network threats around the globe. Over the years, we have invested heavily in improving our geo capabilities across the stack -- from better storage efficiency and dramatic improvements to query performance in Elasticsearch, to providing more geospatial visualization options in Kibana, to freely hosting basemap and country/region borders with the Elastic Maps Service.
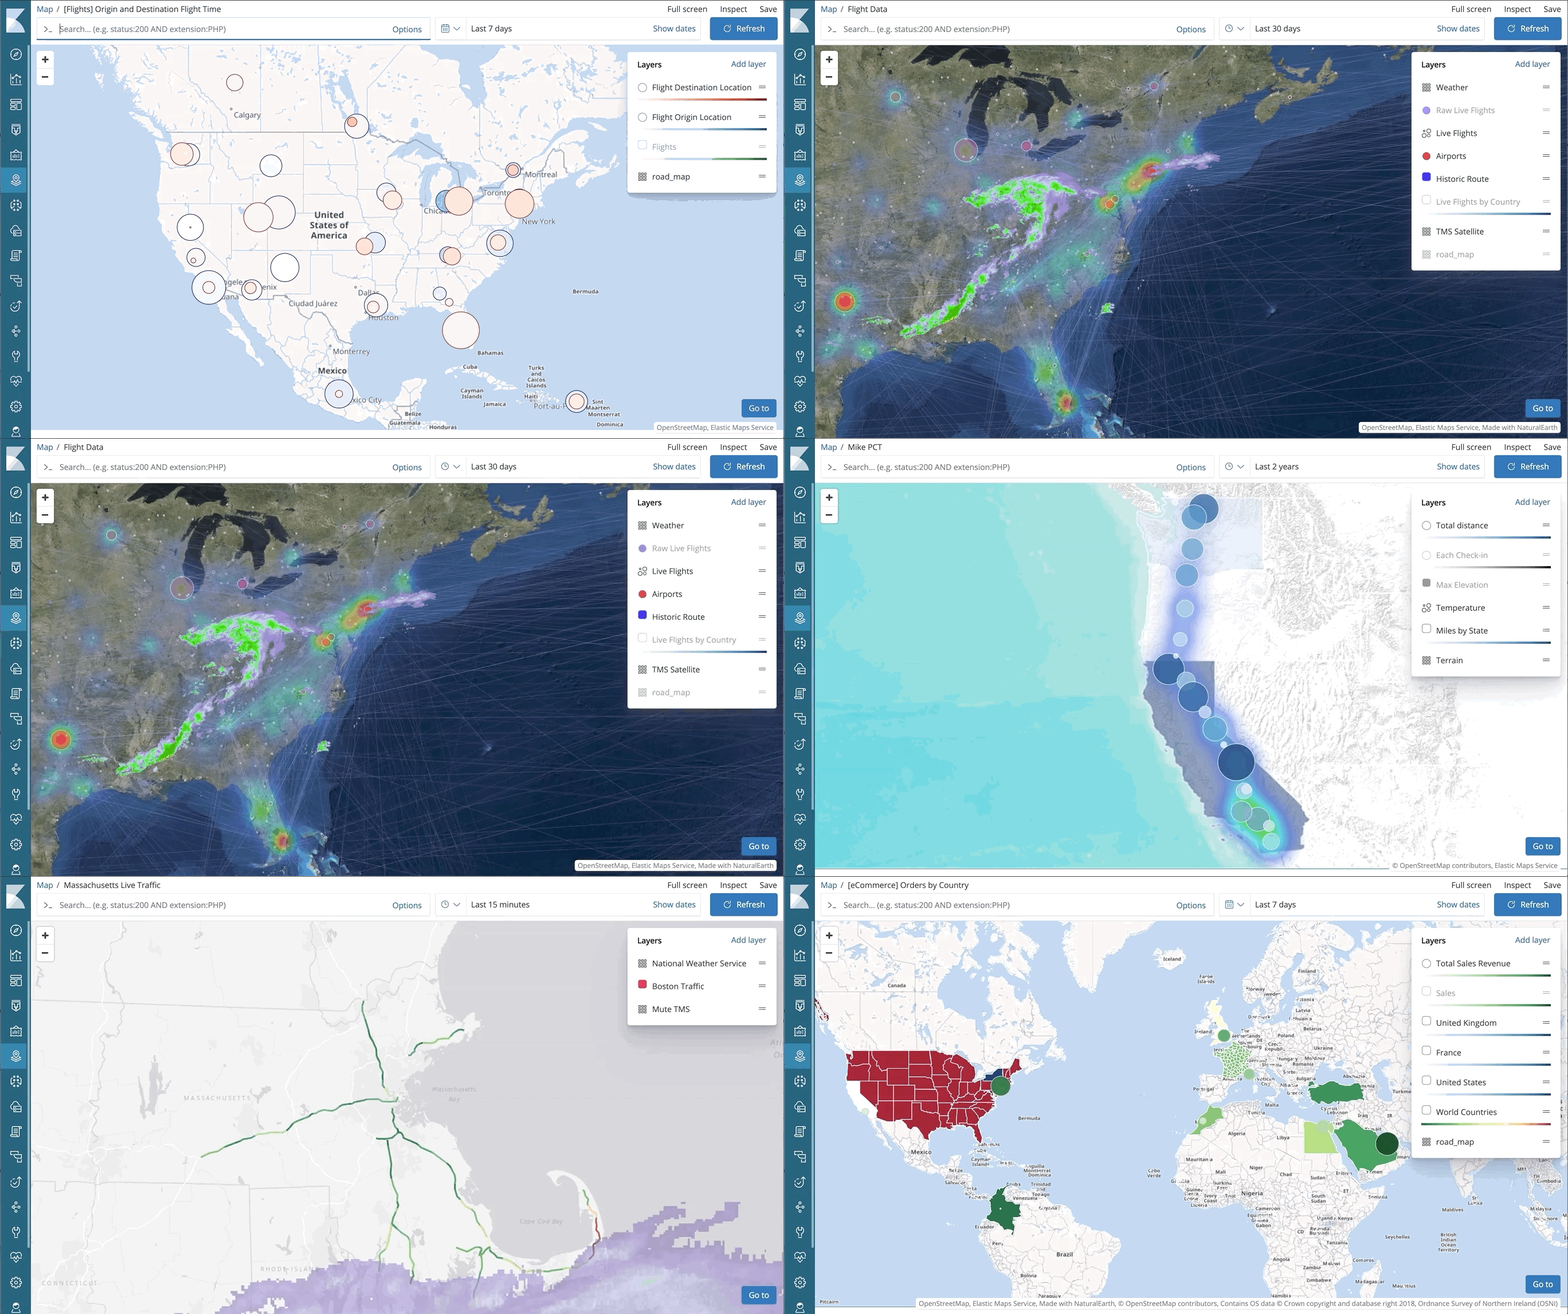
Keeping in line with this evolution, we are excited to introduce Elastic Maps, a new dedicated solution for mapping, querying, and visualizing geospatial data in Kibana. Elastic Maps greatly expands on existing geospatial visualization options in Kibana with the introduction of features like:
- Visualizing multiple layers and data sources in the same map
- Dynamic data-driven styling on vector layers on maps
- Mapping both aggregate and document-level data
- Visibility control of individual layers (based on zoom level) to control visual clutter
And like everything else in Kibana, Elastic Maps embeds the query bar with autocomplete for the real-time ad hoc search & query experience that you have come to expect with the Elastic Stack.

Map all the details in this detailed Elastic Maps announcement blog.
Elastic Uptime: Actively Monitor Uptime of Services & Application
In the last few releases, we have introduced several new features, like autodiscovery for Kubernetes, and the Infrastructure and Logs solutions, to help Elastic users with infrastructure monitoring and observability use cases streamline their operations. We are excited to build on those recent efforts and introduce a new solution, Elastic Uptime, that makes it easy to detect when application services are down or responding slowly, and proactively notifies users about problems even before those services are called by the application.
Elastic Uptime is based on Heartbeat, a lightweight data shipper for uptime monitoring, that can be deployed both inside and outside an organization's network. All it needs is network access to the desired HTTP, TCP, or ICMP endpoint being monitored. Use cases for Uptime solution include: host availability, service monitoring, website monitoring, and API monitoring.
Bringing uptime data alongside logs, metrics, and tracing data in Elasticsearch, means that users can more efficiently track and manage all their data in a single operational store.

Get all the details on the new Uptime solution in this detail post.
Elasticsearch
6.7 is a big release for Elasticsearch. In addition to launching several new features, we are excited to graduate several key Elasticsearch features to General Availability (GA) status and marking them production ready.
As the Elasticsearch post mentions, if it is an Elasticsearch feature with a 3-letter acronym, odds are it's now GA in 6.7.
Cross Cluster Replication (CCR) is GA
Cross Cluster Replication (CCR), which was introduced as a beta feature in version 6.5, was one of the most heavily requested features for Elasticsearch. CCR has a variety of use cases, including cross-datacenter and cross-region replication, replicating data to get it closer to the application server and user, and maintaining a centralized reporting cluster replicated from a large number of smaller clusters.
In addition to maturing this feature to GA status, version 6.7 introduces several usability and UI improvements to CCR. Check out the details in the Elasticsearch release post.
Index Lifecycle Management (ILM) is GA
Index lifecycle management (ILM), which was released as a beta feature in Elasticsearch 6.6, is now generally available and ready for production use.
Handling how Elasticsearch indices are stored and configured as they age is a critical administrative task to optimize cluster performance and cost. ILM helps Elasticsearch admins define and automate those lifecycle management policies, i.e, how data is to be managed and moved between hot, warm, cold, and deletion phases as it ages.
In addition to graduating index lifecycle management to GA status, version 6.7 also adds new capabilities to this feature. Most notably, users can now add "freeze index" action in the cold phase, significantly reducing the heap needed to store the index. Read about this and other ILM enhancements in the Elasticsearch 6.7 detail post.
Elasticsearch SQL (including JDBC & ODBC Clients) is GA
Elasticsearch SQL, which was introduced in version 6.3, introduced a way for users to interact and query their Elasticsearch data using a very familiar syntax: SQL. The addition of this feature opened up the full-text power of Elasticsearch to many more users. In addition to the SQL query syntax, Elasticsearch SQL functionality also includes the JDBC and ODBC clients, which allows 3rd party tools that support these drivers to connect to Elasticsearch as a backend datastore.
We are excited to graduate all these features to GA status. Get all the details in the Elasticsearch post.
We are barely skimming the surface of Elasticsearch 6.7 here. There's much more goodness in Elasticsearch 6.7. You can get all the details in the Elasticsearch release post.
Kibana
Canvas is GA
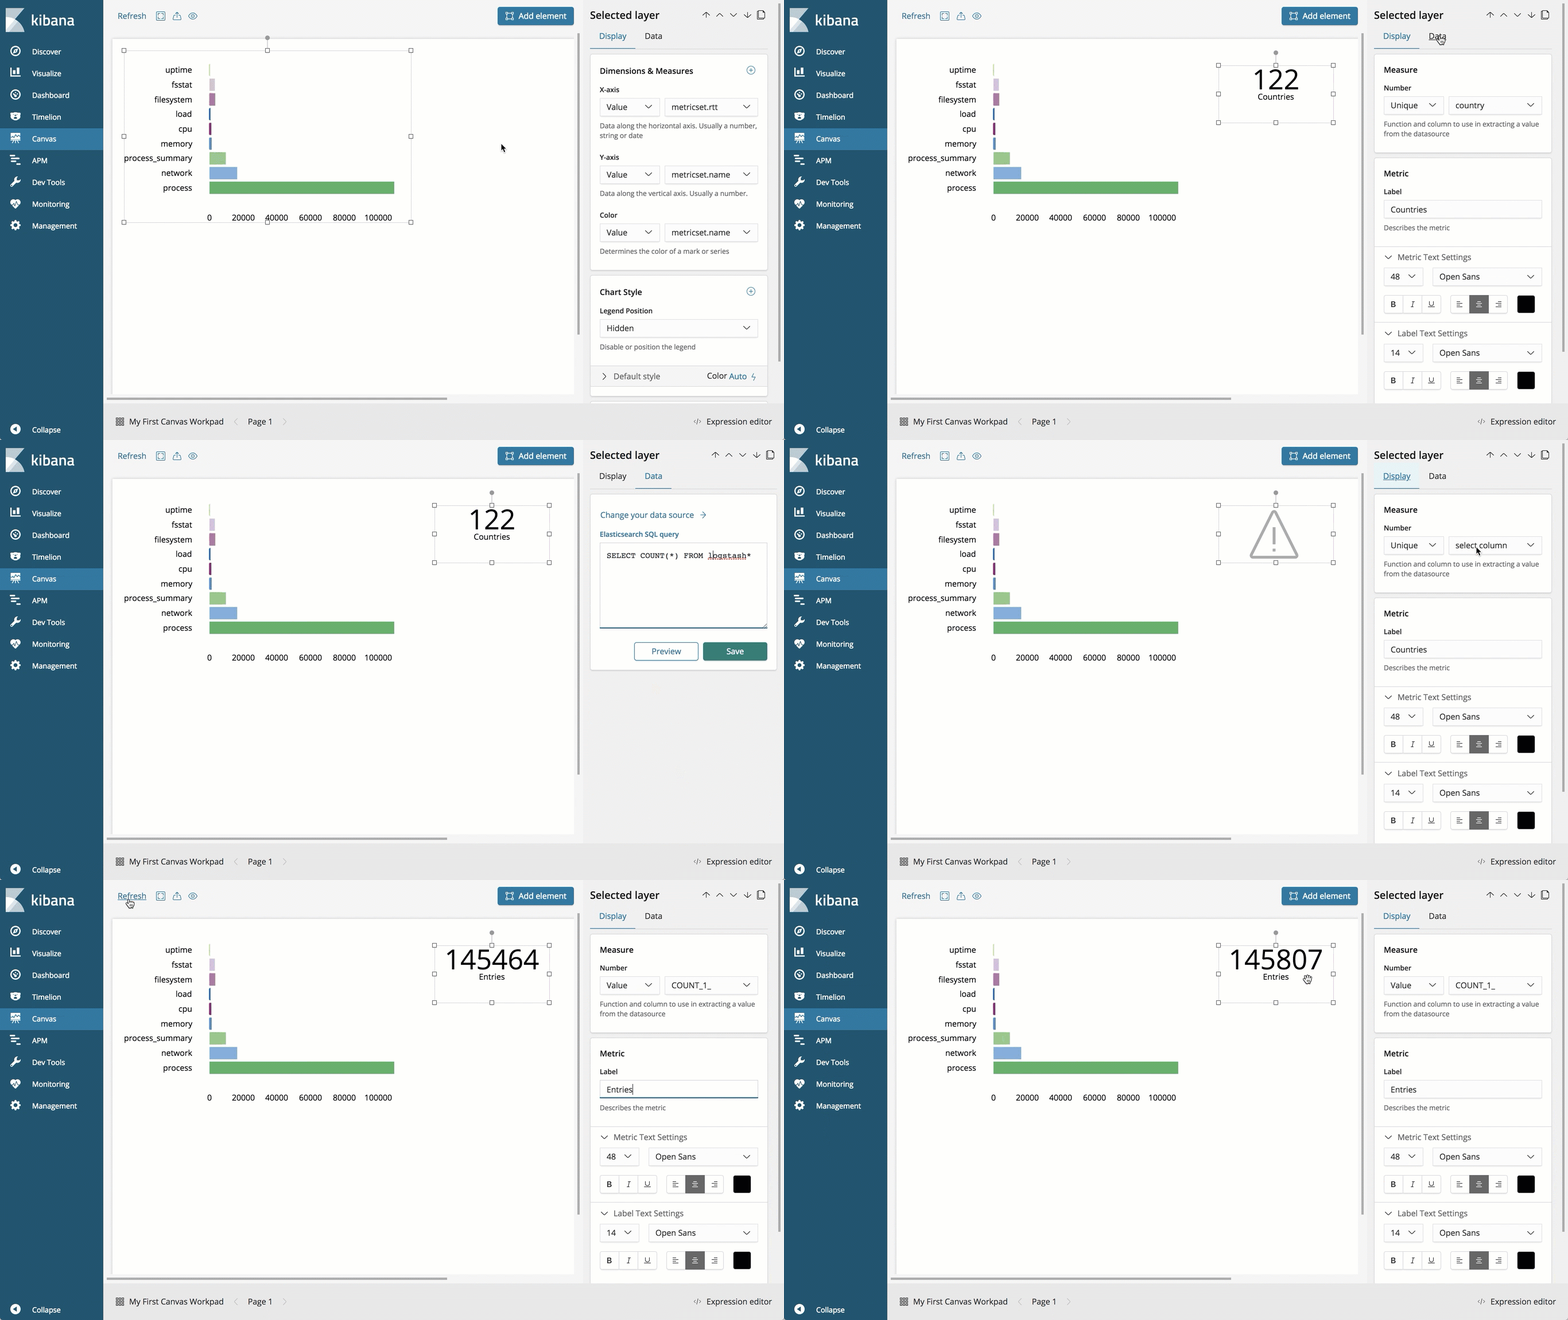
Canvas, introduced as a beta feature in version 6.5, lets users showcase and present live data from Elasticsearch with pixel-perfect precision. We are excited to mark Canvas GA in version 6.7. Canvas elevates the visual storytelling in Kibana to new heights, opening up your data analysis and insights to broader audiences. It includes full support for Elasticsearch SQL, and just like the JDBC and ODBC clients, it lets Elasticsearch users expand the reach and impact of their data to broader business audiences.
Introducing Kibana Localization; first up Simplified Chinese
In version 6.7, Kibana introduces its first localization, and is now available in Simplified Chinese. This marks the beginning of a broader Kibana localization effort. In addition to the launch of Simplified Chinese interface, Kibana 6.7 also introduces a new localization framework to provide support for additional languages in the future. This localization framework also gives Elastic community members access to the necessary tooling to add their own custom translations.
Get details about all Canvas GA, localized Kibana, and other Kibana 6.7 features in the detailed Kibana 6.7 announcement post.
Beats
Functionbeat is GA
Functionbeat is a new kind of Beat that deploys as a function in serverless computing frameworks, and streams cloud infrastructure logs and metrics into Elasticsearch. It was introduced as a beta in version 6.5, and is now graduated to GA status in version 6.7. Functionbeat currently supports the AWS Lambda framework, and can stream data from CloudWatch Logs, SQS, and Kinesis.
Read about Functionbeat and other Beats 6.7 updates in the Beats release blog
Logs & Infrastructure Solutions are now GA
Infrastructure and Logs solutions were both introduced as beta features in version 6.5. We are excited to graduate them to GA status.
The Logs solution provides users with real-time log tailing in a compact, customizable display. It's similar to tailing a file, but with the ability to see the logs from all your infrastructure in a single streaming view. And with an embedded search bar powered by Elasticsearch, users can easily narrow the streaming view to just the logs they are looking for.
The Infrastructure solution gives users a bird's eye view of the health of all the components - servers, Kubernetes pods, Docker containers - in their infrastructure, making it easier to diagnose problems using log and metrics data. Building on the autodetect capabilities of Metricbeat, the tailored user interface allows you to interactively view and drill into the logs, metrics, and APM traces with a single click.
Get ready for 7.0 with the Upgrade Assistant
7.0.0 is coming soon (you can check out the beta here). The Upgrade Assistant in 6.7 is here to help you prepare your existing Elastic Stack environment for upgrade to 7.0. The Upgrade Assistant, which includes both APIs and UIs, is an important cluster checkup tool to help plan your upgrade, and identify things like deprecation warnings, indices that need to be upgraded or reindexed, and much more to enable a smoother upgrade experience.
Try it now
Deploy a cluster on our Elasticsearch Service or download the stack to take these latest features for a spin.