Beat the holiday rush with Elastic Observability


 Share on Twitter
Share on Twitter

 Share on LinkedIn
Share on LinkedIn

 Share on Facebook
Share on Facebook

 Share by Email
Share by Email

 Print this page
Print
September is here, and that means many retailers have already begun preparing for the upcoming holiday season. One weekend in particular tends to be the real-life stress test that companies have come to develop a love-hate relationship with: Cyber Weekend. Or more specifically, Black Friday, Cyber Monday, and the weekend in between.
In this article, we will cover how Elastic Observability can be leveraged to provide the data insights needed to prepare for and react to the holiday rush of traffic that will be hitting ecommerce infrastructure around the globe in just two short months. If this is the first time you’re reading about Elastic Observability, my colleague Paul Smalera, wrote a fantastic article that provides a complete overview of the solution.
Read on and learn how Elastic Observability can help you track the health of your systems via Uptime metrics and Application Performance Monitoring (APM). You’ll also learn about ways to gauge how well your site is performing with the Real User Monitoring (RUM) capability and then use Elastic’s machine learning capabilities to detect and be alerted on anomalies.
The importance of being prepared for the holiday crush
When we think of observability in the context of the holidays, what type of data is most important? Infrastructure health? Revenue and conversion rates? Application or website performance? Security? Depending on who you ask, it could be any one of those or even all of them!
The executive team will certainly care about how sales are performing, especially because with the exception of 2021, online sales during cyber weekend have grown roughly 18% year over year since 2014. However, there have also been a fair share of site issues and outages that can affect sales numbers and cause headaches. Having the ability to report and act on this type of data is critical to the success of Cyber Weekend and the holidays in general.
A common challenge many retailers face is the data they need may exist in multiple systems across multiple vendors. To add to the complexity, these systems may be managed by different teams who may not talk to one another. The data could exist in a datacenter that’s on-premises, in the cloud, or in a hybrid cloud model. Sales and order data may be collected and managed by the business team, web performance data may be monitored by the digital team, and infrastructure health could be tracked somewhere entirely different. But what happens if you want to combine some (or all) of these into a single executive summary for your leadership team? Enter: Elastic Observability.
By consolidating your data, Elastic Observability can help you easily answer the following important questions in real time from a single interface:
- How well are my infrastructure and workloads performing?
- When can I expect to begin experiencing issues?
- How well is my website or application performing for end users?
- How successful have sales been throughout the holidays?
- Are we collecting all of the necessary metrics and logs to diagnose any issue?
As we dive into the capabilities of Elastic Observability below, keep those questions in mind. And as always, Elastic Consulting is here to help.
Infrastructure metrics and insights
Depending on where your infrastructure is located, it can be challenging to create a single view into your entire stack. Uptime reports may be fed back to a centralized system, but what about application, web, and database logs, performance metrics, security data, CPU and memory usage for on-premises and cloud systems, Kubernetes metrics, etc.? The list goes on and on.
These types of infrastructure data can live in any number of systems, which may require a large effort to manually consolidate and report on. Fields used across those systems can contain similar values but be named differently (for example, client.ip vs. client.ip-address). This creates a challenge of reporting on data across multiple systems or you’ll end up with duplicate data. Going further, if an issue were to present itself, how many systems need to be updated and configured to alert the appropriate teams?
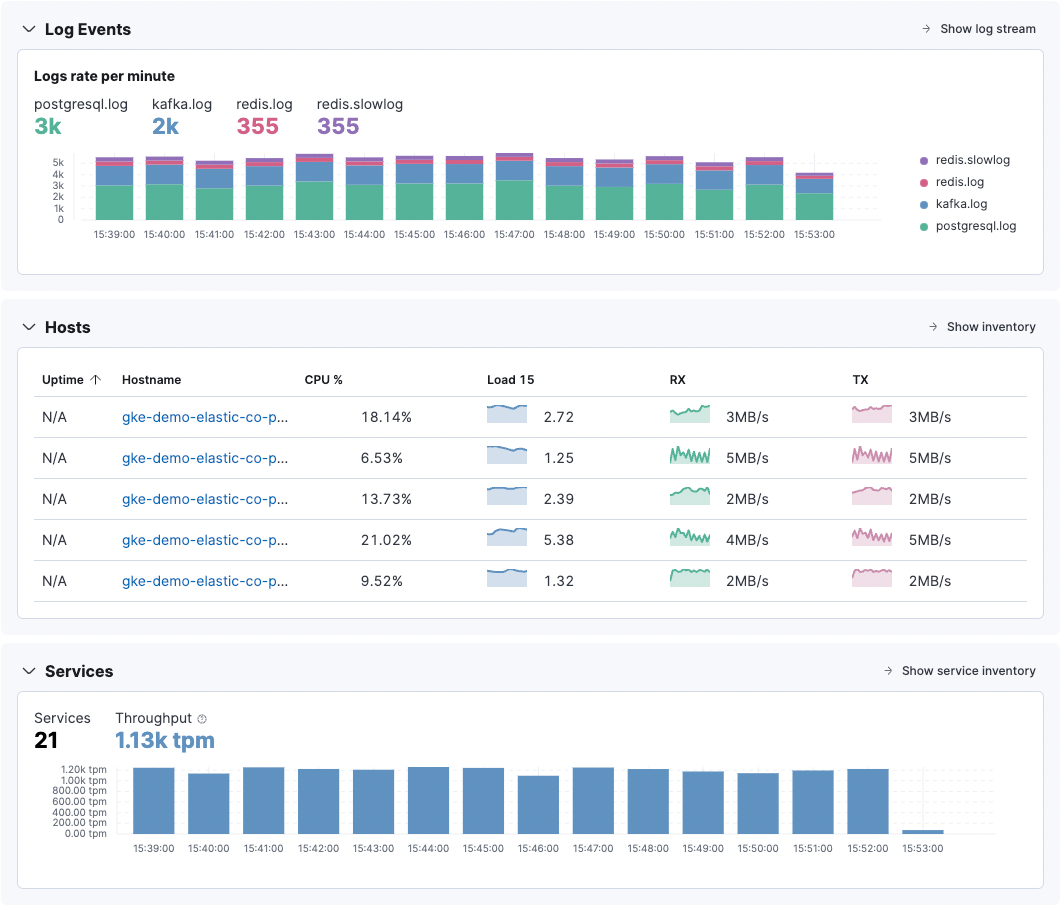
Utilizing the Elastic Agent, you can easily collect all types of data from anywhere or from any system with a single, unified agent per host. This means one agent to install, configure, and scale to collect all of the data you need. With out-of-the-box components for many popular services and platforms, including dashboards, visualizations, and ingest pipelines for extracting structured fields, you can easily consolidate all of the data from your systems into Elastic to provide you with the insights you need to be ready for the holiday season.
Performance under stress
A critical preparation step nearly all major retailers take prior to the holiday season is load testing. Load testing allows teams to understand just how much stress their infrastructure can withstand before starting to redline and experience performance degradation. The last thing retailers want is to be featured in the news for a site outage or poor performance.
While most load testing providers will supply their own report on the results of their tests, it’s important to also have that data available in your own systems so you have a baseline to refer back to, as well as your “redline statistics” to know when or if you are approaching your system’s breaking point. In my previous role at Akamai, a content delivery network, I wrote extensively regarding how to prepare for stress tests and other important questions that should be addressed to help prepare for the holidays, which may be of interest.
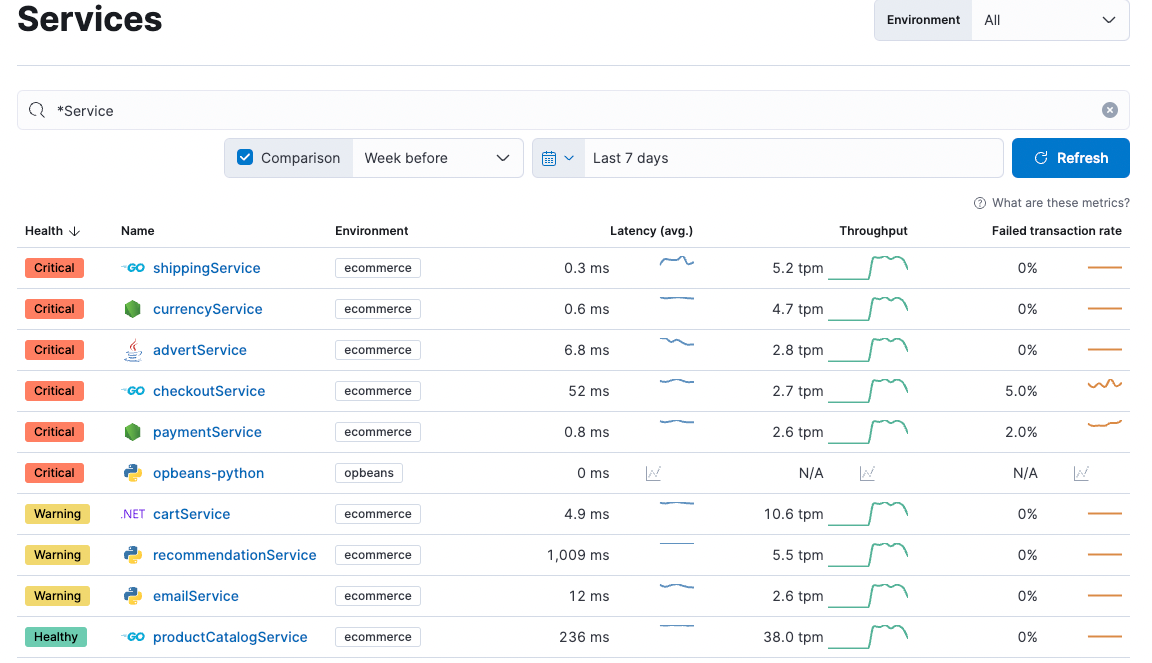
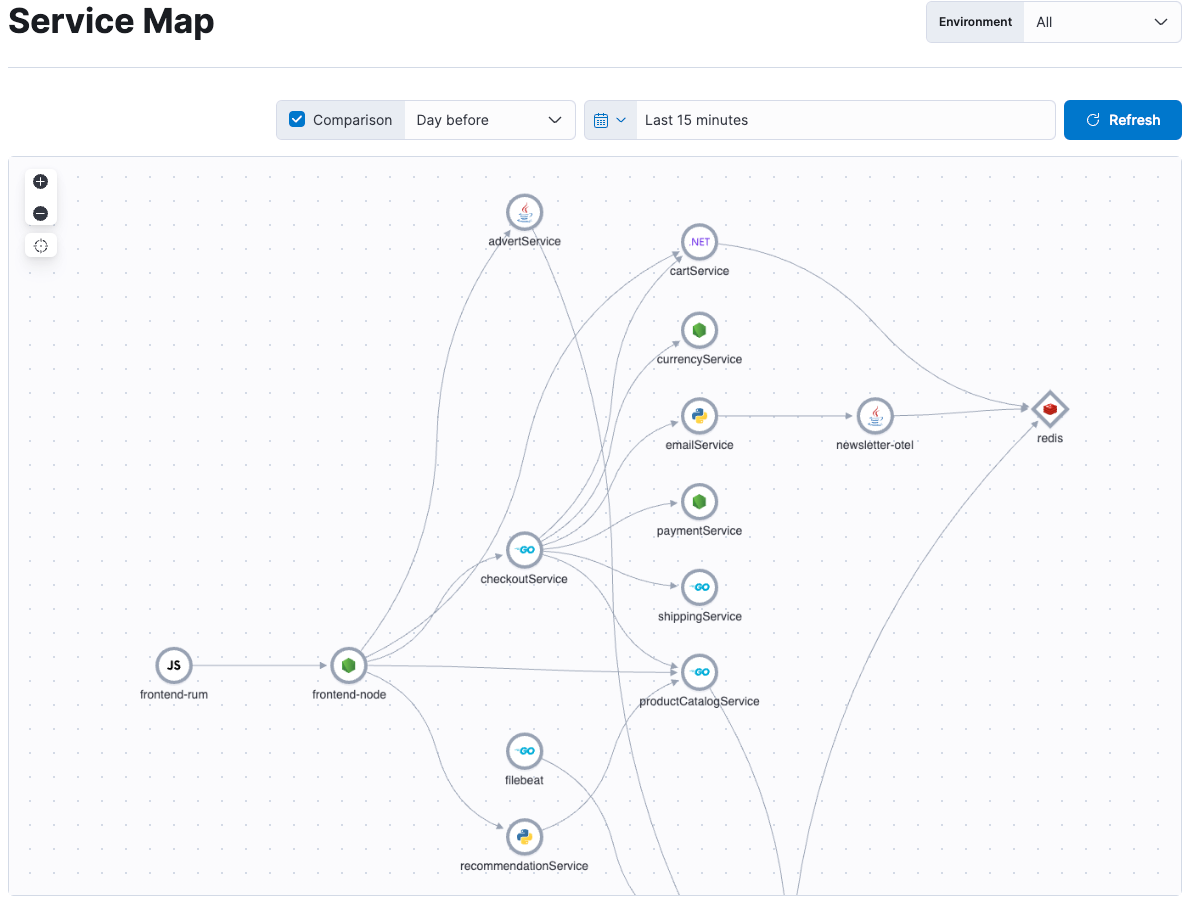
Leveraging Elastic Observability features like log monitoring, metrics, and APM, you’re able to gather the insights you need in a single dashboard to monitor how well your web application and databases are performing under load. APM will allow you to easily view the metrics of all of your running services (latency, throughput, failed transaction rates), as well as view how traces are performing as requests make their way through your infrastructure. Using Dependencies and the Service Map, you’ll be able to quickly identify performance bottlenecks within your infrastructure so they can be addressed as well.
Measuring real user experience
A critical component that should be part of every retailer’s observability strategy is measuring how well their site is performing for real users. While APM data can certainly be a great indication of overall performance and health, real user monitoring (RUM) data will show you exactly what your end users are experiencing in the browser in real time. As cliche as it sounds, you don’t get a second chance to make a first impression, so it’s imperative that your site is performing to the best of its ability, especially during the holiday season when many retailers are running similar doorbuster sales and discounted deals.
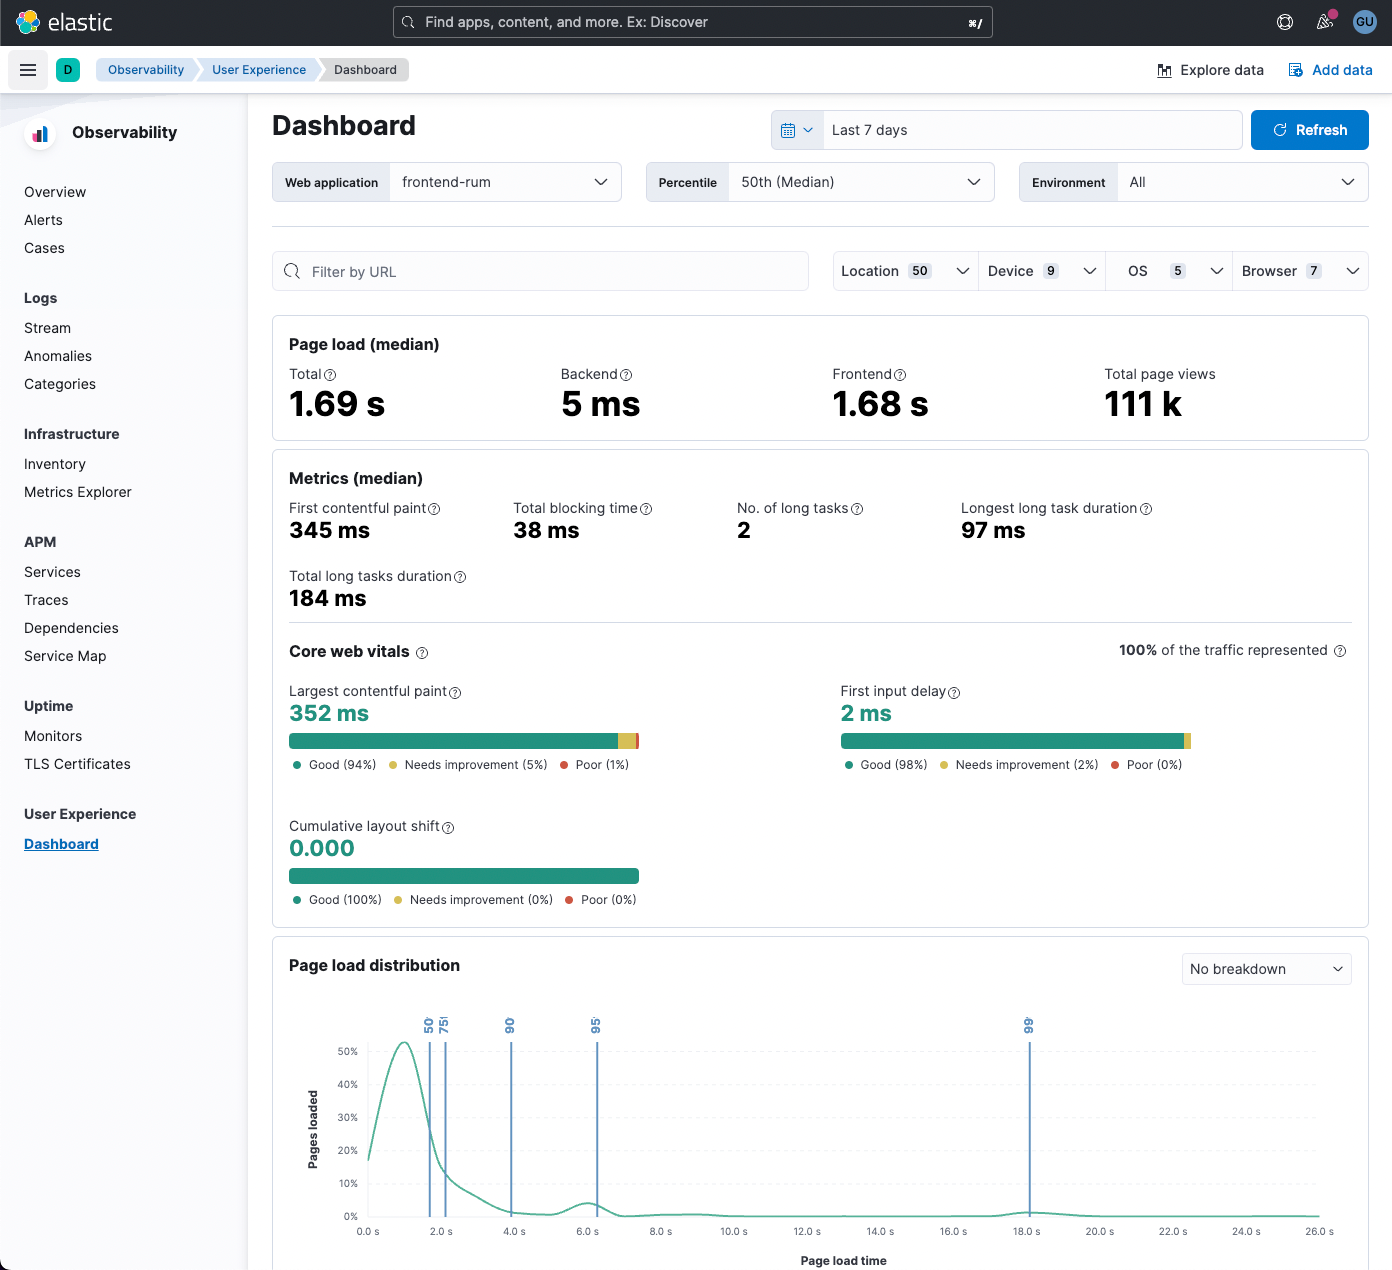
Elastic Observability’s User Experience dashboard is a great way to quickly gauge what your end user’s experience is like across any combination of locations, devices, operating systems, or browsers. With the ability to report on Core Web Vitals, you can easily see how well your site is performing and if your Largest Contentful Paint or Cumulative Layout Shift metrics need to be addressed (Hint: these metrics matter!). User Experience can be easily enabled via the APM RUM agent or with a few lines of JavaScript. Check out our demo site and take a look for yourself.
The value of visualizing business metrics with IT operational data
In the sections above, we’ve talked a lot about how you can monitor your infrastructure’s health, how it performs under stress, and how to gain insights into the performance your end users are experiencing. Given that Elasticsearch can ingest any kind of log data from any system, that provides the ability to ingest business metrics as well, such as sales data, conversion metrics, and more. And here’s the kicker: You can combine it all on a single dashboard!
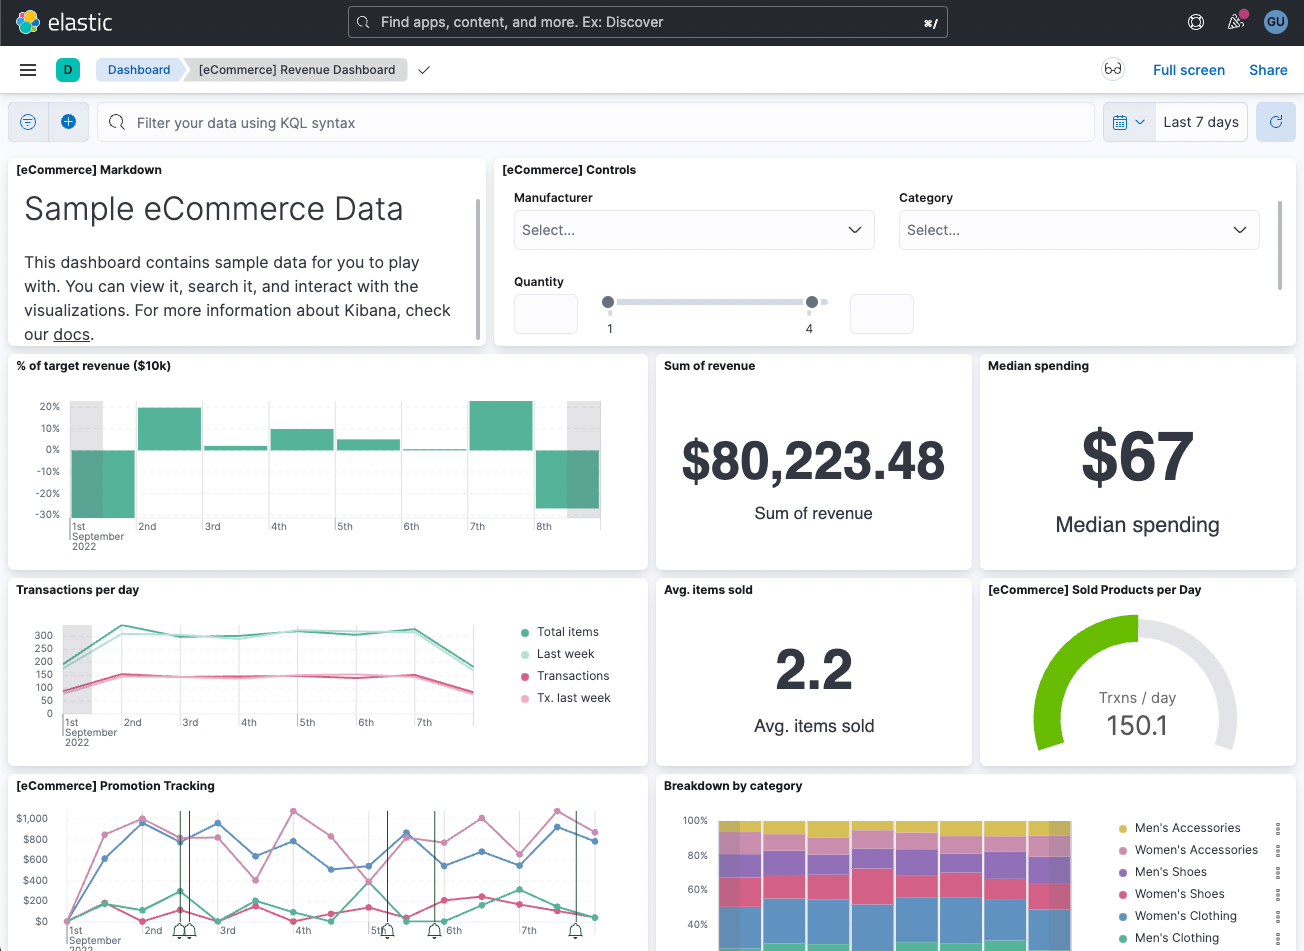
Why is this important? Not only for consolidation purposes, but also because the faster a website is, the more revenue it typically generates. By combining performance data and business metrics into a single dashboard, you can easily determine how your end users react while deploying new features or running A/B tests. More importantly for the holidays, you can tie in business metrics as well as pertinent performance metrics for the executive team to have one view to gauge how cyber weekend and the holidays are performing.
Pro tip: With Canvas, you can create beautiful visualizations to display real-time statistics or use it to provide a post-event summary report/infographic.
Alerting and monitoring
Last, but certainly not least, is alerting and monitoring. With many moving parts and multiple teams working to ensure that the holiday season is a success, it can be challenging or nearly impossible to continually have eyes on dashboards to ensure your systems are healthy. What can complicate things even further is having your alerts and monitoring capabilities spread out among multiple vendors that each have their own way of doing things.
The beauty of being able to ingest any kind of log data into Elasticsearch means that you can alert on all of that data in a single system. The alerts can be sent to many popular vendors, such as IBM QRadar, ServiceNow, PagerDuty, Slack, JIRA, Microsoft Teams, and more for incident management. You can easily set up a webhook to send the alerts to your own custom endpoints or simply use email, if that’s what you prefer.
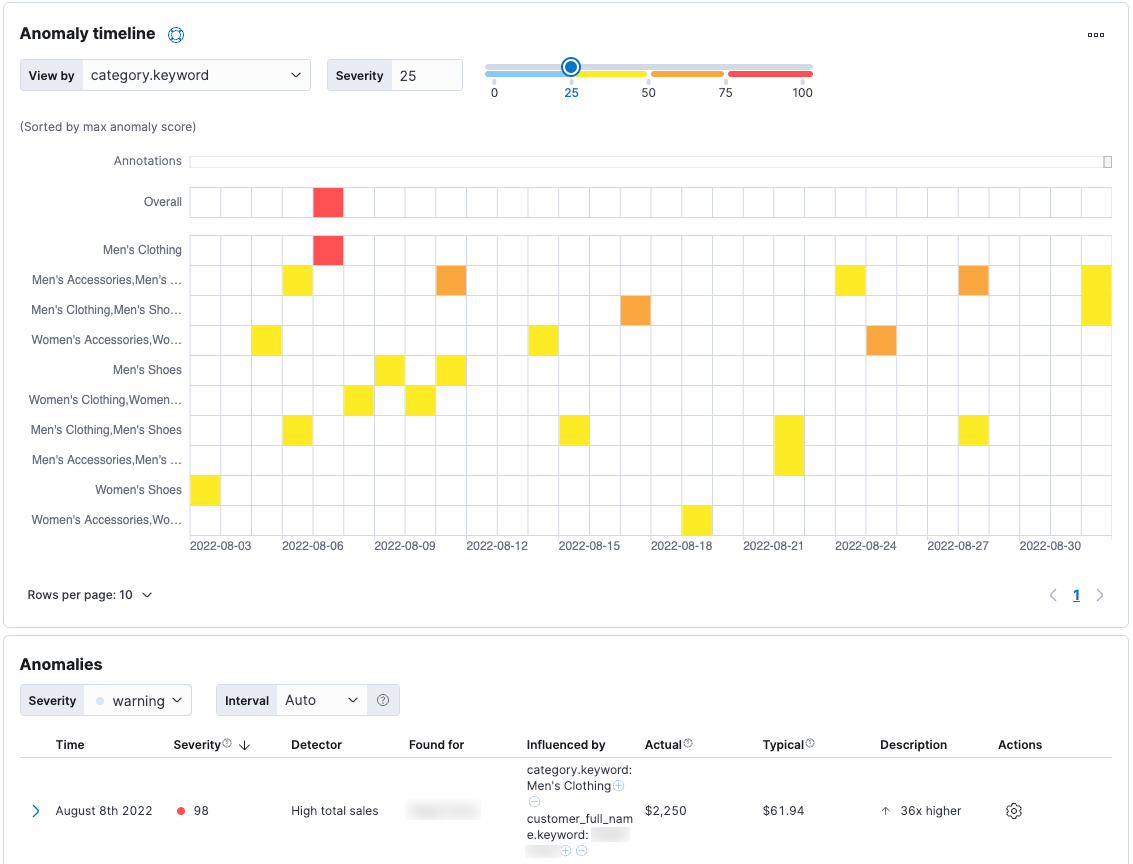
Not only can you set specific thresholds to trigger alerts (for example, HTTP requests too high or too fast, CPU breached a utilization limit), but you can leverage Elasticsearch’s machine learning capabilities to automatically detect and alert your team of anomalous behavior without needing to determine what thresholds to set. Leveraging Elastic’s proprietary machine learning algorithms, you can easily detect things like temporal deviations in values or counts, sales originating from unusual geographic locations, statistical rarities, and more.
Help is here for the holidays
As we inch closer to Cyber Weekend and the holidays in general, it’s important to know that you don’t have to be alone in all this while preparing for the inevitable rush of traffic. This time of year is usually stressful with many moving parts and it may be too difficult for a team to find the time and resources to check off all of the boxes.
With the expertise of Elastic’s Consulting and Advisory Services teams, we’re here to help guide you along and put the right plan in place to ensure you have the insights you need for a successful holiday season. Wishing you all the best!
Share
- Share on Twitter
Share on Twitter
- Share on LinkedIn
Share on LinkedIn
- Share on Facebook
Share on Facebook
- Share by Email
Share by Email
- Print this page
Print