Dependencies
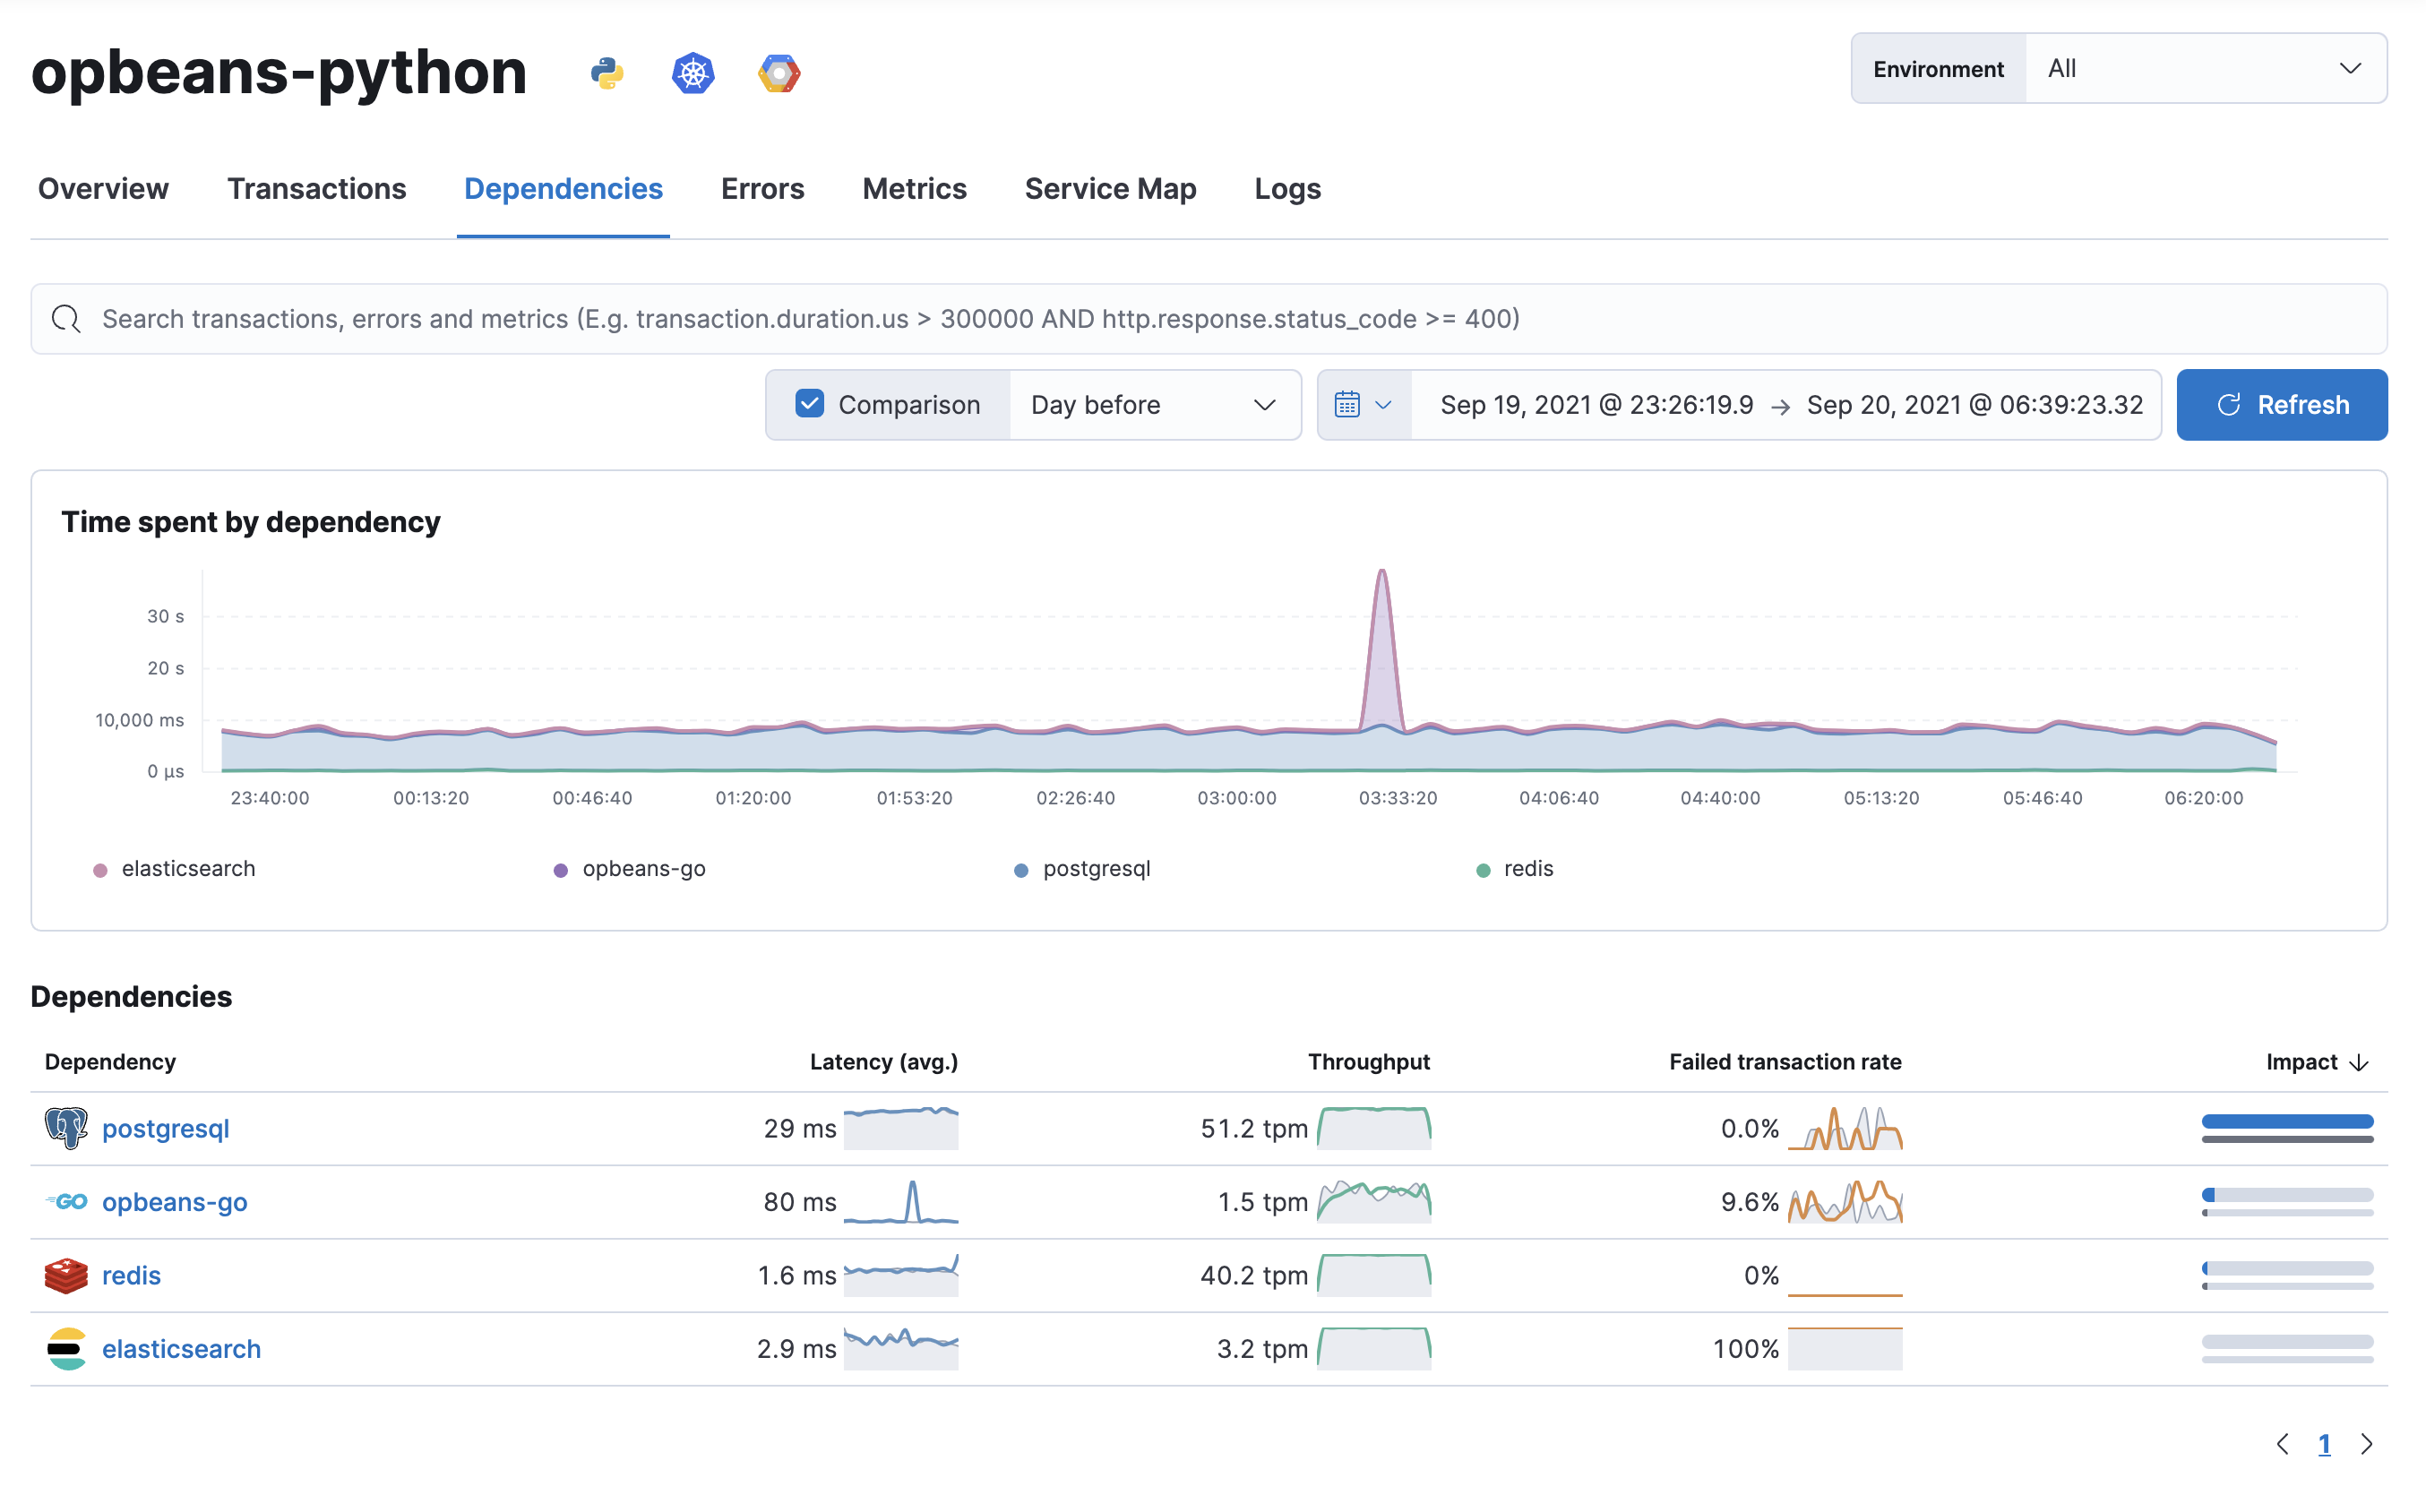
APM agents collect details about external calls made from instrumented services. Sometimes, these external calls resolve into a downstream service that’s instrumented — in these cases, you can utilize distributed tracing to drill down into problematic downstream services. Other times, though, it’s not possible to instrument a downstream dependency — like with a database or third-party service. Dependencies gives you a window into these uninstrumented, downstream dependencies.

Many application issues are caused by slow or unresponsive downstream dependencies. And because a single, slow dependency can significantly impact the end-user experience, it’s important to be able to quickly identify these problems and determine the root cause.
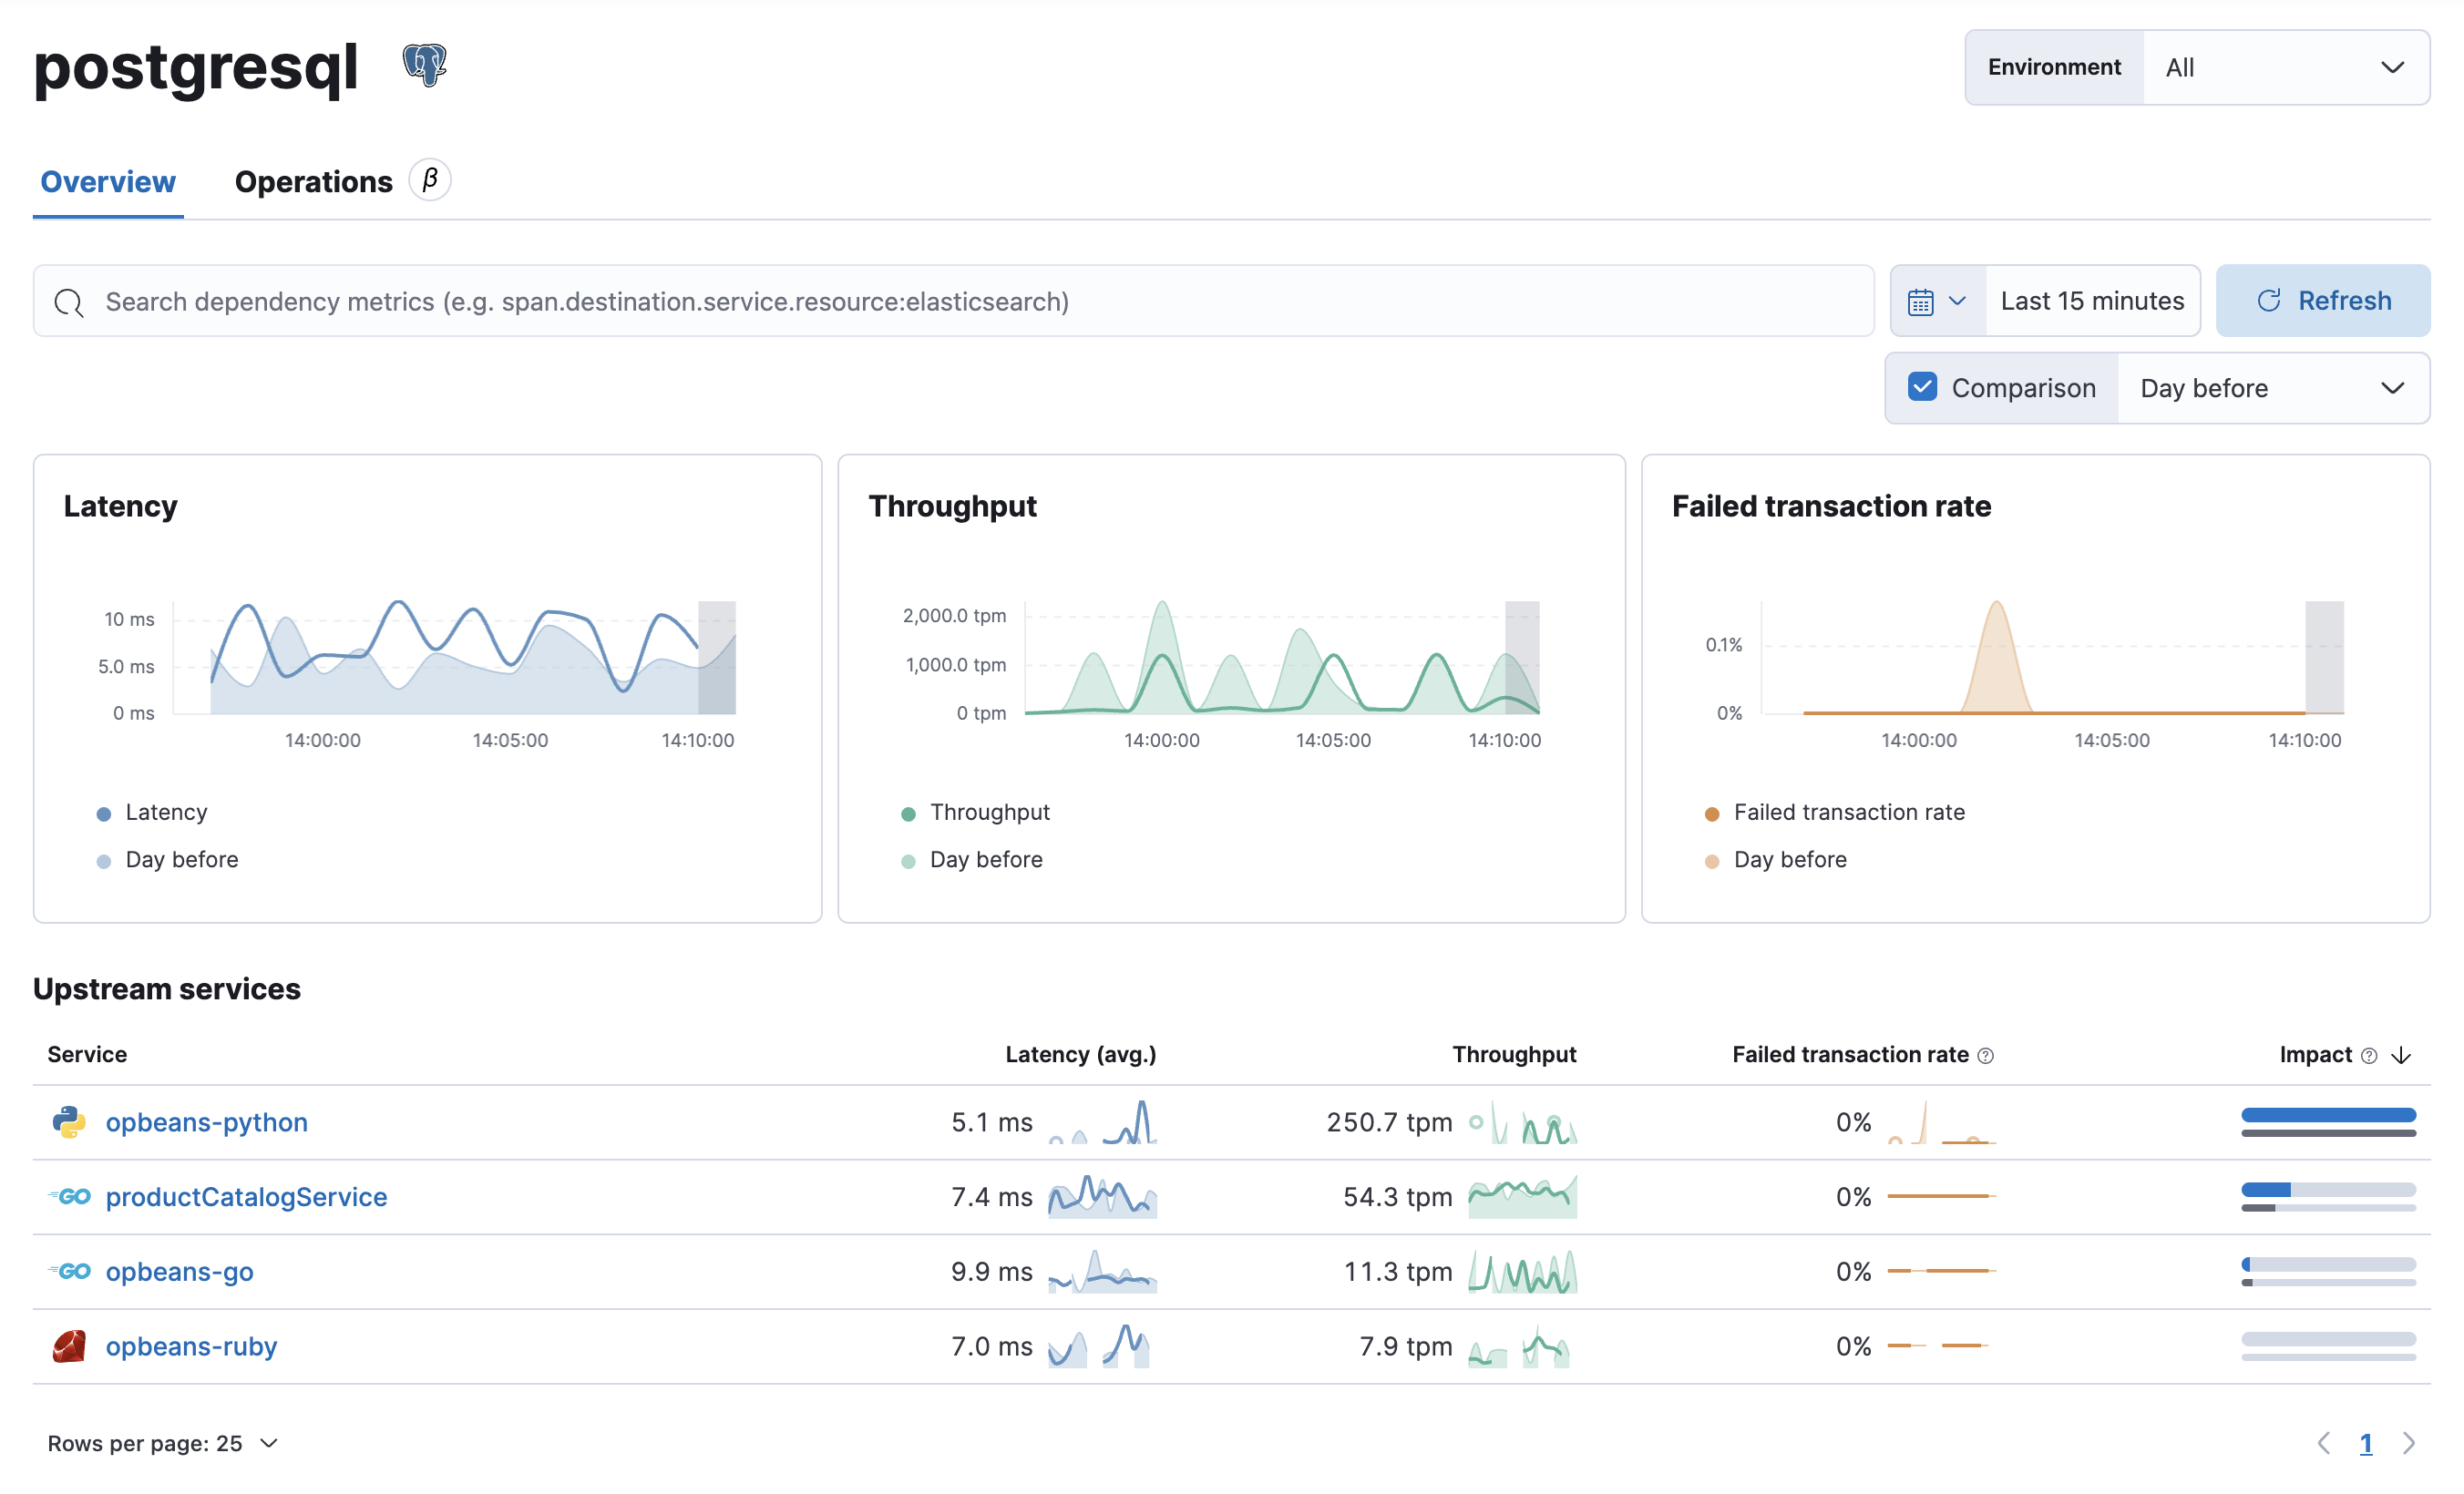
Select a dependency to see detailed latency, throughput, and failed transaction rate metrics.

When viewing a dependency, consider your pattern of usage with that dependency. If your usage pattern hasn’t increased or decreased, but the experience has been negatively affected—either with an increase in latency or errors—there’s likely a problem with the dependency that needs to be addressed.
If your usage pattern has changed, the dependency view can quickly show you whether that pattern change exists in all upstream services, or just a subset of your services. You might then start digging into traces coming from impacted services to determine why that pattern change has occurred.
The Dependency operations functionality is in beta and is subject to change. The design and code is less mature than official generally available features and is being provided as-is with no warranties.
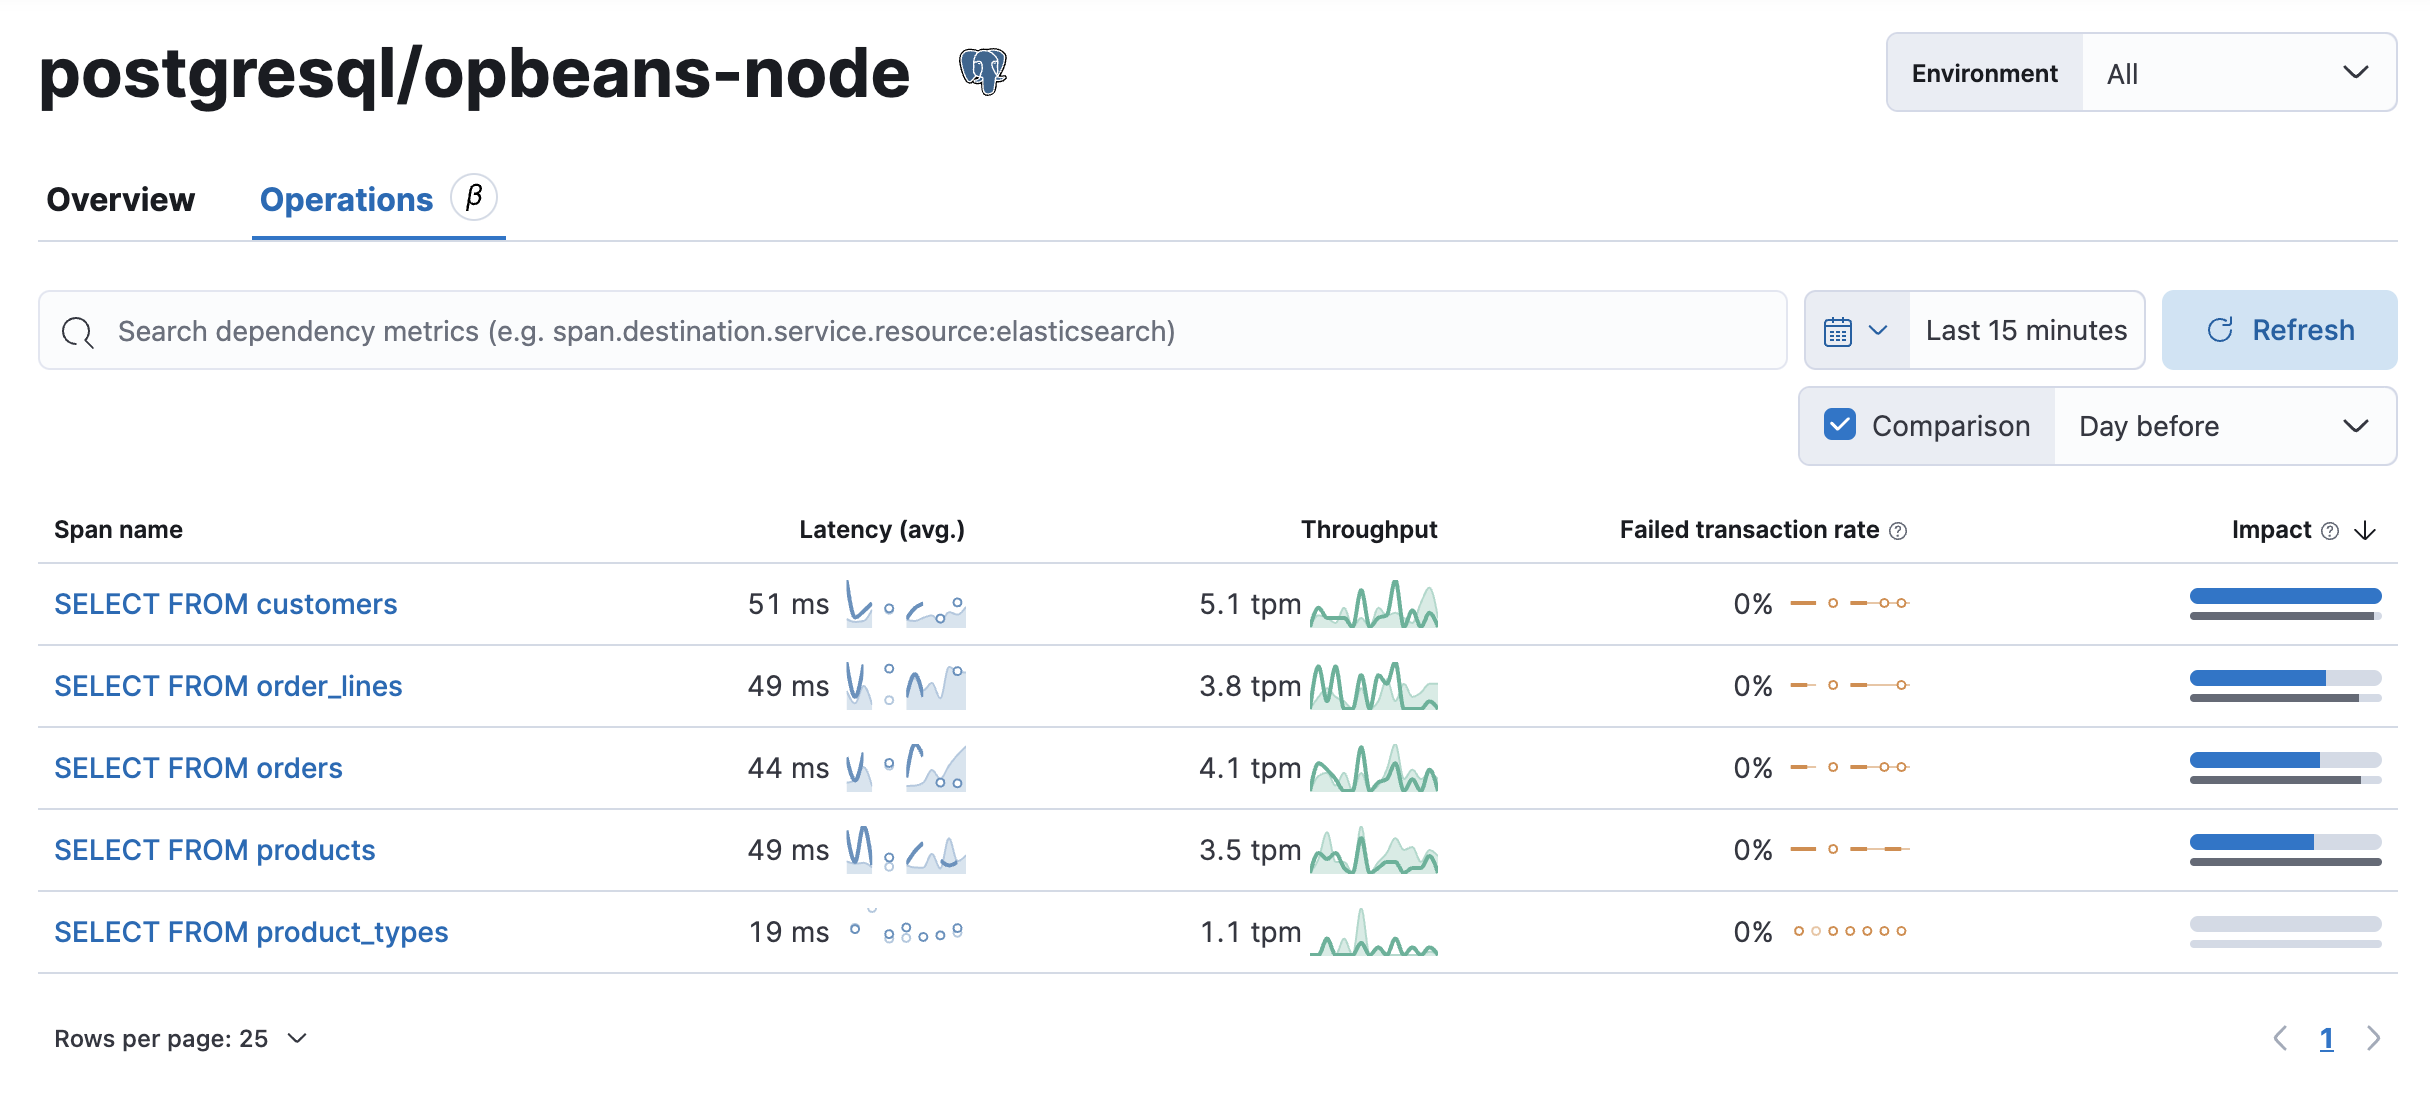
Dependency operations provides a granular breakdown of the operations/queries a dependency is executing.

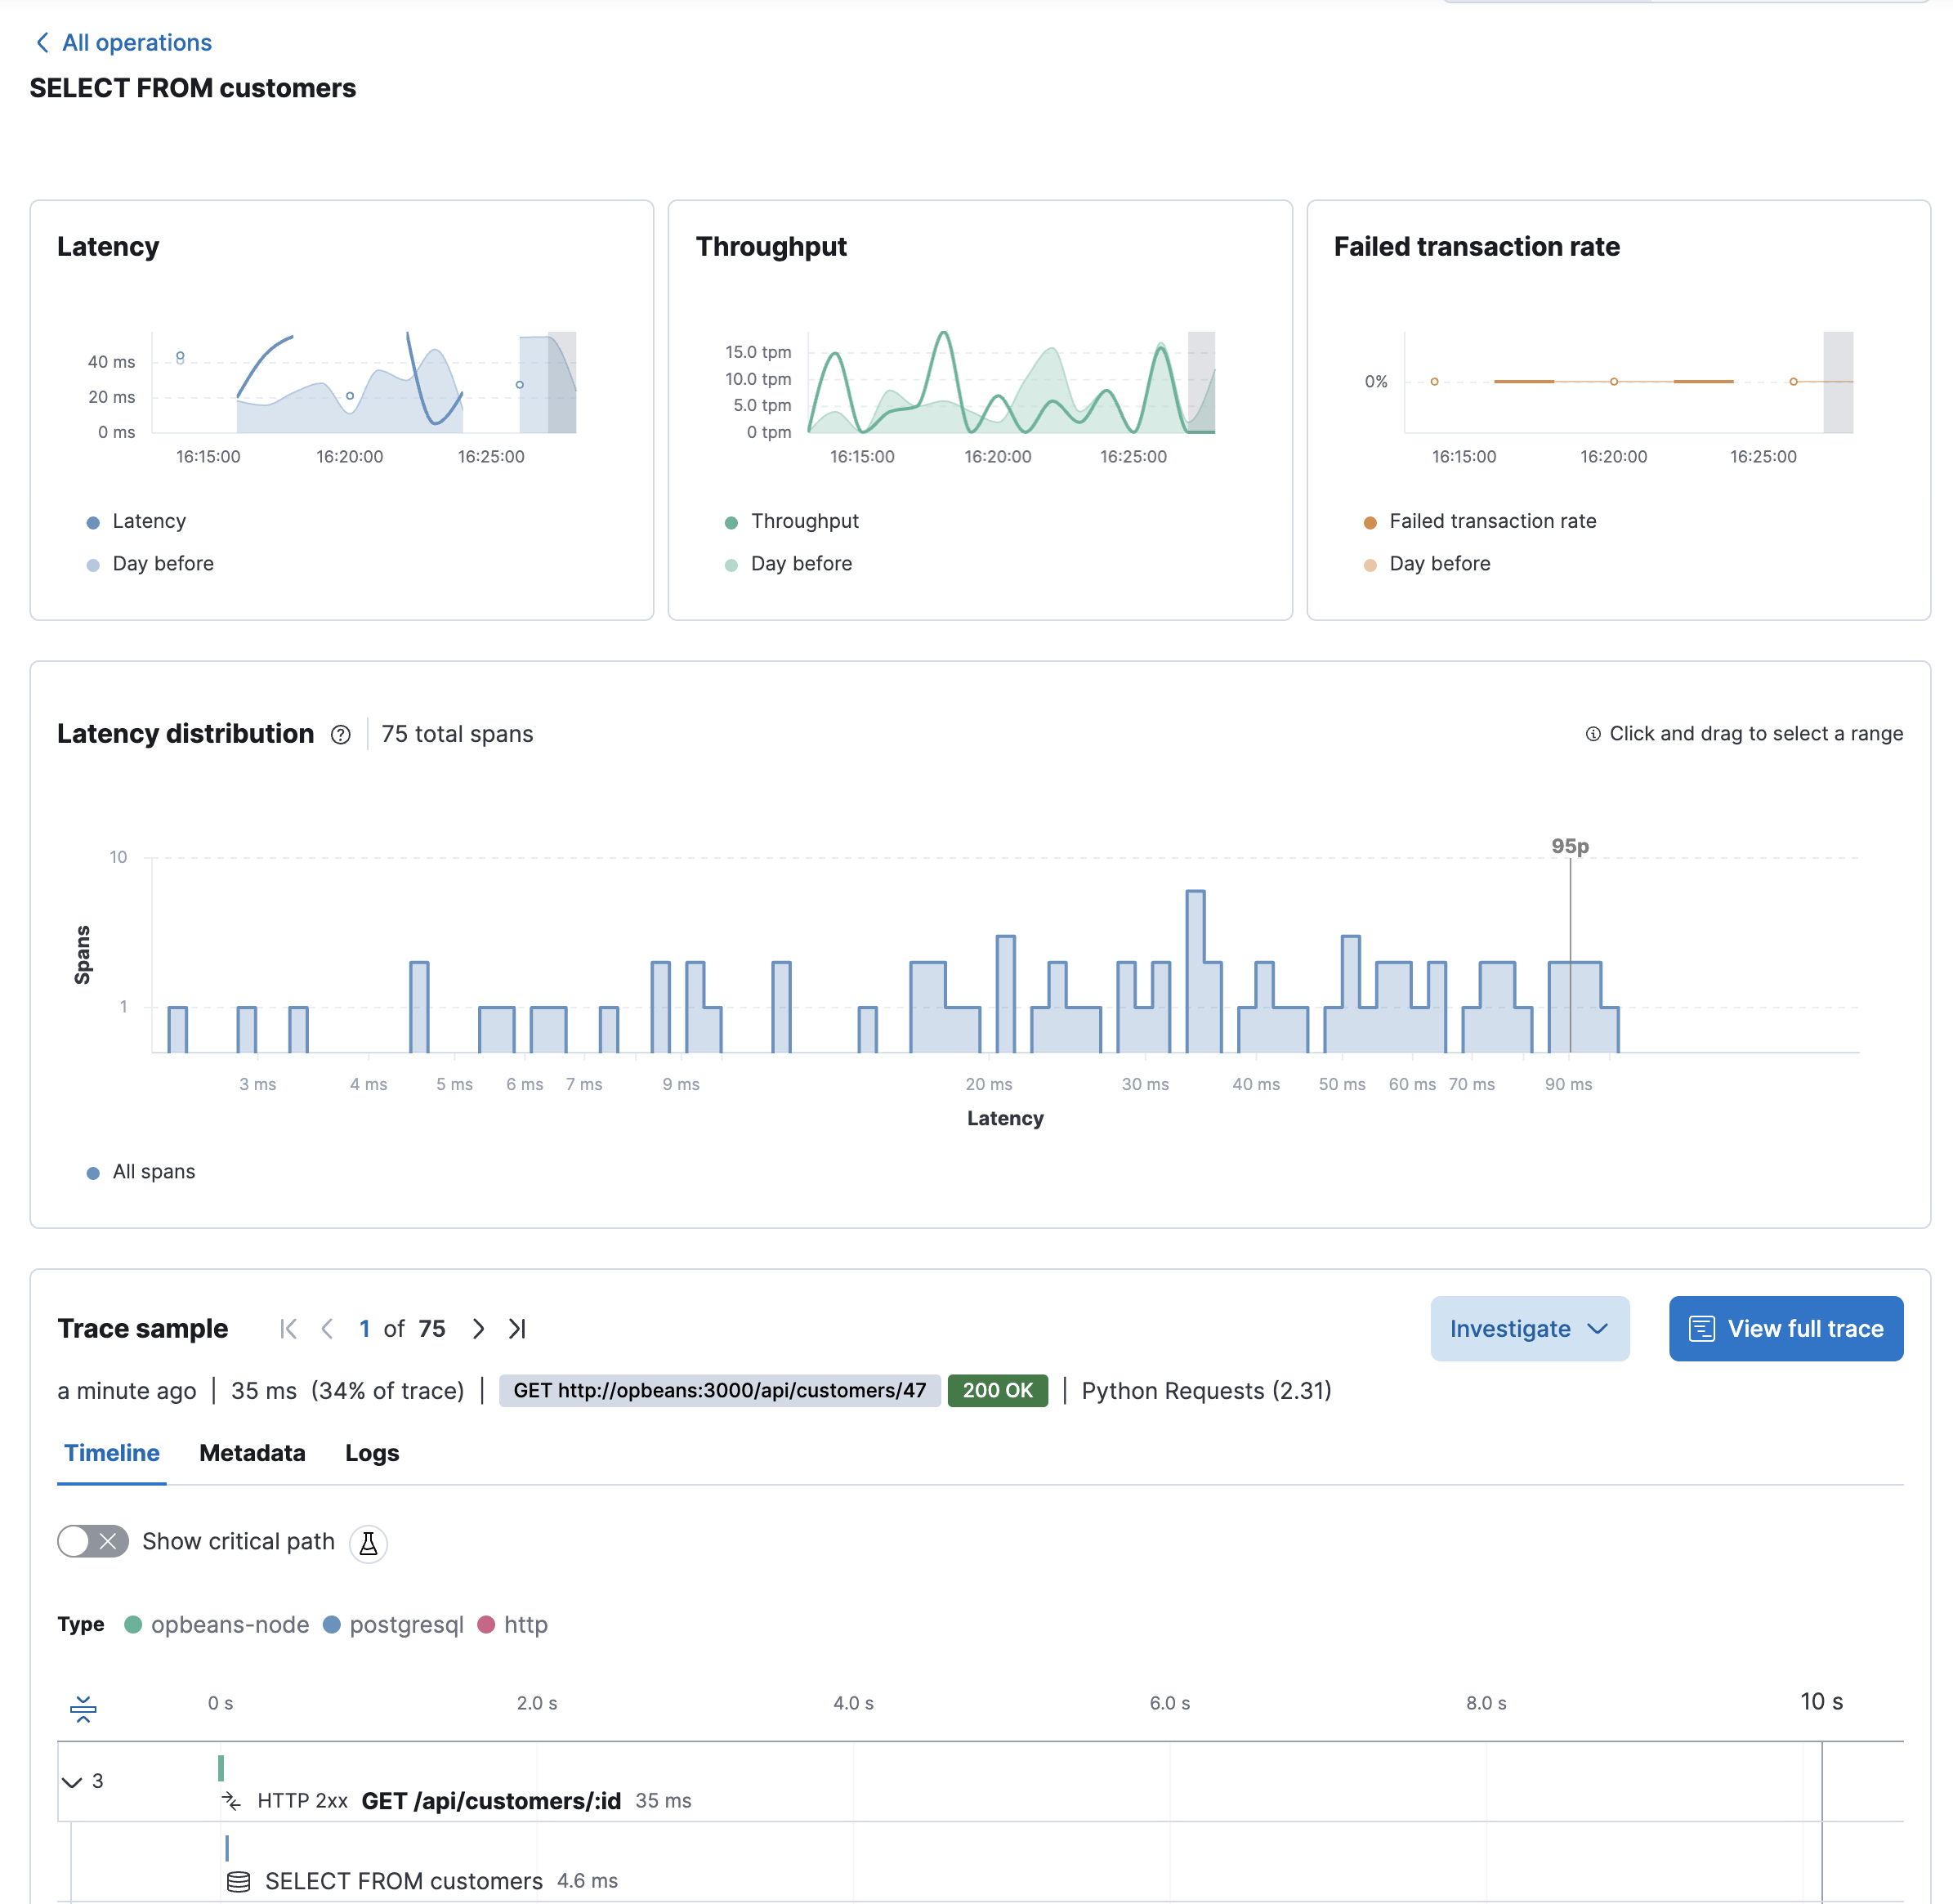
Selecting an operation displays the operation’s impact and performance trends over time, via key metrics like latency, throughput, and failed transaction rate. In addition, the Trace sample timeline provides a visual drill-down into an end-to-end trace sample.
