How to activate APM in Kibana and Elasticsearch to gain next-level alerting insights


 Share on Twitter
Share on Twitter

 Share on LinkedIn
Share on LinkedIn

 Share on Facebook
Share on Facebook

 Share by Email
Share by Email

 Print this page
Print
Kibana alerting has been around for quite some time, and major work is going on to give you better views into what each rule is doing and where it’s spending its time.
However, there are always questions left, where you just want more. Maybe you are an SRE at a company and need to look over hundreds of clusters. Our built-in dashboards might not suffice, as you need a more granular approach.
Good news! We have been working internally to improve the insights you can gather with APM in Kibana®. Simply activate APM for Kibana with a few configuration steps. This will enable Kibana Real User Monitoring (RUM) and Kibana itself. Additionally, you can opt-in to activate Elasticsearch® instrumentation and get a deeper understanding of where Elasticsearch is spending its time.
If you're interested in gathering usage data from your Kibana users, we have a blog post that can provide helpful tips. Check out our article on identifying Kibana optimizing potential.
Activating internal APM
Before starting, you need your own APM server. That can either be a standalone APM server or the APM integration using Fleet. Activating the Kibana instrumentalization is relatively easy. You must add those three config lines to your Kibana.yml or Cloud console. If you want further information, take a look at the docs.
elastic.apm.active: true
elastic.apm.serverUrl: url of the APM server
elastic.apm.secretToken: Token that the APM server exposesIt will restart Kibana, and after that, you should see multiple services popping up. One is called kibana-frontend and the other one kibana.
Activating tracing in Elasticsearch is done with static settings (configured in the elasticsearch.yml) and dynamic settings, which can be toggled during runtime using a PUT _cluster/settings command, where one of those dynamic settings is the sampling rate. Some settings, like the sampling rate, can be toggled during the runtime. In the elasticsearch.yml we want to set the following:
Valid for Version 9.x
telemetry.agent.enabled: true
telemetry.agent.server_url: "url of the APM server"Valid for Version 7.x and 8.x
tracing.apm.enabled: true
tracing.apm.agent.server_url: "url of the APM server"The secret token (or API key) must be in the Elasticsearch keystore. The keystore tool should be available in <your elasticsearch install directory>/bin/elasticsearch-keystore using the following command for version 7.x and 8.x.: elasticsearch-keystore add tracing.apm.secret_token or tracing.apm.api_key. For version 9.x please use telemetry.secret_token or telemetry.api_key instead. After that, you need to restart Elasticsearch. More information on tracing can be found in our tracing document.
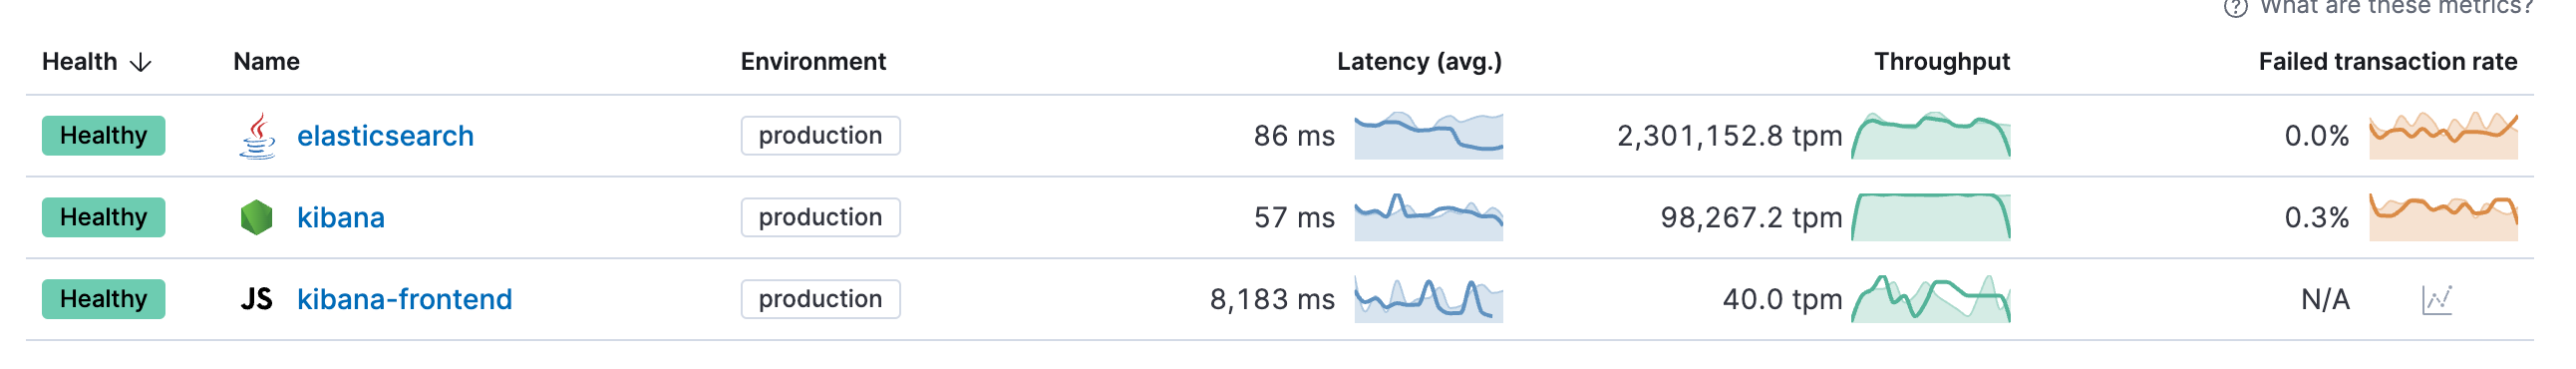
After that, we should see three services kibana, kibana-frontend, elasticsearch.
First steps
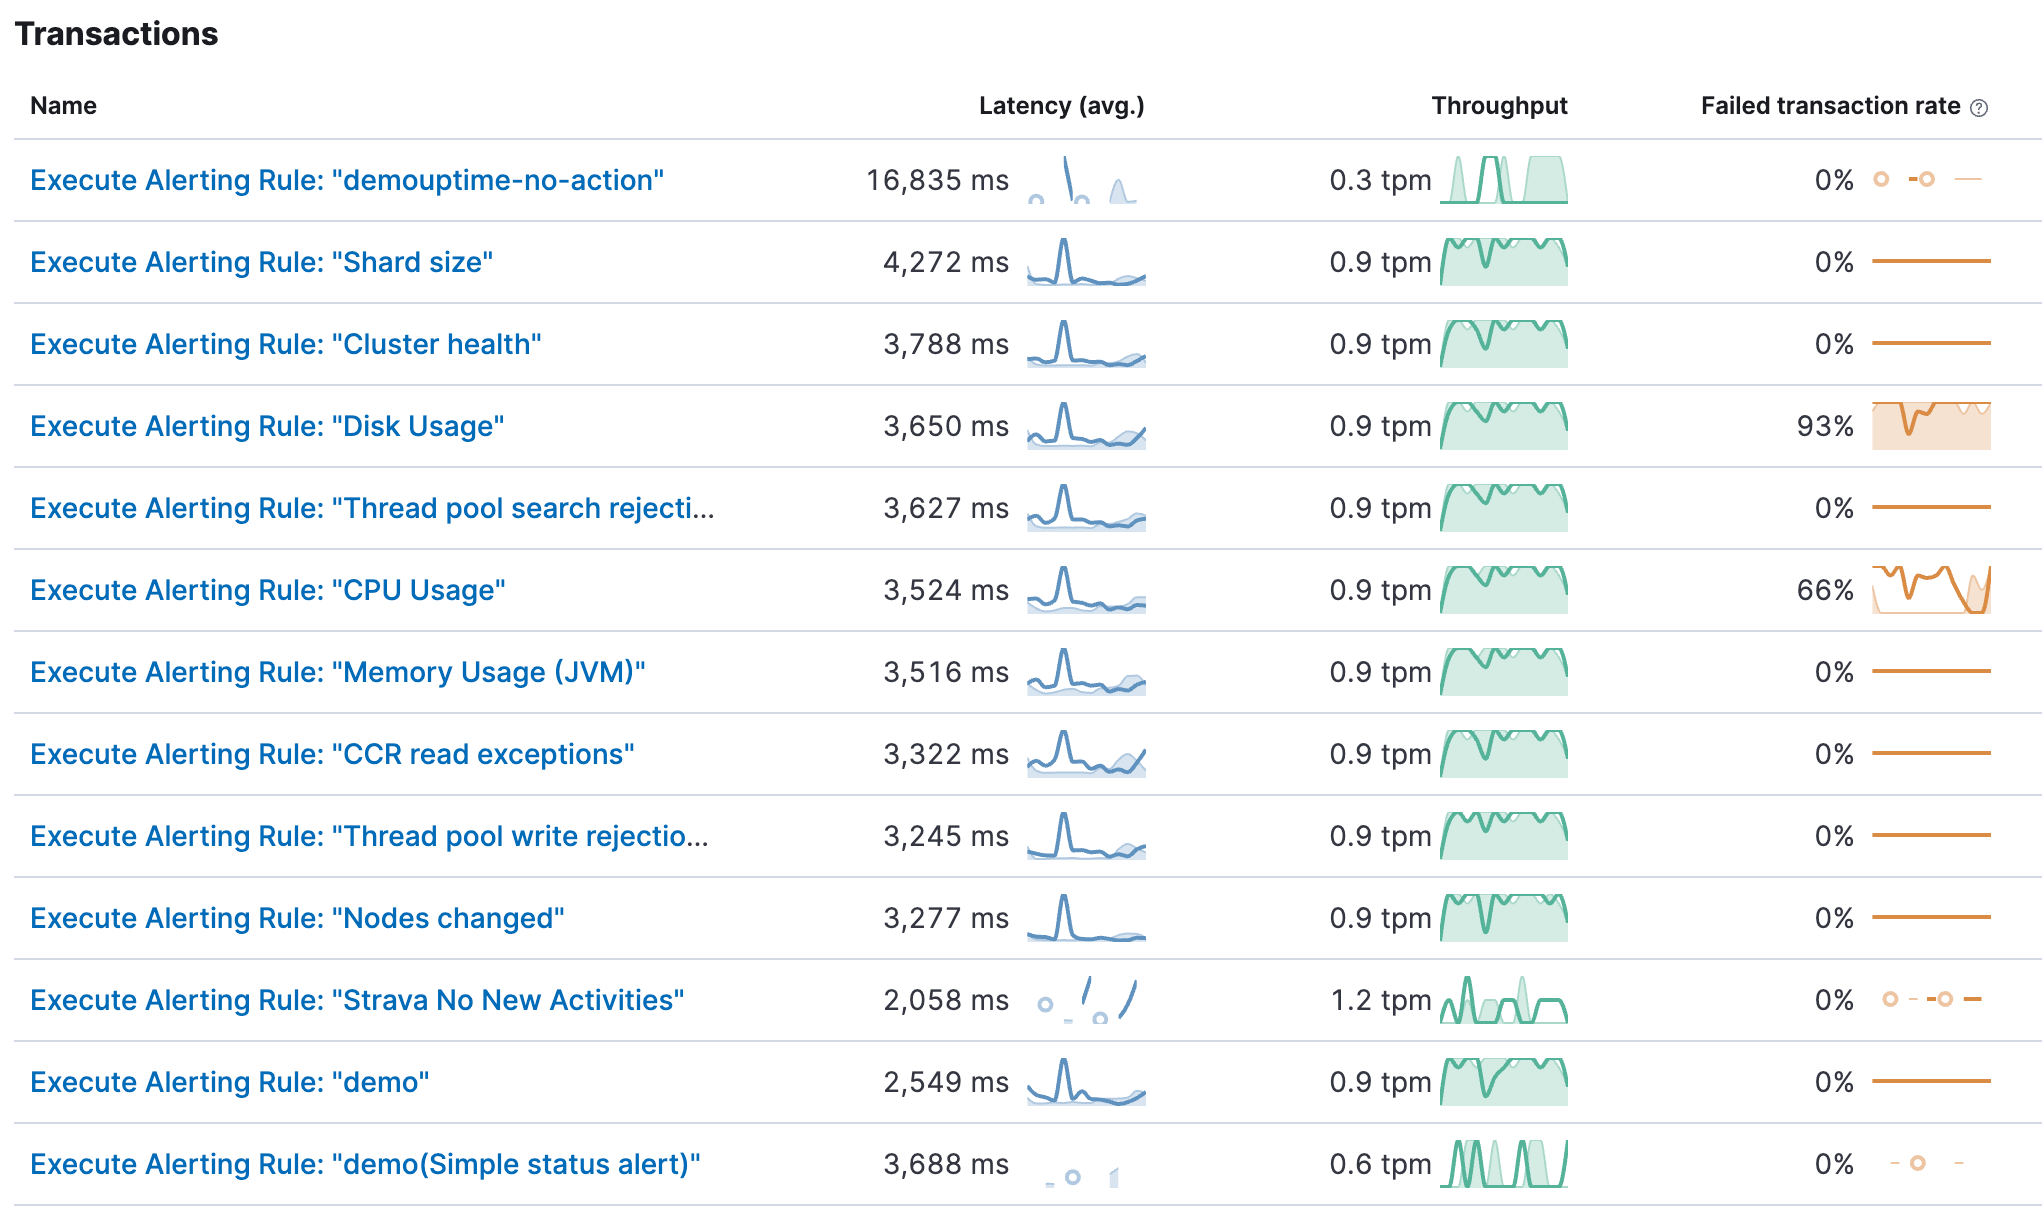
We want to analyze what is happening behind the scenes when Kibana executes a rule. Click on Kibana and change the transaction.type to task-run. It is usually set to request and can be found in the top left corner. All tasks, such as alerting rules, are under this task-run type. There are many different transactions, so it’s best to explore them. Click on view transactions to see a list of all transactions. The name of each transaction is stored in transaction.name. You should immediately recognize that the tasks have distinguishable names such as Execute Alerting Rule: “Disk Usage”. The transaction name derives from the following: Execute Alerting Rule: “Rule Name”.
There are quite a lot in my cluster. You will see the name, and the latency (avg.) tells you the average latency of the entire rule when the rule is started by Kibana, doing all searches, processing the data and creating, if necessary, an alert as well. The throughput is determined mostly by the interval of the rule. If it runs every second, I would expect it to be at 60 transactions per minute. The failed transaction rate showcases all rules that have had any failures. It could be due to various issues — maybe the index does not exist, you don’t have enough permissions to query the index, and many more.
Let’s look at the Strava No New Activities.
Going in depth
The Strava No New Activities is a simple ES Query style Kibana Rule. It is configured inside the Strava space, and it runs every minute and checks whether there is more than one new document inside the strava* index for the last 72 hours. If that is not the case, it will send me an email telling me to work out more. If you are interested in why I picked Strava for this and what it is, checkout my blog post series.
Kibana and Elasticsearch instrumentation results in a comprehensive waterfall chart, showcasing each step chronologically. Leveraging distributed tracing technology, we can combine the different transactions into one view. Let’s delve into the waterfall graph together. I collapsed everything except the one interesting call.
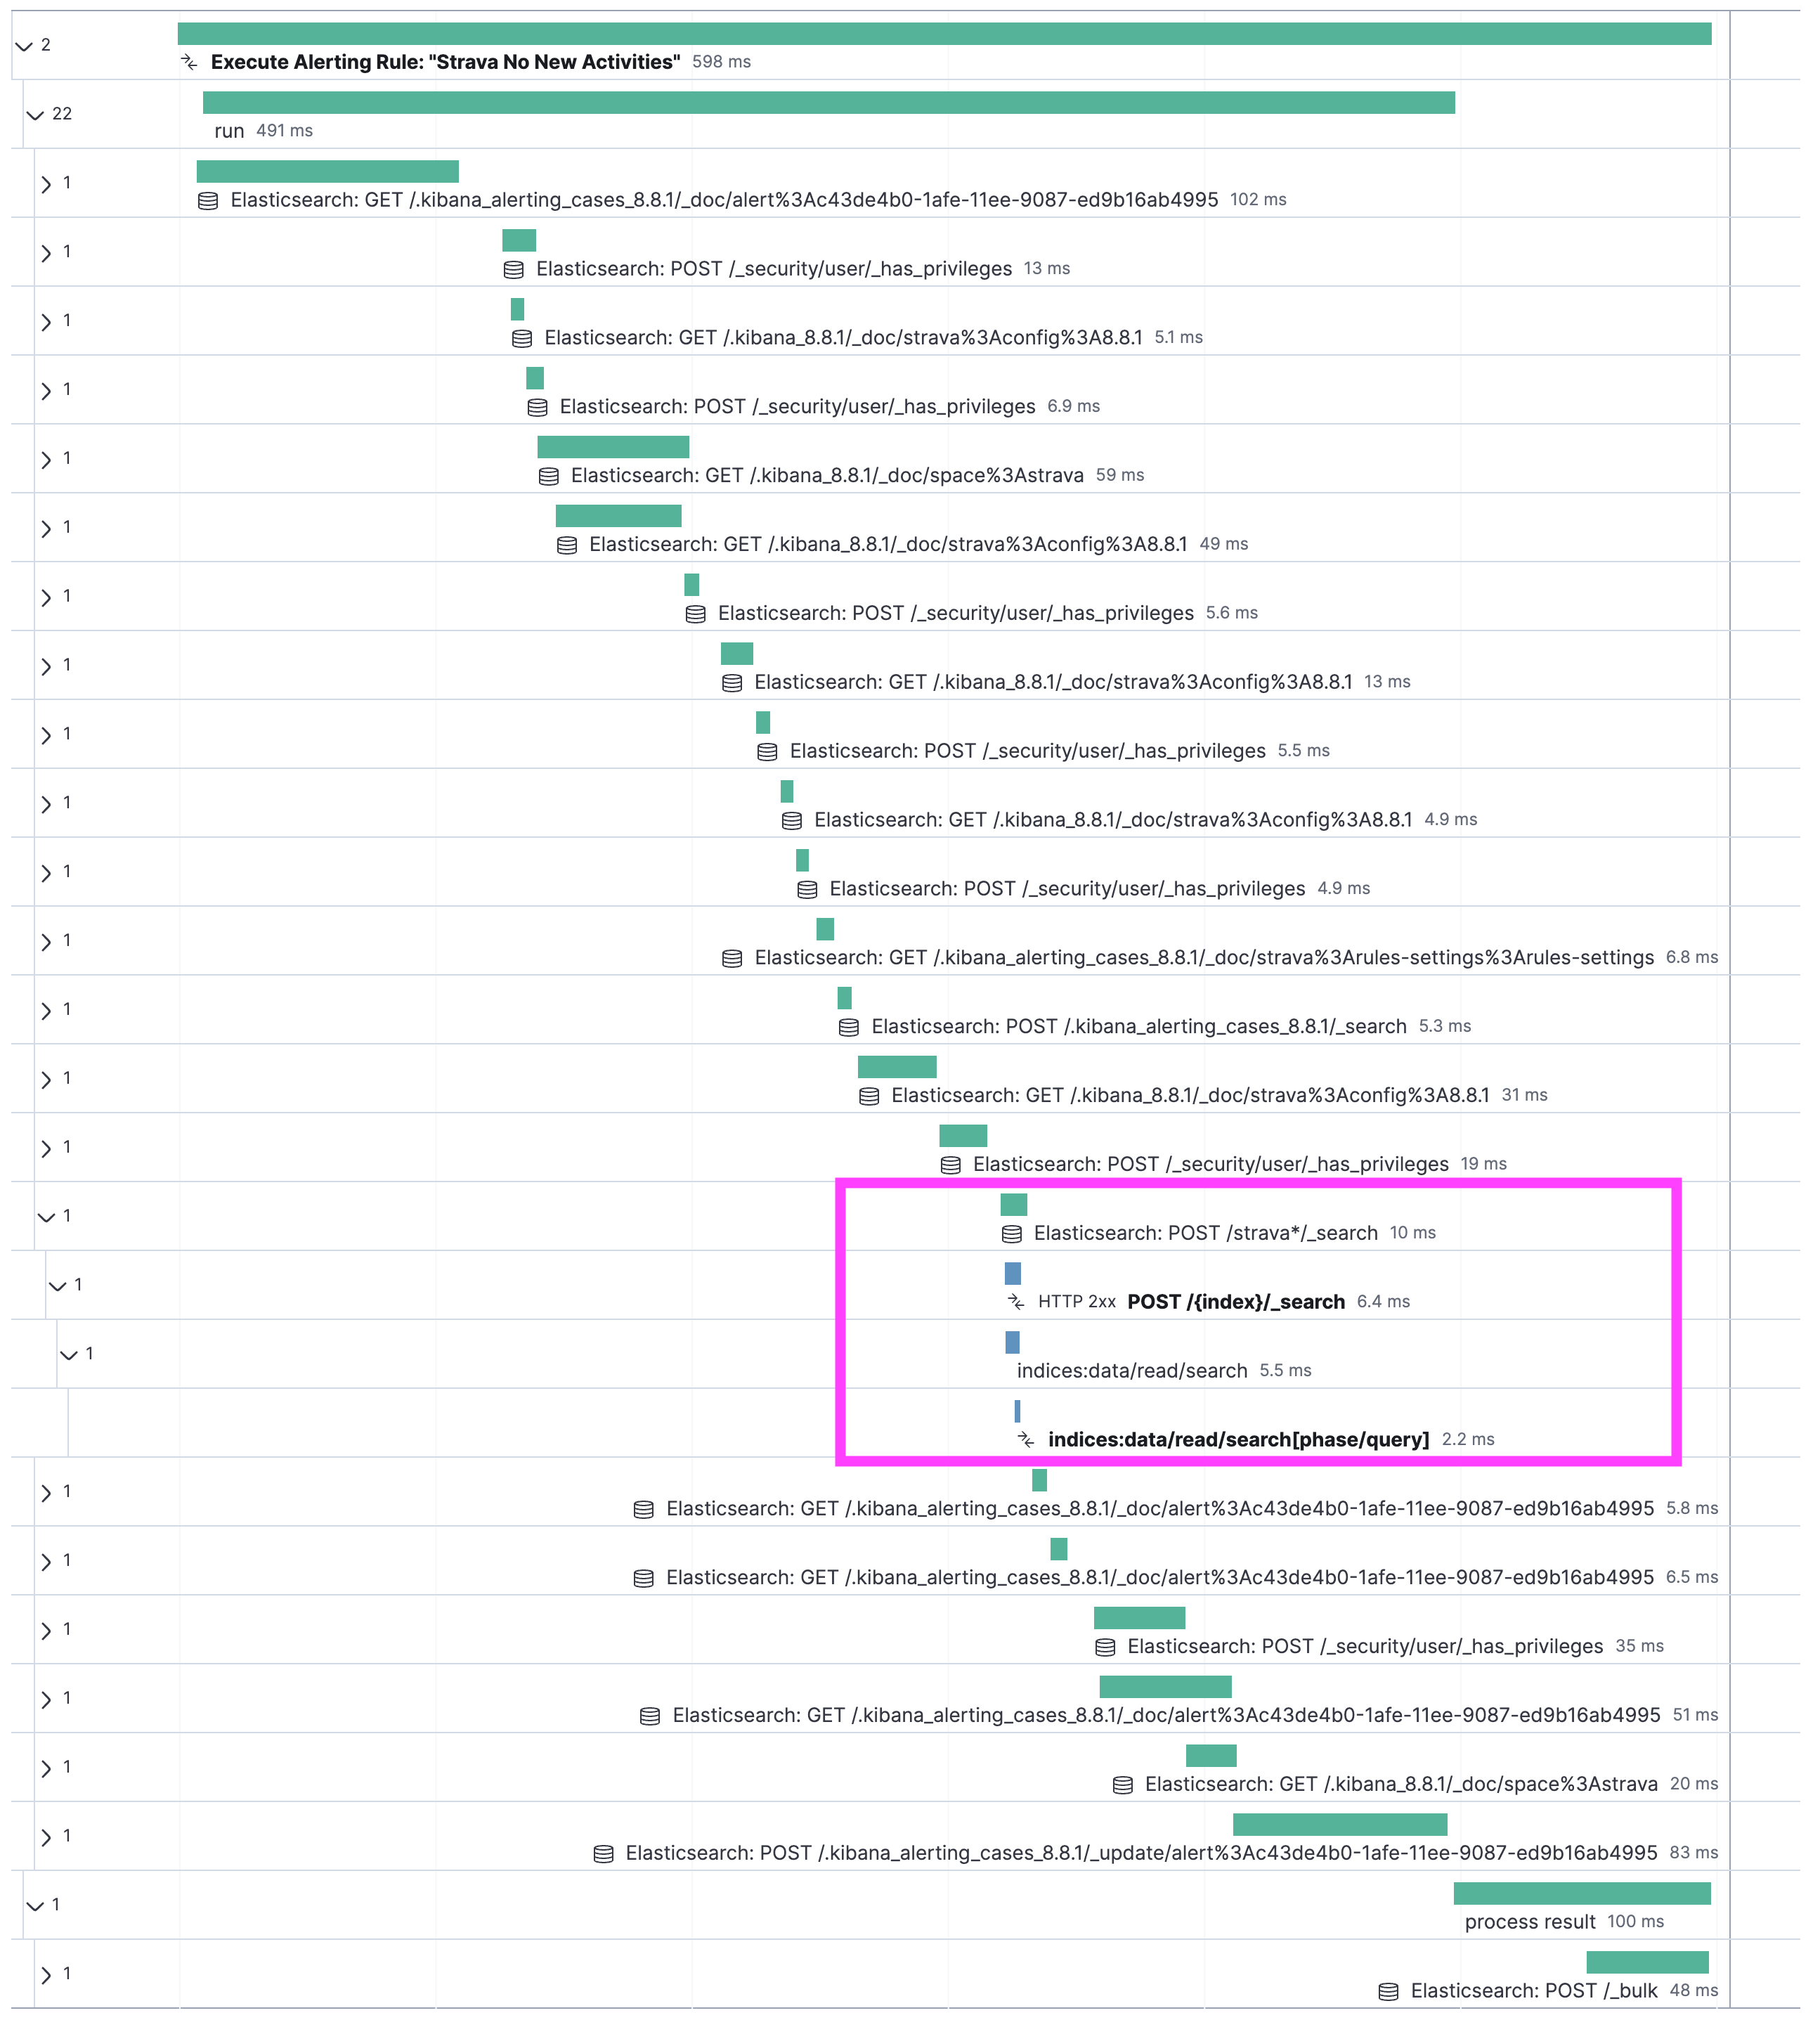
At the top of the waterfall is a bar that stretches over the entire duration. In this case, we can see that the execution of the rule took a total of 598 milliseconds. Dissecting it, we first have a few internal calls, where Kibana checks if a rule is ready to be run and which task it should fulfill. That’s what's happening in those .kibana_alerting_cases. Then it grabs its config and looks up a few more things. At some point further down, all preparation is done and we see something called POST /strava*/_search. That is the most fascinating bit.
First off, we see that the entire search on Elasticsearch took 6.4 milliseconds to complete. The overhead for network connectivity, sending the json, and parsing the answer is 3.6 milliseconds. You can get to that by subtracting the total of the first blue bar (6.4 milliseconds) from the total green bar (10 milliseconds). The green bar represents the call that Kibana executed. The blue bar is just what Elasticsearch is doing, from grabbing the data from the disk, to analyzing and preparing the response, to sending it.
Now, the real magic comes from when we click on the green bar Elasticsearch: POST /strava*/_search. You are presented with a flyout that shows you all sorts of additional information that is collected from different labels, such as deployment name to subscription level. We will rely on those labels to create custom dashboards. The great part is that we capture the query sent to Elasticsearch in a field span.db.statement. If you cannot find it, that’s normal; it’s not mapped, so it’s unsearchable. You can view it in Discover and APM.
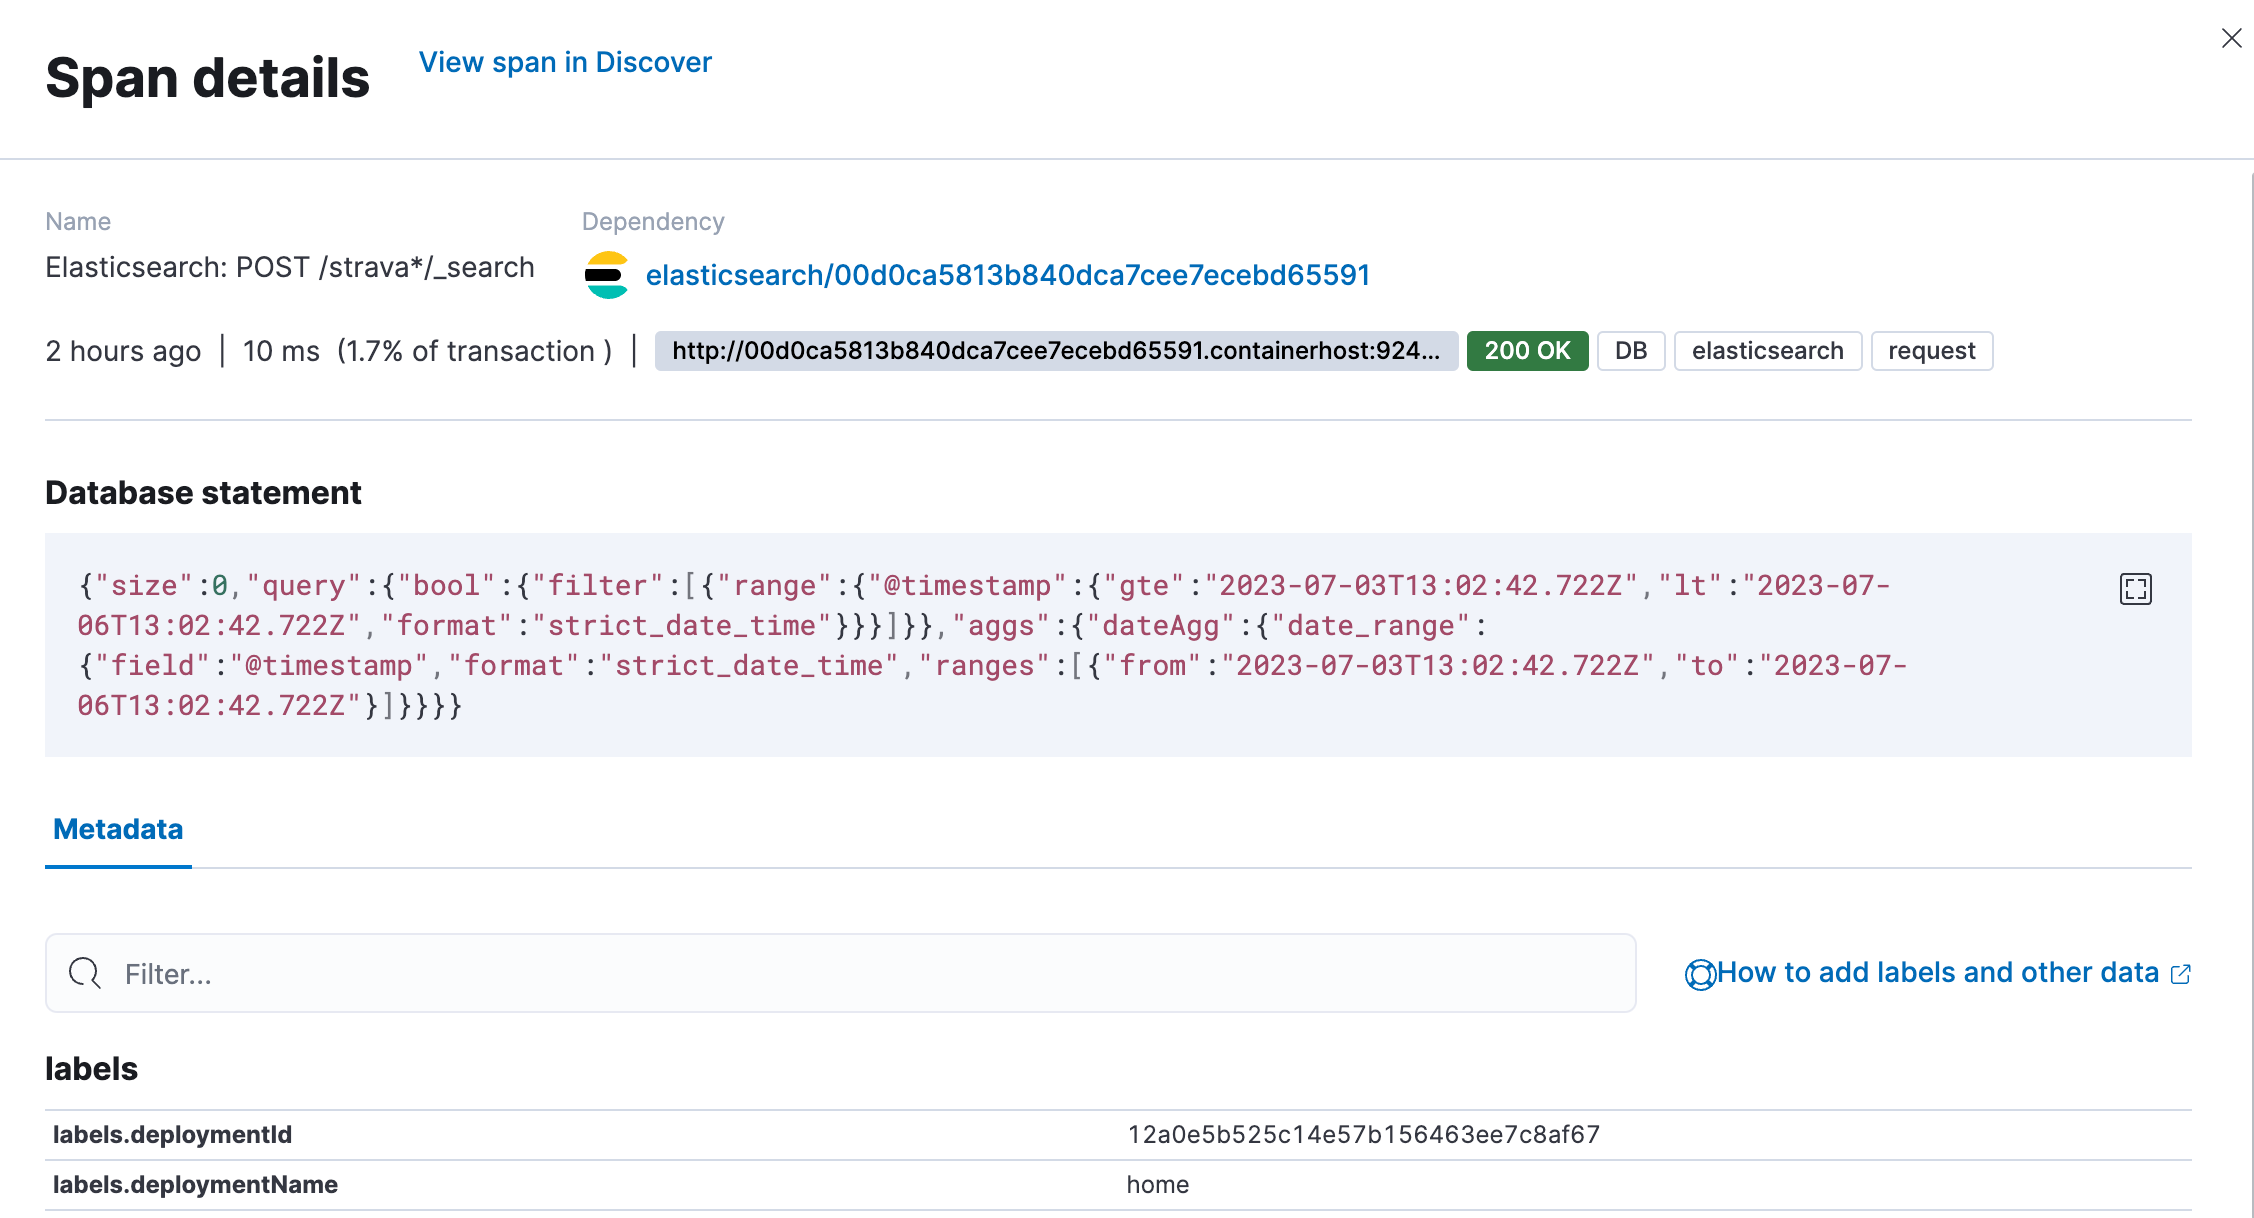
Now that I know the query, I could investigate why it’s slow if somebody built something super advanced that just takes a huge amount of processing time. All of it without relying on slow logs or audit logs to identify this.
Dashboarding time
Examining a single rule at a specific time can be interesting to really dig into what is going on and understand the underlying fundamentals. Having a generalized view will help identify issues at scale. We will build this generalized view together.
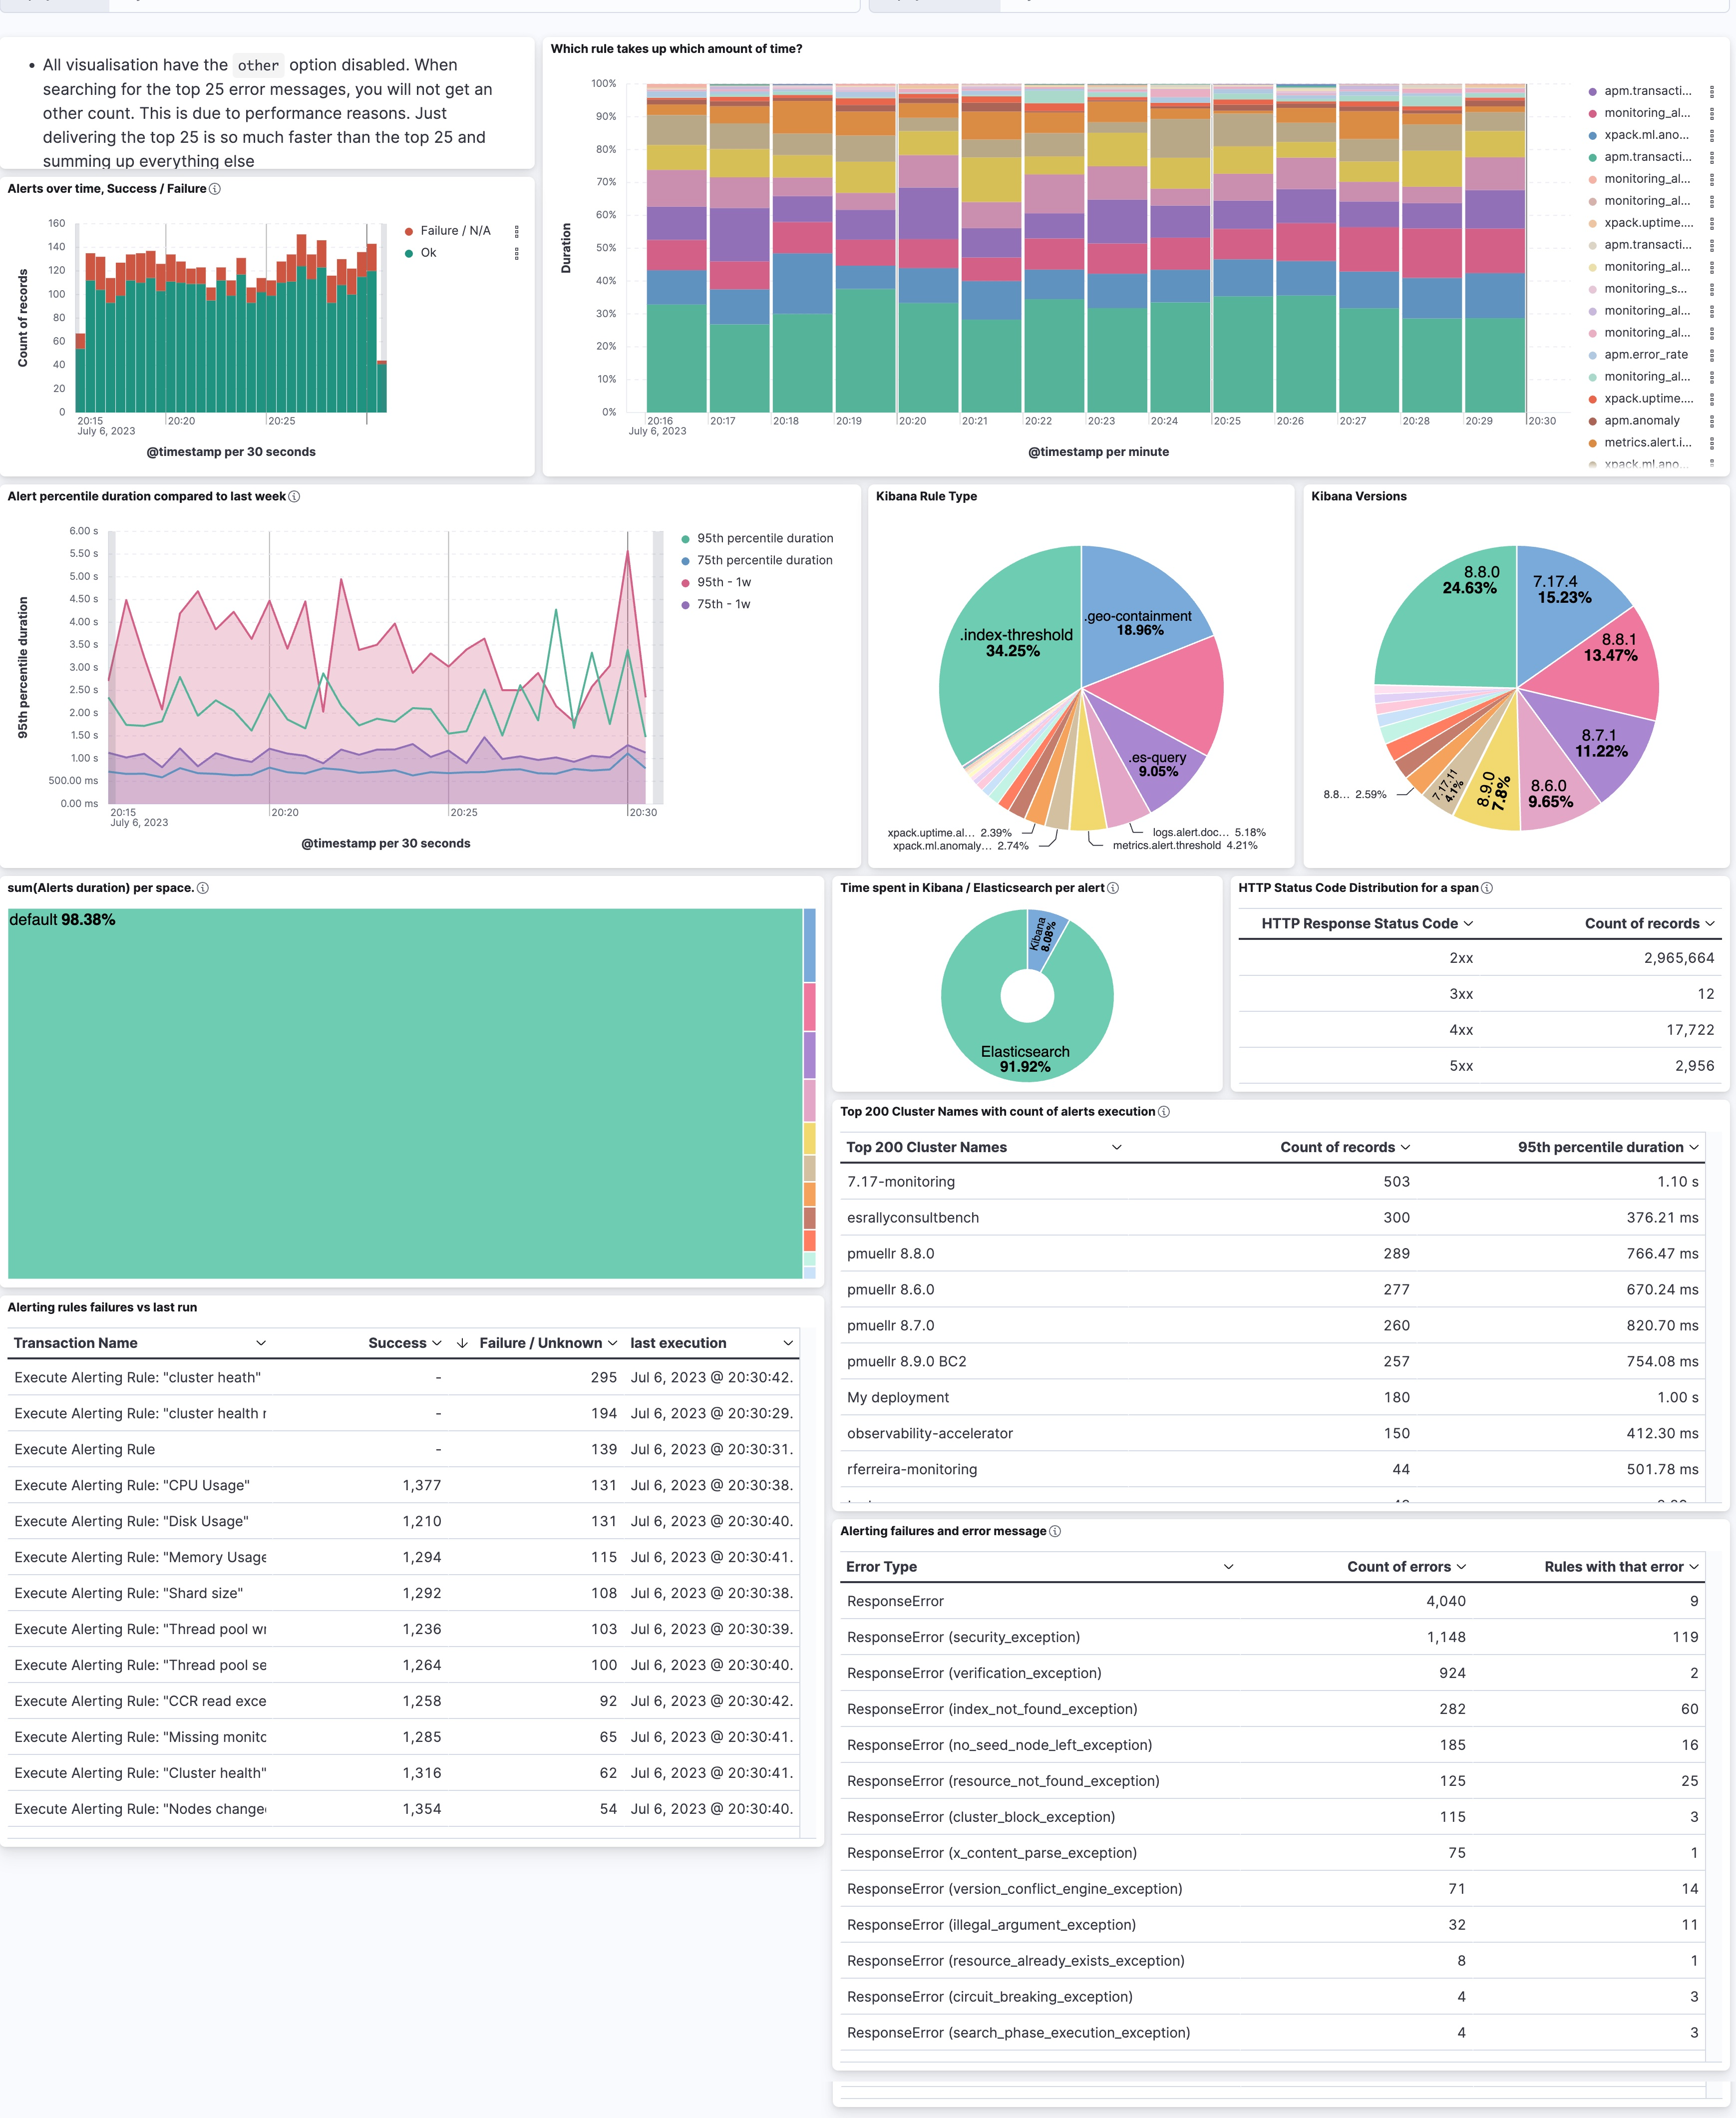
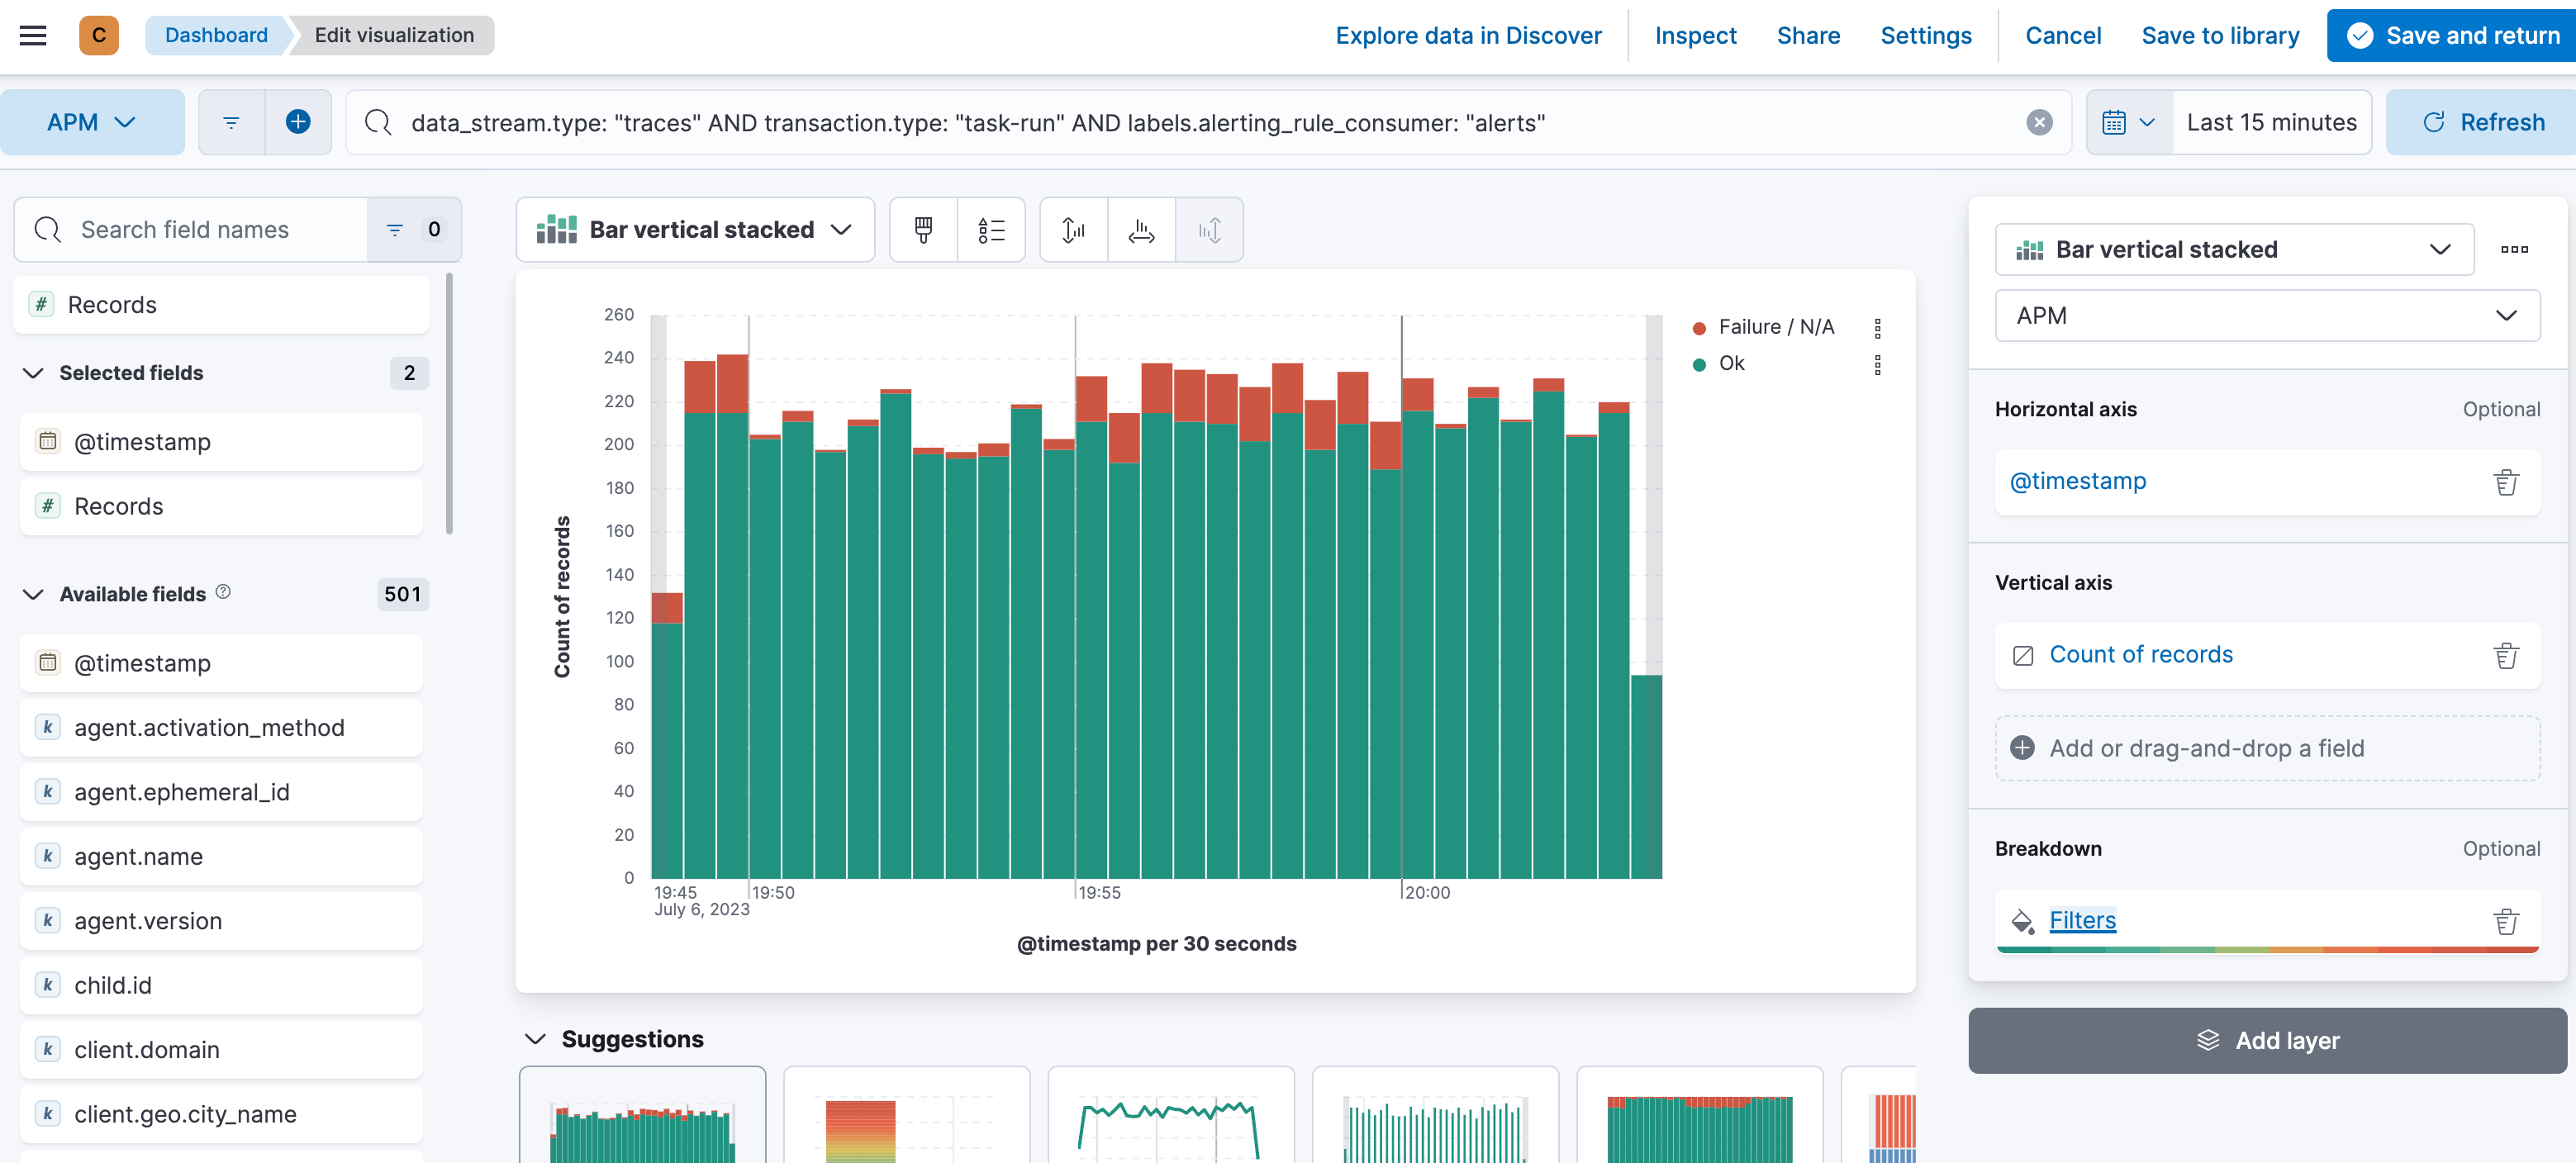
From the top left to the bottom right, we have a unique and summarized view of what is going on. The first chart I recommend building is a simple success versus failure over time. Assuming you have a data view that catches all the APM data (traces-apm*, metrics-apm.*, logs-apm.*), we can speed up certain visualizations by leveraging the constant_keyword feature for the data_stream. Most of the visualizations are built on the traces-apm*, so the first part of the KQL filter is data_stream.type: traces. The second part is the transaction.type, as we selected in the UI task-run at the beginning. We need to append this to the KQL as well, so it’s already data_stream.type: “traces” AND transaction.type: “task-run”. In KQL, there is no need to write the boolean operators such as AND and OR in capital letters. It’s my preference when quickly scanning longer KQLs to see what is searched on. The last one, and here is where the labels come in, is the labels.alerting_rule_consumer: “*”. Many different things also happen under the task-run and we focus on alerting rules in this blog post. Therefore our full KQL is this:
data_stream.type: "traces" AND transaction.type: "task-run" AND labels.alerting_rule_consumer: "*" Then we add a simple date_histogram for @timestamp, a count of records, and a breakdown using filters with event.outcome: “success” for ok and event.outcome: (“failure” OR “unknown”). You might wonder where the unknown comes from — it’s part of the Elastic Common Schema (ECS) definition for this field.
The rest is iterating over different fields. The most important ones are:
- Transaction.duration.us map in the data view using the formatter as duration using the Microseconds. This will then always turn it into human-readable numbers such as seconds, minutes, hours, and so on.
- Labels.alerting_rule_type_id explains what kind of rule. Threshold, Geo Containment, ES Query, etc.
- Service.version represents the version of the service. If you use service.name as a filter, you can grab what versions of Kibana you are running. This can be useful when debugging slow alerts.
- Http.response.status_code represents the status code reported by Elasticsearch to Kibana. Anything that is not 2xx does not automatically mean that the rule run resulted in a failure because there are multiple retry mechanisms configured.
- labels.deploymentName carries the name of the deployment you are observing. This is quite useful to identify if certain deployments have more alerting rules than others.
- Labels.alerting_rule_space_id represents the space in which the rule is running. This is quite useful in identifying usage patterns. Some teams might be using rules more heavily than others.
- Error.exception.type contains a summarized view of the error message. Attention: this is now inside the logs-apm.error* datastream. The KQL looks slightly different: data_stream.type: "logs" AND data_stream.dataset: "apm.error" and service.name: "kibana" AND transaction.type: "task-run".
Summary
In this blog, we went through a journey to identify and deal with the intricacies of Kibana Alerting. The dashboards are available here.
Ready to get started? Begin a free 14-day trial of Elastic Cloud. Or download the self-managed version of the Elastic Stack for free.
The release and timing of any features or functionality described in this post remain at Elastic's sole discretion. Any features or functionality not currently available may not be delivered on time or at all.
Share
- Share on Twitter
Share on Twitter
- Share on LinkedIn
Share on LinkedIn
- Share on Facebook
Share on Facebook
- Share by Email
Share by Email
- Print this page
Print