3 tips to identify Kibana optimizing potential


 Share on Twitter
Share on Twitter

 Share on LinkedIn
Share on LinkedIn

 Share on Facebook
Share on Facebook

 Share by Email
Share by Email

 Print this page
Print
In many organizations, the Elastic Stack — especially Kibana — is maintained by an operations team. Ever wondered what your users are doing in Kibana?
Below, we will show how to get answers to questions like:
- What space is used most?
- What are the top 10 dashboards?
- Is the Discover application used most of the time? Do your users even click on security?
Answering those questions will help educate your users to work more efficiently with Kibana, saving you a lot of trouble and making sure that the user experience is excellent.
Additionally, thanks to the data we are collecting, built-in tools like the anomaly detection machine learning job will inform us if Kibana is having issues.
A short introduction to APM & RUM
Elastic has put significant efforts into making Application Performance Monitoring (APM) and Real User Monitoring (RUM) more accessible. Since this year, we are on the Gartner Quadrant as a Visionary for APM. Elastic APM helps you monitor software services and applications in real-time, allowing you to detect and resolve performance problems quickly, from Java, Go, .NET, Node.js, and Python, to real user monitoring frameworks such as Angular and React.
Read more on Elastic APM: Free and open application performance monitoring.
But what does this have to do with Kibana?
Kibana comes built-in with our NodeJS and RUM agent. You can easily activate that by adding three configuration lines to your Kibana.
elastic.apm.active: true
elastic.apm.serverUrl: url of the APM server
elastic.apm.secretToken: Token that the APM server exposes
Since the full NodeJS agent is baked in, you can use any additional configuration option.
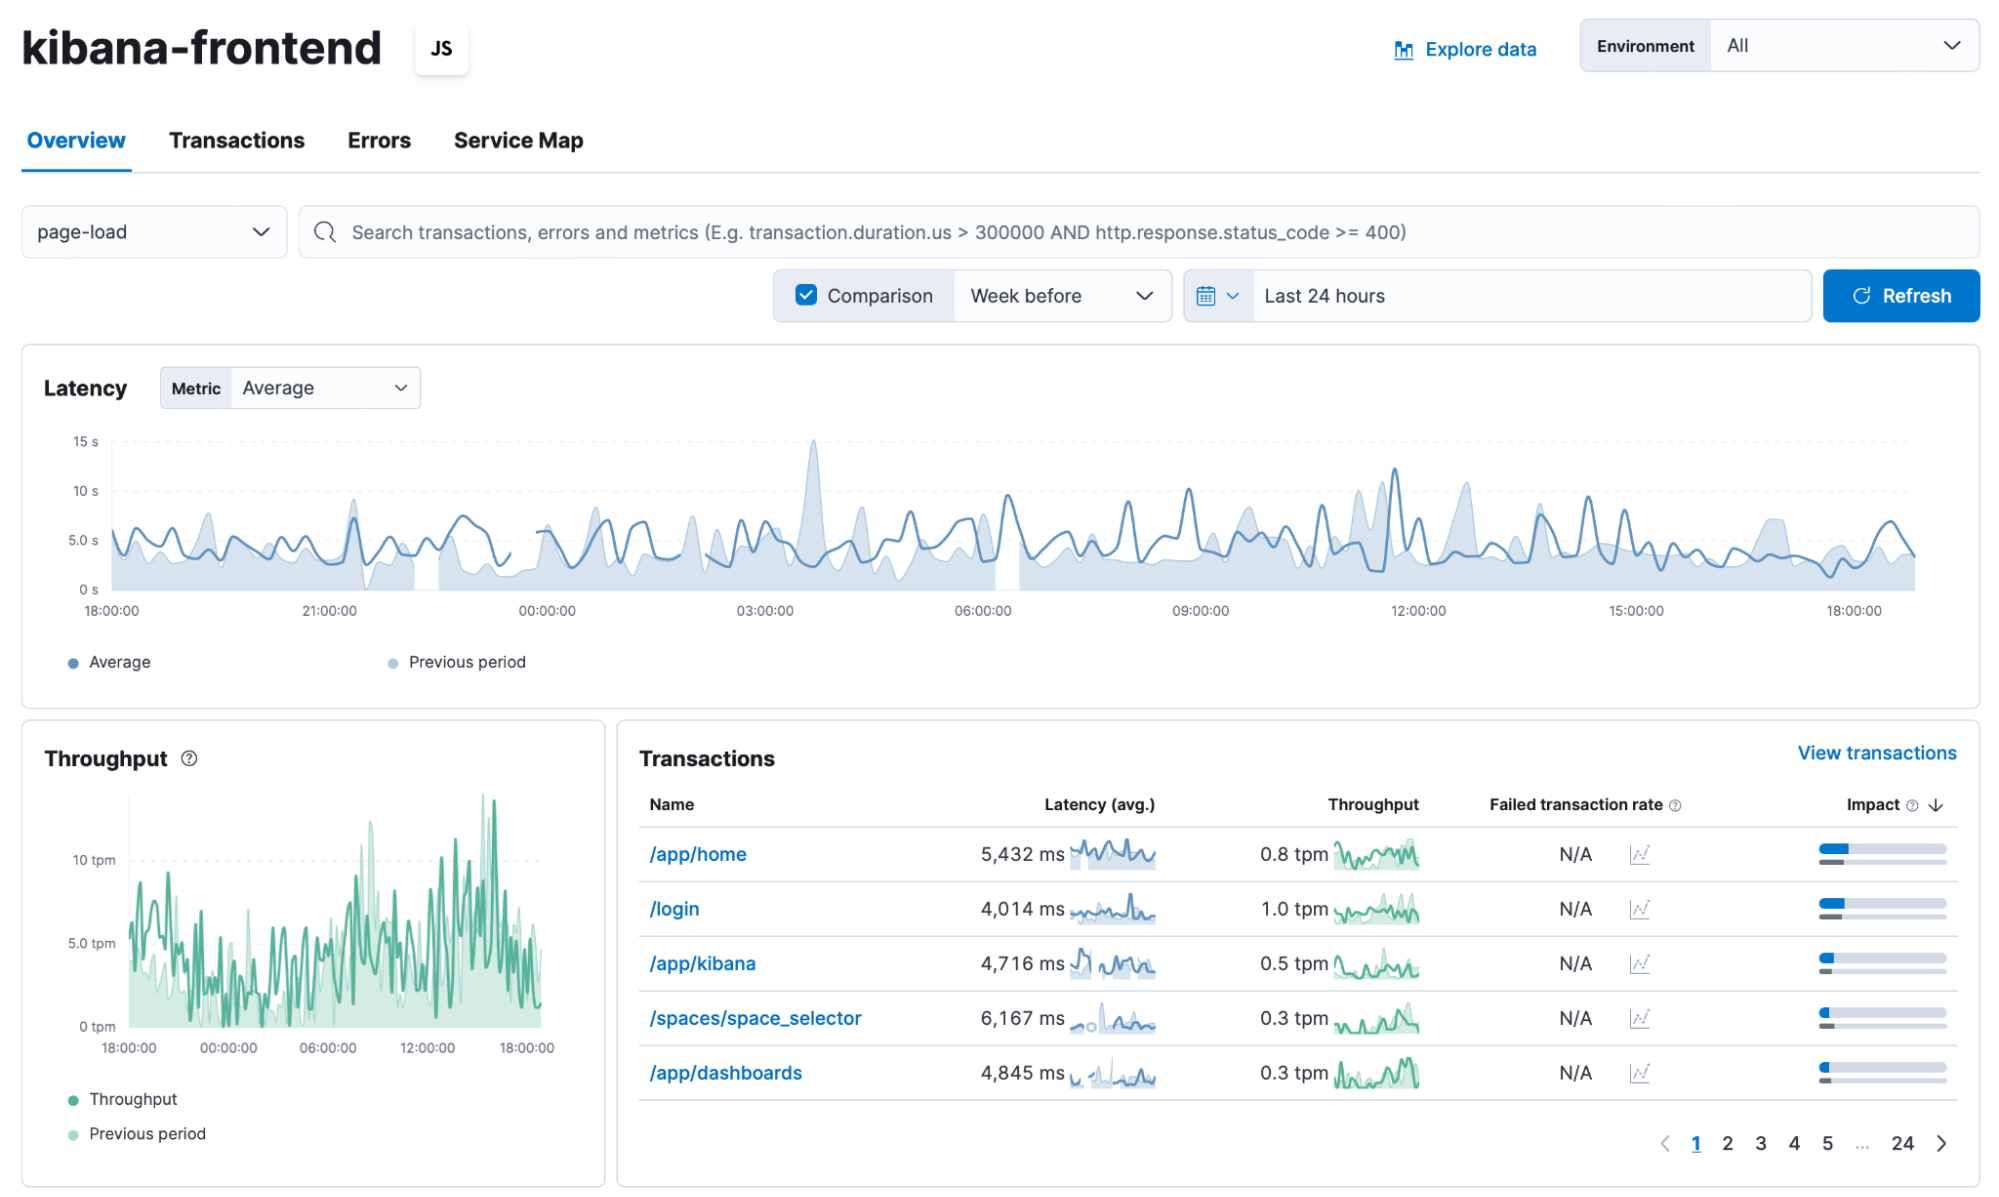
After a successful reboot of Kibana, you should see two new services in the APM view: Kibana and Kibana-frontend. We are going to focus on the Kibana-Frontend part.
Taking a first brief look into the data, you can choose between:
- App-change
- Route-change
- Page-load
- User-interaction
- Http-request
The most interesting part is the page-load, as this tells you how long a user generally waits for a particular page to load. How long does it take to open up a dashboard? You can easily find this by clicking on the /app/dashboard.
This will lead you into the trace view that shows the distribution of the trace duration.
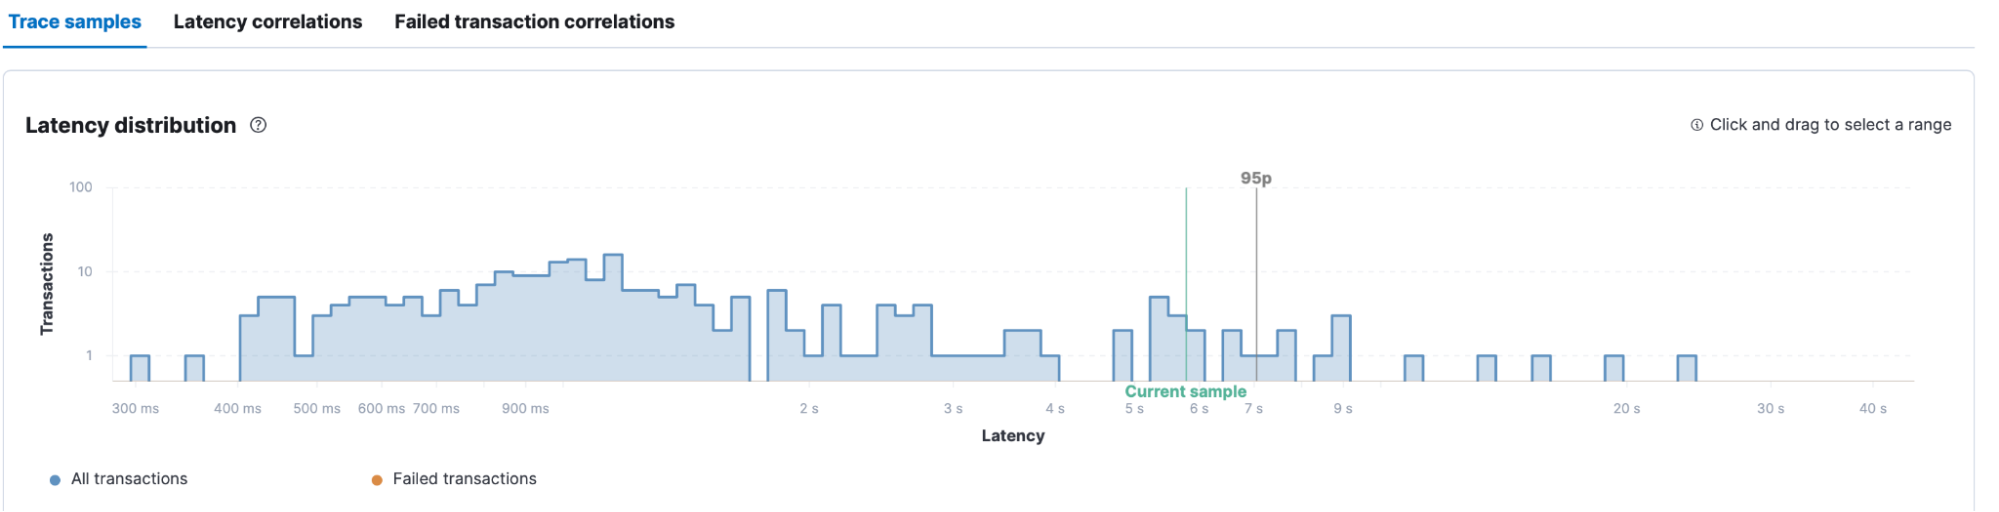
The 95p stands for the 95 percentile. Thus 95% of all data lies before this point. In our case, 95% of all requests are handled within 7 seconds. As you can see, the majority is within 2 seconds.
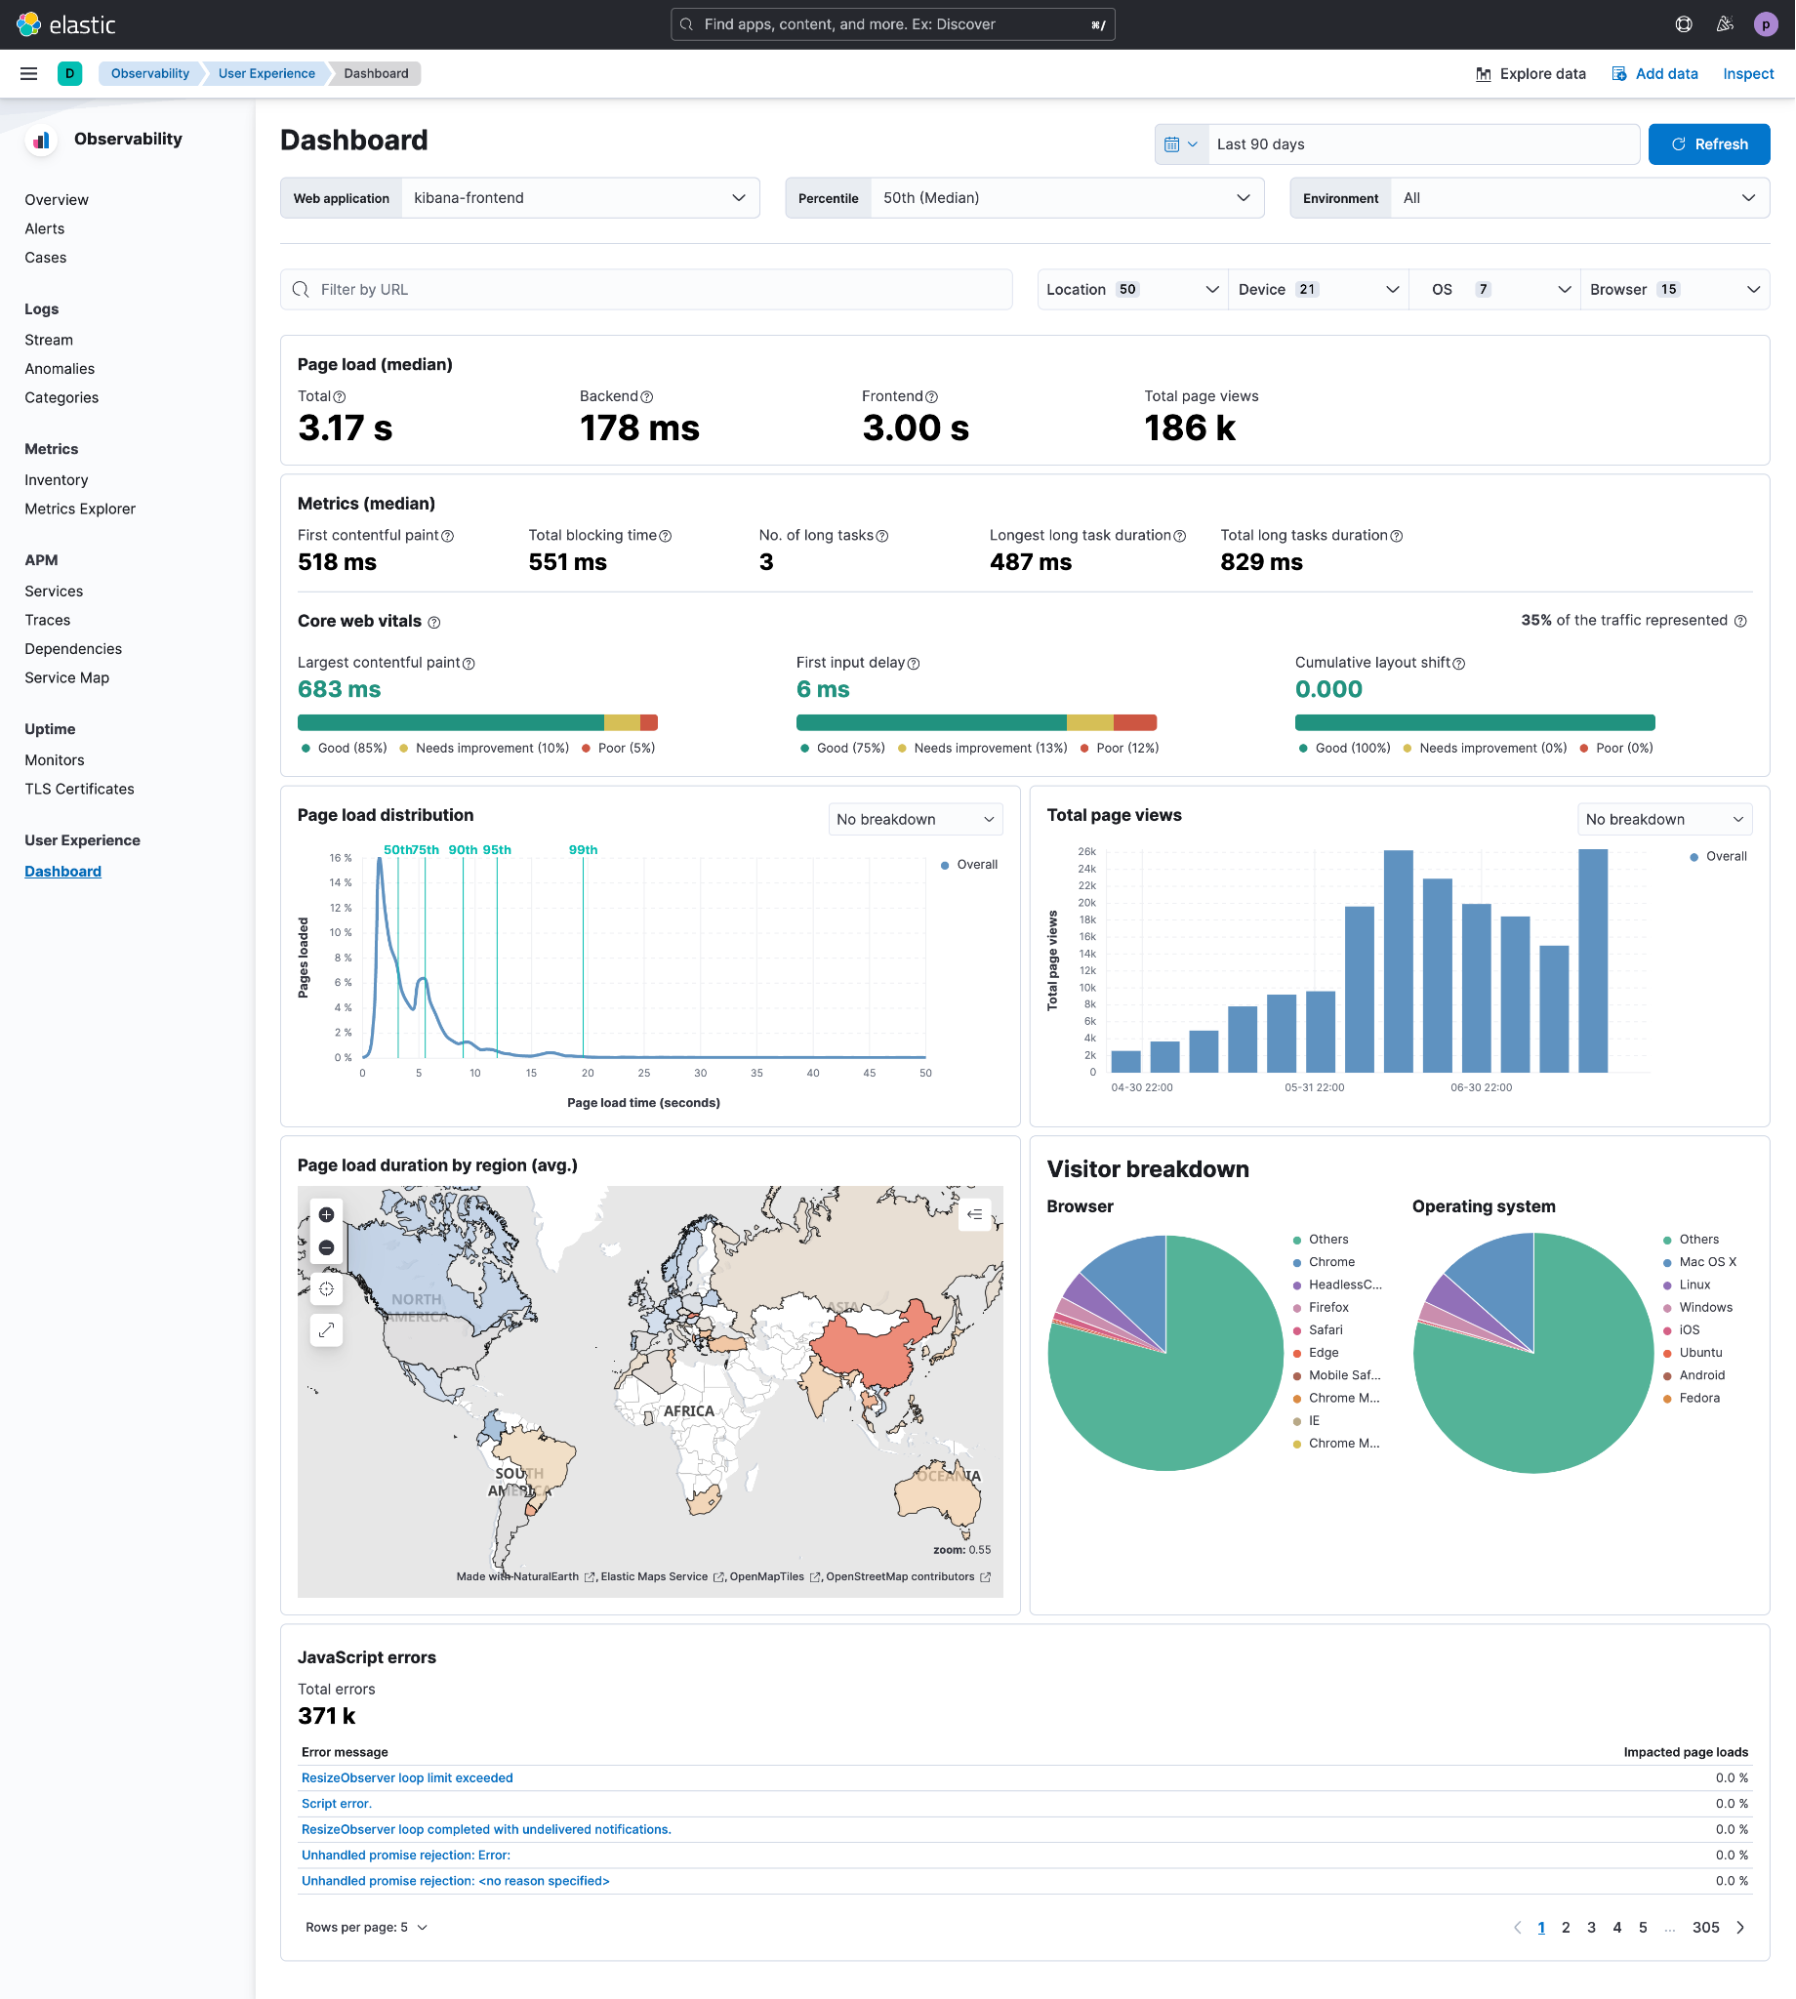
There is much more to discover in the APM view, especially the user experience dashboard that shows you where most of your visitors come from, giving you a browser breakdown.
3 tips for applying the data
We did the groundwork in the beginning and can now start digging into the data. We’ll look at how we can dissect and pivot it to make sure that we can act on it.
Tip #1: Use Runtime fields to dissect the url.path field
Runtime fields allow you to add fields on the fly without reindexing them. Having schema on read in addition to schema on write is a significant accomplishment. Those fields are evaluated only at query time. This allows you to try out new fields and string manipulations without needing to adapt the index.
This is the runtime field we use to dissect the space information stored in the url.path field.
String custom=dissect('/s/%{custom}/').extract($('url.path', ''))?.custom;
if (custom != null) {
   emit(custom);
   return;
} else{
   emit("");
}[Related article: Runtime fields: Schema on read for Elastic]
Tip #2: Use built-in machine learning with anomaly detection to ensure a good user experience
This will help you identify any issues in performance with your Kibana. We all know the classic call to the helpdesk: the webpage is slow today. Thanks to the RUM data, those days are gone. You can compare the data on the fly or rely on machine learning to spot it.
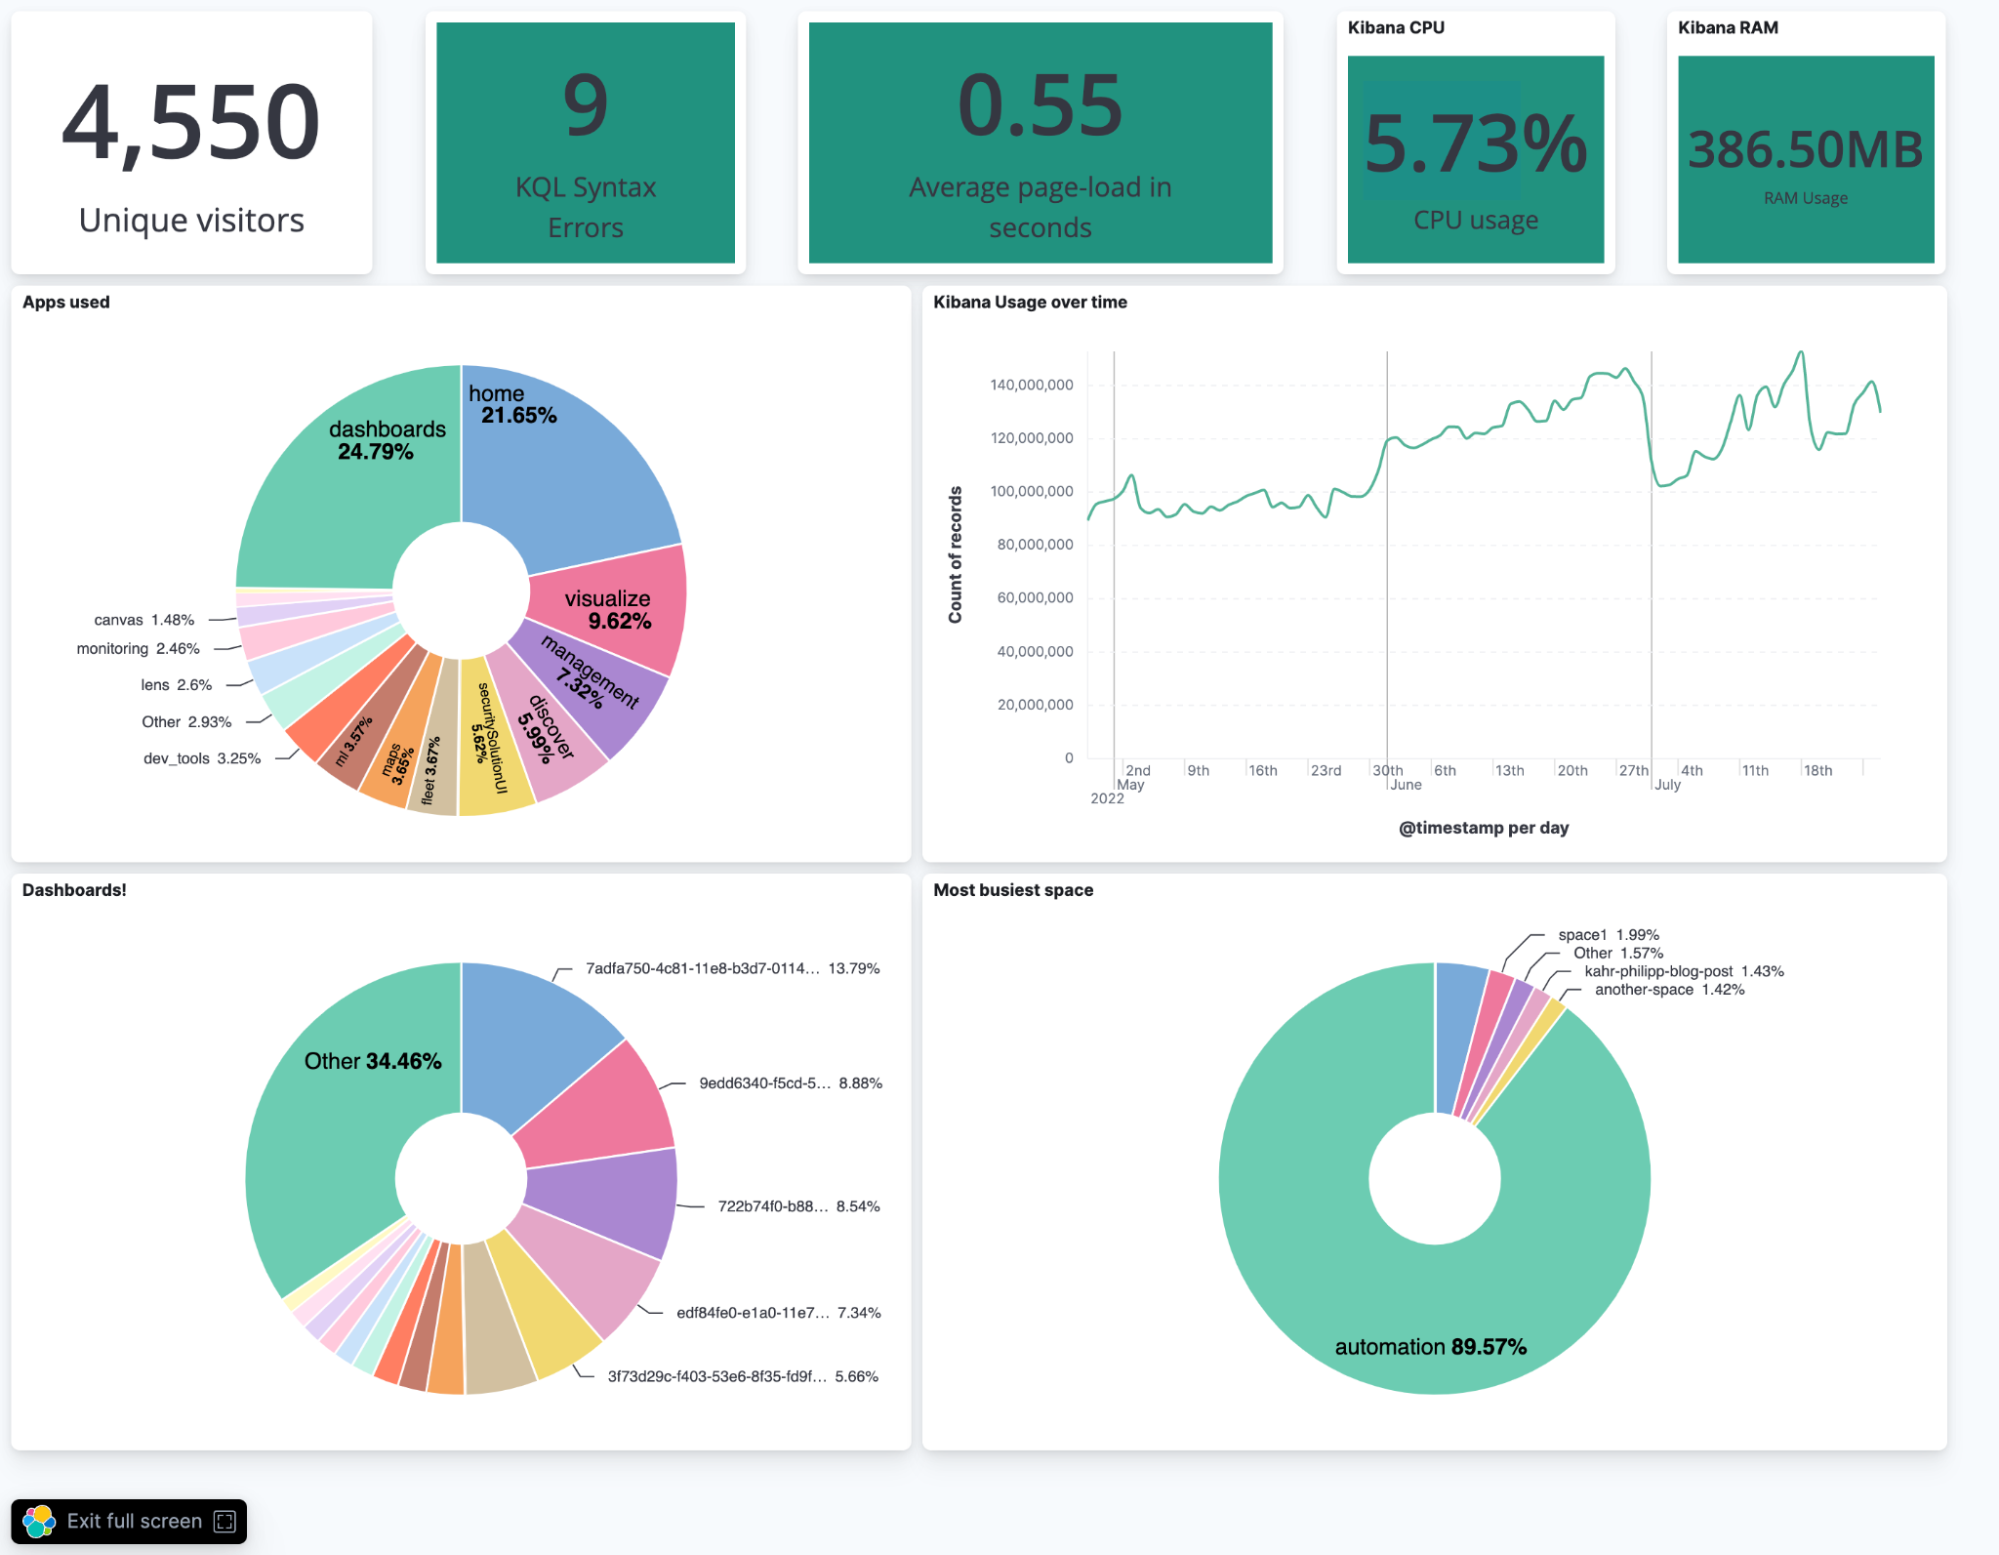
Tip #3: Combine it all in a dashboard!
Using a dashboard, you can identify where your users spend most of their time. (For us, it is definitely in the dashboards app!) You can also identify which dashboards have been loaded and looked at most of the time and which space is the busiest.
Get started with Kibana RUM today
Kibana RUM is simple to implement and gives you great insights into how Kibana is used throughout your organisation. I recommend trying it out as soon as possible — get started with a free trial.
Share
- Share on Twitter
Share on Twitter
- Share on LinkedIn
Share on LinkedIn
- Share on Facebook
Share on Facebook
- Share by Email
Share by Email
- Print this page
Print