OpenTelemetry is rapidly becoming the most expansive project within the Cloud Native Computing Foundation (CNCF), boasting as many commits as Kubernetes and garnering widespread support from customers. Numerous companies are adopting OpenTelemetry and integrating it into their applications. Elastic® offers detailed guides on implementing OpenTelemetry for applications. However, like many applications, pinpointing and resolving issues can be time-consuming.
The Elastic AI Assistant significantly enhances the process, not only in identifying but also in resolving issues. This is further enhanced by Elastic’s new Service Level Objective (SLO) capability, allowing you to streamline your entire site reliability engineering (SRE) process from detecting potential issues to enhancing the overall customer experience.
In this blog, we will demonstrate how you, as an SRE, can detect issues in a service equipped with OpenTelemetry. We will explore problem identification using Elastic APM, Elastic’s AIOps capabilities, and the Elastic AI Assistant.
We will illustrate this using the OpenTelemetry demo, with a feature flag (cartService) that is activated.
Our walkthrough will encompass two scenarios:
-
When the SLO for cart service becomes noncompliant, we will analyze the error through Elastic APM. The Elastic AI Assistant will assist by providing a runbook and a GitHub issue to facilitate issue analysis.
-
Should the SLO for the cart service be noncompliant, we will examine the trace that indicates a high failure rate. We will employ AIOps for failure correlation and the AI Assistant to analyze logs and Kubernetes metrics directly from the Assistant.
Prerequisites and config
If you plan on following this blog, here are some of the components and details we used to set up the configuration:
-
Ensure you have an account on Elastic Cloud and a deployed stack (see instructions here).
-
We used the OpenTelemetry Demo. Directions for using Elastic with OpenTelemetry Demo are here.
-
Additionally you will need to connect your AI Assistant to your favorite LLM. We used Azure OpenAI GPT-4.
-
We also ran the OpenTelemetry Demo on Kubernetes, specifically on GKE.
SLO noncompliance
Elastic APM recently released the SLO (Service Level Objectives) feature in 8.12. This feature enables setting measurable performance targets for services, such as availability, latency, traffic, errors, and saturation or define your own. Key components include:
-
Defining and monitoring SLIs (Service Level Indicators)
-
Monitoring error budgets indicating permissible performance shortfalls
-
Alerting on burn rates showing error budget consumption
We set up two SLOs for cart service:
-
Availability SLO , which monitors its availability by ensuring that transactions succeed. We set up the feature flag in the OpenTelemetry application, which generates an error for EmptyCart transactions 10% of the time.
-
Latency SLO to ensure transactions are not going below a specific latency, which will reduce customer experiences.
Because of the OTel cartservice feature flag, the availability SLO is triggered, and within the SLO details, we see that over a seven-day period the availability is well below our target of 99.9, at 95.5. Additionally all the error budget that was available is also exhausted.
With SLO, you can easily identify when issues with customer experience occur, or when potential issues with services arise before they become potentially worse.
Scenario 1: Analyzing APM trace and logs with AI Assistant
Once the SLO is found as non-compliant, we can dive into cart service to investigate in Elastic APM. The following walks through the set of steps you can take in Elastic APM and how to use the AI Assistant to analyze the issue:
From the video, we can see that once in APM, we took the following steps.
-
Investigated the trace EmptyCart, which was experiencing larger than normal failure rates.
-
The trace showed a significant number of failures, which also resulted in slightly larger latency.
-
We used AIOps failure correlation to identify the potential component causing the failure, which correlated to a field value of FailedPrecondition.
-
While filtering on that value and reviewing the logs, we still couldn’t understand what this meant.
-
This is where you can use Elastic’s AI Assistant to further your understanding of the issue.
AI Assistant helped us analyze the following:
-
It helped us understand what the log message meant and that it was related to the Redis connection failure issue.
-
Because we couldn’t connect to Redis, we asked the AI Assistant to give us the metrics for the Redis Kubernetes pods.
-
We learned there were two pods for Redis from the logs over the last two hours.
-
However, we also learned that the memory of one seems to be increasing.
-
It seems that Redis restarted (hence the second pod), and with this information we could dive deeper into what happened to Redis.
You can see how quickly we could correlate a significant amount of information, logs, metrics, and traces through the AI Assistant and Elastic’s APM capabilities. We didn’t have to go through multiple screens to hunt down information.
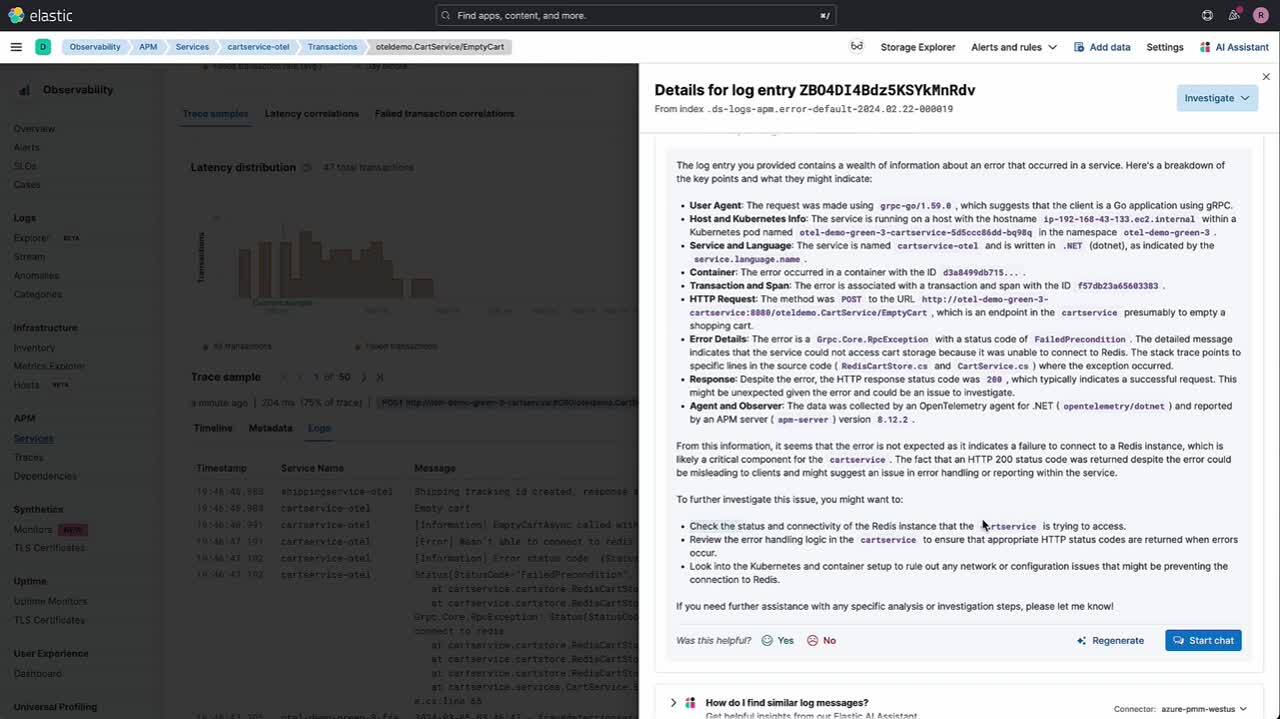
Scenario 2: Analyzing APM error with AI Assistant
Once the SLO is found as noncompliant, we can dive into cart service to investigate in Elastic APM. The following walks through the set of steps you can take in Elastic APM and use the AI Assistant to analyze the issue:
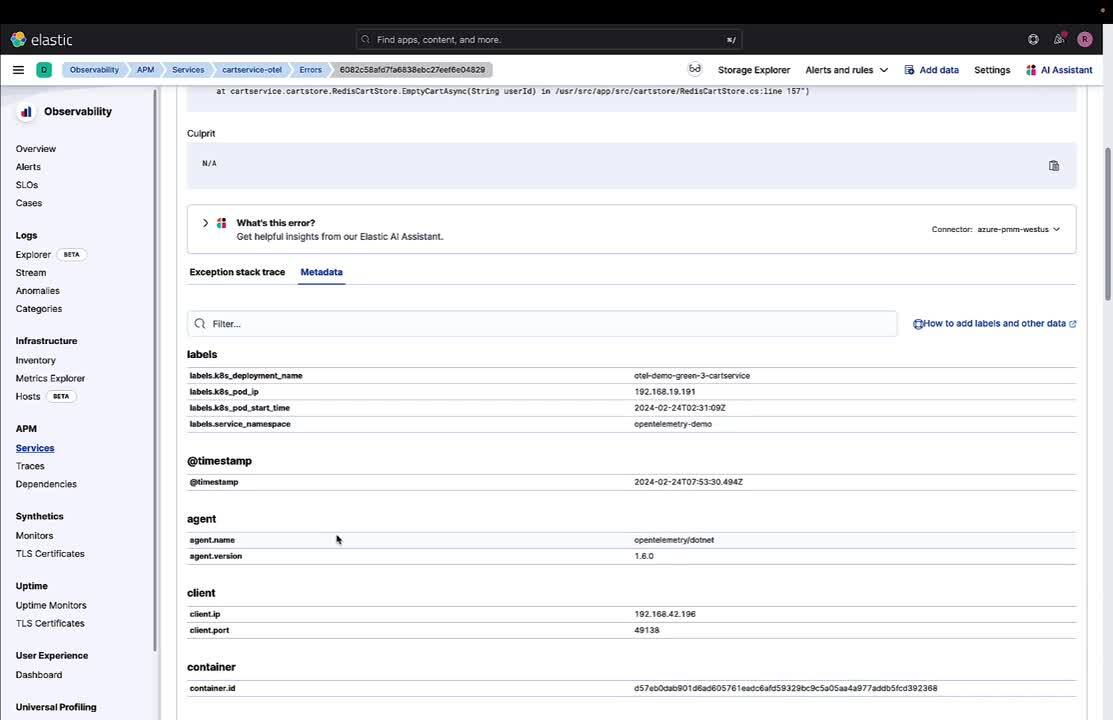
From the video, we can see that once in APM, we took the following steps:
-
We noticed a specific error for the APM service.
-
We investigated this in the error tab, and while we see it’s an issue with connection to Redis, we still need more information.
-
The AI Assistant helps us understand the stacktrace and provides some potential causes for the error and ways to diagnose and resolve it.
-
We also asked it for a runbook, created by our SRE team, which gives us steps to work through this particular issue.
But as you can see, AI Assistant provides us not only with information about the error message but also how to diagnose it and potentially resolve it with an internal runbook.
Achieving operational excellence, optimal performance, and reliability
We’ve shown how an OpenTelemetry instrumented application (OTel demo) can be analyzed using Elastic’s features, especially the AI Assistant coupled with Elastic APM, AIOps, and the latest SLO features. Elastic significantly streamlines the process of identifying and resolving issues within your applications.
Through our detailed walkthrough of two distinct scenarios, we have seen how Elastic APM and the AI Assistant can efficiently analyze and address noncompliance with SLOs in a cart service. The ability to quickly correlate information, logs, metrics, and traces through these tools not only saves time but also enhances the overall effectiveness of the troubleshooting process.
The use of Elastic's AI Assistant in these scenarios underscores the value of integrating advanced AI capabilities into operational workflows. It goes beyond simple error analysis, offering insights into potential causes and providing actionable solutions, sometimes even with customized runbooks. This integration of technology fundamentally changes how SREs approach problem-solving, making the process more efficient and less reliant on manual investigation.
Overall, the advancements in Elastic’s APM, AIOps capabilities, and the AI Assistant, particularly in handling OpenTelemetry data, represent a significant step forward in operational excellence. These tools enable SREs to not only react swiftly to emerging issues but also proactively manage and optimize the performance and reliability of their services, thereby ensuring an enhanced customer experience.
Try it out
Existing Elastic Cloud customers can access many of these features directly from the Elastic Cloud console. Not taking advantage of Elastic on cloud? Start a free trial.
The release and timing of any features or functionality described in this post remain at Elastic's sole discretion. Any features or functionality not currently available may not be delivered on time or at all.
In this blog post, we may have used or referred to third party generative AI tools, which are owned and operated by their respective owners. Elastic does not have any control over the third party tools and we have no responsibility or liability for their content, operation or use, nor for any loss or damage that may arise from your use of such tools. Please exercise caution when using AI tools with personal, sensitive or confidential information. Any data you submit may be used for AI training or other purposes. There is no guarantee that information you provide will be kept secure or confidential. You should familiarize yourself with the privacy practices and terms of use of any generative AI tools prior to use.
Elastic, Elasticsearch, ESRE, Elasticsearch Relevance Engine and associated marks are trademarks, logos or registered trademarks of Elasticsearch N.V. in the United States and other countries. All other company and product names are trademarks, logos or registered trademarks of their respective owners.